 Xin Chen
 Zheng Zhou
 Yuming Zhu3
- 1School of Civil Engineering, Suzhou University of Science and Technology, Suzhou, Jiangsu, China
- 2State Key Laboratory of Disaster Prevention and Mitigation of Explosion and Impact, Chinese People’s Liberation Army Engineering University, Nanjing, Jiangsu, China
- 3College of Civil and Transportation Engineering, Hohai University, Nanjing, Jiangsu, China
Seismic stability of soil slopes is a critical issue within engineering geology, with a particular emphasis on understanding how geosynthetic strength indicators influence the stability of reinforced slopes. This paper employs the limit equilibrium method, in conjunction with the log spiral curve model, to evaluate the seismic stability of reinforced soil slopes considering varying pullout strength indicators. The proposed method is verified by comparing with a same case in the corresponding reference. Then, effects of the non-uniform pullout strength distribution on the seismic reinforcement of slopes is revealed theoretically by changing parameters such as slope angles, friction angles of fill soils, and design length of geosynthetics. The results indicated that when lengths of the geosynthetics are reduced, the seismic yield accelerations calculated using the ultimate bearing capacity is significantly smaller than that obtained using the ultimate pullout strength. It is suggested that the nonuniform pullout strength distribution should be taken into consideration to ensure the stability of slopes under seismic actions. Additionally, this study provides new perspectives and methods for the theoretical study and engineering application of geosynthetic reinforcement techniques.
1 Introduction
The seismic stability of soil slopes is a critical concern in geotechnical earthquake engineering. Among the various techniques for stabilizing slopes, soil reinforcement, particularly with geosynthetics, is widely recognized as a cost-effective and efficient method [1–5]. Consequently, understanding the behavior of reinforced soil slopes under seismic loading is essential for improving design and performance.
Research conducted post the 1999 Chi-Chi earthquake highlighted that reinforced soil structures outperformed those without reinforcement. Subsequent evaluations of seismic designs have been conducted through earthquake case studies and laboratory tests [6, 7]. Research by Perez and Holtz [8] revealed that reinforcement spacing, and length significantly influence the yield acceleration of reinforced slopes, while [9] identified embankment density and reinforcement stiffness as key factors in seismic performance. Laboratory studies showed that reinforced soil slopes exhibit higher natural frequencies than unreinforced slopes [10]. Hazari et al. [11] further confirmed, through laboratory and numerical studies, that soil reinforcement reduces both deformations and acceleration response, with geogrids being identified as one of the best reinforcements for slope stabilization [12]. Further, shaking table tests by Huang et al. [13] underscored the critical importance of reinforcement tensile strength in determining yield acceleration, while Zeng et al. [14] conducted large-scale tests to analyze pullout forces and methods to enhance geogrid reinforcement performance.
Yazdandoust [15] determined the equivalent seismic coefficients for pseudo-static analysis of reinforced soil structures based on shaking table tests, comparing them with current specifications. Patra and Shahu [16] conducted a pseudo-static analysis of a reinforced soil wall, examining the effects of horizontal seismic coefficients, backfill properties, and wall geometry. Sarbishei and Fakher [17] proposed a new dynamic model using the pseudo-static method and the horizontal slice method, estimating acceleration distribution along the wall height by applying the principle of minimum potential energy. To address the limitations of the pseudo-static method, Steedman and Zeng [18] introduced the pseudo-dynamic method in 1990, offering a more accurate representation of earthquake dynamics. Basha and Babu [19] applied this method to optimize the design of reinforced soil structures under bi-directional sinusoidal waves. Yan et al. [20] used the pseudo-dynamic method with limit analysis to assess the stability of reinforced soil slopes during earthquakes, incorporating dynamic variations in anchor cable axial forces, which yielded a larger dynamic safety coefficient and smaller variation compared to methods that ignore these variations. Ruan and Sun [21] employed the pseudo-dynamic method to calculate the safety factor for reinforced soil walls under seismic conditions.
Many reinforced soil slopes have failed under earthquake-induced vibrations in recent years, with pullout failures being particularly common [22, 23]. Current specifications [24, 25] often do not account for the impact of pullout failures on the internal stability of reinforced soil slopes. Moreover, the distribution of reinforcement pullout resistance during seismic events is non-uniform, complicating stability evaluations. This paper introduces a seismic stability evaluation method for reinforced soil slopes, incorporating the limit equilibrium and log-spiral failure mechanisms and accounting for varying pullout resistance indices. Case studies validate the proposed method, and the effects of reinforcement arrangement, pullout strength distribution, and total pullout resistance on seismic yield acceleration and overall stability are analyzed.
2 Reinforcement evaluation method and verification
The limit equilibrium method posits that soil behaves as an ideal rigid-plastic material, verifying its assumptions against a defined failure surface. In the assessment calculations for reinforced soil slopes, it is assumed that both the soil and geosynthetics reach a limit state. This international mainstream method is widely used in engineering applications due to its ease in establishing calculation models and considering the resistance strength provided by each layer of geosynthetics. Here, a rotational failure mechanism is adopted, assuming that the slope sliding surface is a logarithmic spiral curve. Based on the limit equilibrium method, the soil slope reinforced with geosynthetics satisfies the moment equilibrium condition for the sliding body. In Figure 1, a calculation model for geosynthetic-reinforced slopes is established considering varies geosynthetics strength indices. This section focuses on the basic theoretical explanation and derivation using a single-layer reinforced soil slope.
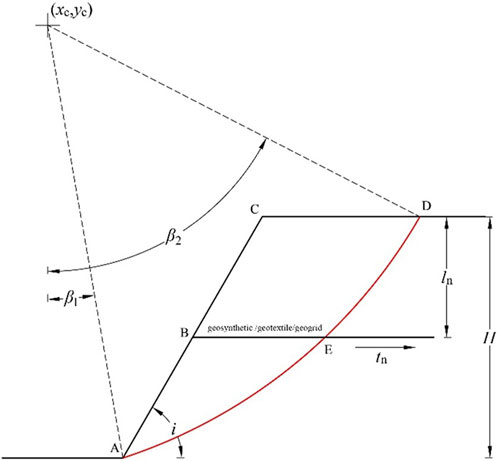
Figure 1. A slope model based on log spiral slip surface.
The equation of the log spiral curve can be expressed as:
in which r represents the distance from the rotation center to any point on the sliding surface, A is the log spiral curve constant, β is the rotation angle from the rotation center to any point on the sliding surface, and φ is the internal friction angle of the soil.
According to Equation 1, the coordinates of any point on the sliding surface can be expressed as:
Given the known angles β1 and β2, the coefficient A and the rotation center c coordinate expressions in Equation 2 can be obtained as follows (Equations 3, 4):
If the slope reaches a limit equilibrium state under the gravity and horizontal seismic force, the equilibrium equation can be obtained:
In Equation 5, Mw is the moment of the soil’s gravity on the sliding surface, Ms is the moment of the horizontal seismic force (pseudo-static method), Mc is the resisting moment provided by the soil’s shear strength, and Mt is the moment of the geosynthetics’ resistance strength, respectively.
The moment Mw can be obtained by subtracting the moments M2 and M3 of gravities of triangles OCA and OCD from the moment M1 of sector OAD. The expression can be written as:
And the expressions for M1, M2, and M3 in Equation 6 are shown below:
By substituting the results in Equation 7 into Equation 6, the moment Mw can be obtained. The moment of the external force provided by the horizontal seismic acceleration can be expressed as:
In Equation 8, Ms1, Ms2, and Ms3 are expressed as:
Similarly, the moment Ms can be obtained by substituting the results in Equation 9 into Equation 8
Following the assumption of the log spiral curve sliding surface, the normal stress σ and the shear stress component σtan(φ) on the sliding surface are directed towards the rotation center. Therefore, only the anti-slip effect of the shear stress component c needs to be considered when calculating the moment Mc. The expression of Mc is given in Equation 10 below.
The expression for the moment Mt provided by each layer of geosynthetics is shown in Equation 11:
where tn is the pullout resistance provided by the geosynthetics.
In the past reinforced design and verification, the geosynthetics’ ultimate resistance strength tm is often used for calculation. But in actual applications, the actual pullout bearing capacity of the geosynthetics is not uniformly distributed from the front to the back end as shown in Figure 2. Due to the front-end pullout force of the geosynthetics with measures such as overturning and packaging, this paper only takes into consideration the characteristic of the reduction of the pullout bearing capacity at the end of the reinforcement geosynthetics.
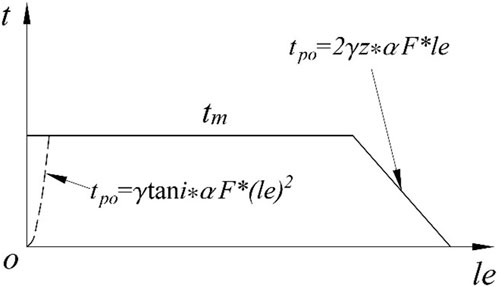
Figure 2. The resistance strength along the length of geosynthetic material.
In Figure 2, the envelope composed of the geosynthetics’ ultimate tensile strength tm and the bearing capacity tpo is the maximum envelope that can be provided by each point of the geosynthetics. When the sliding surface and the distribution of the geosynthetics are known, the position where the sliding surface passes through the geosynthetics can be determined through geometric relationships. And the maximum pullout force that the corresponding geosynthetics can provide in that case can be confirmed through the function tn. F∗ in Figure 2 is the pullout resistance coefficient, i.e., the interface friction coefficient, and α is the nonlinear distribution effect coefficient considering the interaction between the geosynthetics and the soil. The function tn can be expressed as in Equation 12:
By combining the position yn of the geosynthetics with the log spiral surface equation, the specific position where the sliding surface passes through the corresponding geosynthetic can be obtained to determine the maximum pullout force. The following is the corresponding set of equations:
Substituting the above derived Equation 13 into Equation 5, the expression for theyield acceleration k under the corresponding state can be obtained as shown in Equation 14:
Similarly, the safety factor Fs under static conditions can be given in Equation 15:
Here, an example from Ling et al. [26] is used to verify the limit equilibrium method employed in this paper. The example model is a reinforced soil slope that is 6 m high with a slope ratio of 1:1, with a unit weight γ of 20 kN/m³ and a designed internal friction angle φ of 30°. According to the charts in Ling et al. [26], the total pullout resistance required from the geosynthetics in the reinforced zone is 32.4 kN/m. This strength is evenly distributed across the design tensile strength of each layer of geosynthetics, assuming uniform pullout strength at all points along the geosynthetics. The lengths of the geosynthetics L are 0.7 times the height H. By inputting the aforementioned parameters into the limit equilibrium method used in this section, the safety factor Fs of 1.02 is obtained, indicating that the method and algorithm program used in this paper are valid.
3 Seismic stability review results of the reinforced soil slope
Building on the above verification, and employing the seismic yield acceleration of the reinforced soil slope as a key metric, this study analyzes how the end decay of geosynthetics’ pullout strength impacts seismic stability across varying slope angles and soil fill conditions. This paper takes a reinforced soil slope with a height of 10 m as the basic model, with slope angles β of 45°, 60°, and 70°, and internal friction angles φ of the fill soil being 25°, 30°, 35°, and 40°. The designed ultimate pullout strength of a single geosynthetic is 100 kN/m, and there are 10 geosynthetics uniformly distributed within the slope. By using the proposed calculation method, the corresponding seismic yield accelerations for the slope under different design lengths of the geosynthetics are calculated, and the results are shown in the Figure 3.
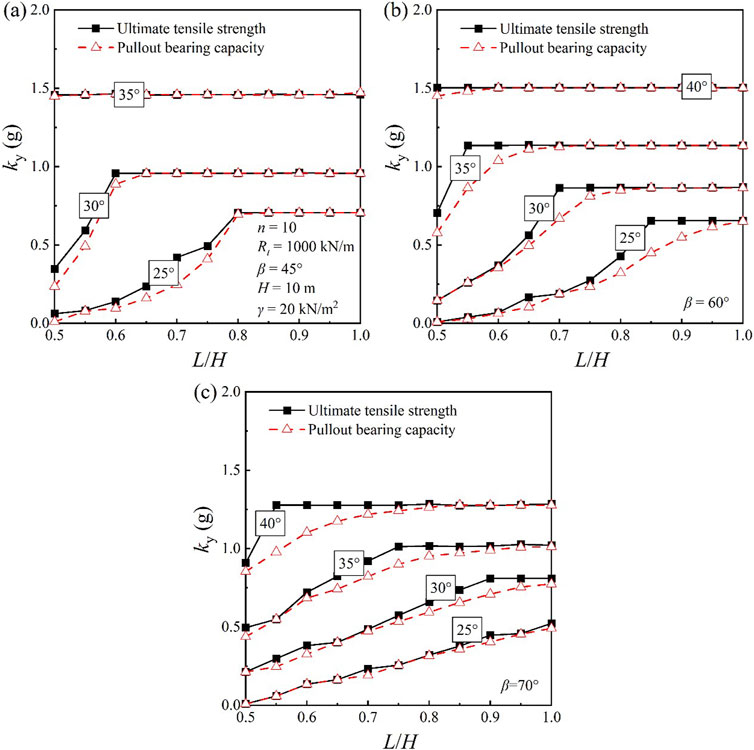
Figure 3. Yield accelerations obtained from different geosynthetic material properties. ((A) β=45°; (B) β=60°; (C) β=70°).
It can be seen in Figure 3 that the seismic yield accelerations of the reinforced slope remain constant and are not affected by the distribution characteristics of the geosynthetics’ pullout strengths when the geosynthetics are sufficiently long. But when the length is reduced, in some cases, using the bearing capacity ultimate pullout strength index for calculation may result in a significantly smaller seismic yield acceleration. Based on the calculation results of the various models, and considering the design length range of geosynthetics as L/H = 0.6 to 0.7, it is known that for the reinforced soil slope model with an internal friction angle φ of 30° and a slope angle of 60°, the decay of the pullout strength at the end of the geosynthetics has the greatest effect on the seismic yield acceleration. Therefore, this model is selected to analyze the effect of different numbers of geosynthetics on the seismic yield acceleration, under the conditions of controlling the total and the single pullout strength. The critical slip surface of the reinforced soil slope under different numbers of geosynthetics when L/H = 0.7 is shown in Figure 4, where the rectangle or trapezoid above the geosynthetics indicates the distribution of pullout strength at the corresponding point, with different indices showing different distributions, and the slip surface passing through the geosynthetics is marked with red dots.
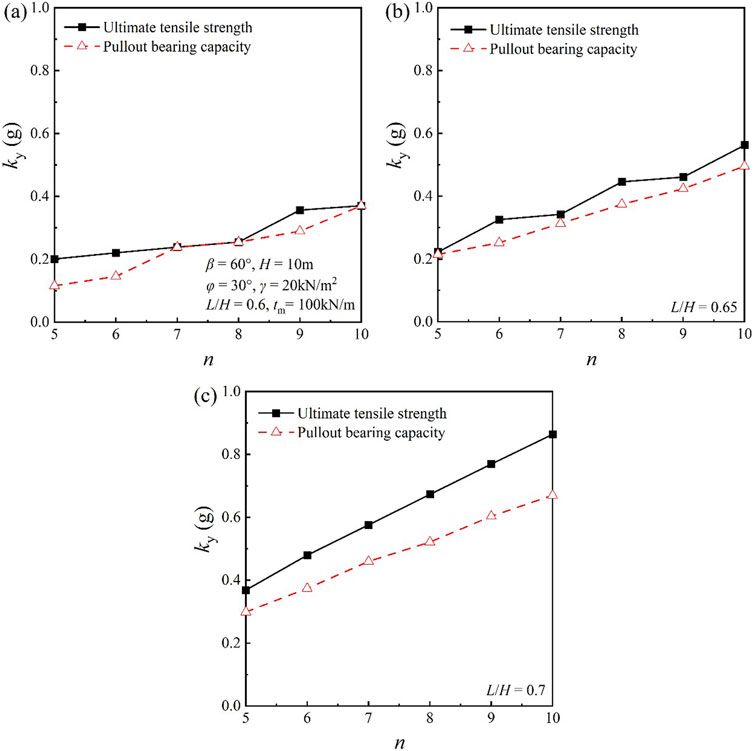
Figure 4. Yield accelerations of different layer designs with the same strength for a single layer. ((A) L/H=0.6; (B) L/H=0.65; (C) L/H=0.7).
3.1 Effect of different indices when the pullout strength of a single geosynthetic is consistent
From Figure 4, one can find that under the condition of controlling the pullout strength of a single geosynthetic to be consistent, reducing the number of layers results in an obvious downward trend in the seismic yield acceleration. This means that reducing the arrangement of geosynthetics may decrease the seismic stability of the slope. Meanwhile, considering the decay of the pullout strength at the end of the geosynthetic, i.e., using the pullout bearing capacity for calculation and analysis, will yield a smaller result for the seismic yield acceleration compared to using only the geosynthetic’s ultimate pullout strength for calculation. That is, using the geosynthetic’s ultimate pullout strength for the seismic stability review of reinforced soil slopes will overestimate the seismic stability of the slopes. In this case, when L/H = 0.7, the difference between using the pullout bearing capacity limit and using the ultimate pullout strength is the most significant.
Figure 5 presents the critical slip surfaces of the reinforced soil slope calculated using the ultimate bearing capacity and the ultimate pullout strength of the geosynthetic, for different numbers of layers when L/H = 0.7. For the same number of layers, due to the decay of the pullout force at the end of the geosynthetic, the critical slip surface calculated using the ultimate bearing capacity is closer to the end of the geosynthetic compared to that calculated using the ultimate pullout strength. For different numbers of layers, the upper parts of the slip surface generally pass through the end of the upper geosynthetic.
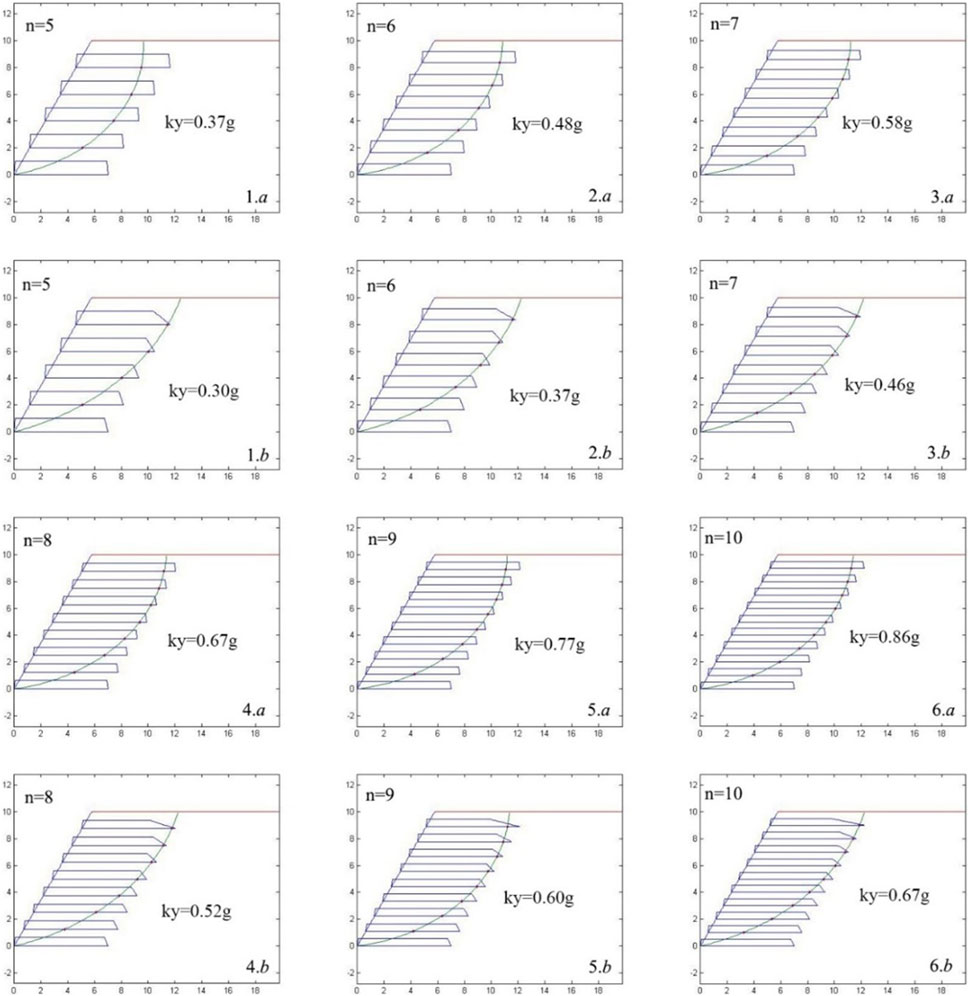
Figure 5. Slip surfaces of different layer designs with the same strength for a single layer (L/H = 0.7).
To quantify the differences in the slip surfaces, this paper defines the total length of geosynthetics within the slip surface and the maximum single length as the effective total length and maximum effective length of geosynthetics, respectively. Figure 6 shows the effective total length and maximum effective length for corresponding lengths of each model in Figure 5. It can be seen from Figure 6 that when the number of layers is constant, the difference in the effective total length verified by the two indicators is small, but the difference in the maximum effective length is obvious. The maximum effective length verified by the ultimate bearing capacity is close to the designed length (7 m). When the number of layers is between 7 and 10, the maximum effective strength verified by the ultimate pullout strength is about 6.5 m, which is about 0.3 m less than that verified by the ultimate bearing capacity. As the number decreases below 7, the significant increase in the difference is most pronounced, where the discrepancy between the two indicators is 1.5 m at 5 layers.
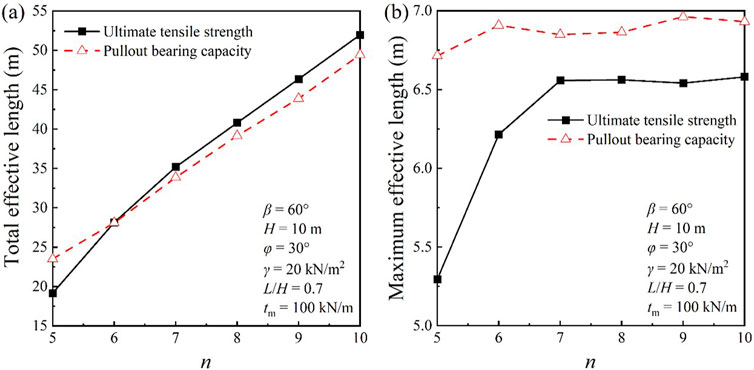
Figure 6. (A) Total effective length; (B) Maximum effective length.
For the case when L/H = 0.6, where the same seismic yield acceleration is obtained using both the ultimate bearing capacity and the ultimate pullout strength, Figure 7 presents the corresponding slip surfaces. It can be observed that when n = 7 or 8, the shapes of the slip surfaces are identical, and they pass through the same position of the geosynthetic without being in the decay region at the end of the geosynthetic. Therefore, if the pullout force is provided by the ultimate pullout strength, the yield acceleration calculated by the proposed method is consistent. This indicates that the differences in results caused by the two indicators need to be considered for specific design lengths, that is, specific engineering cases must be analyzed to determine whether they need to be taken into account.
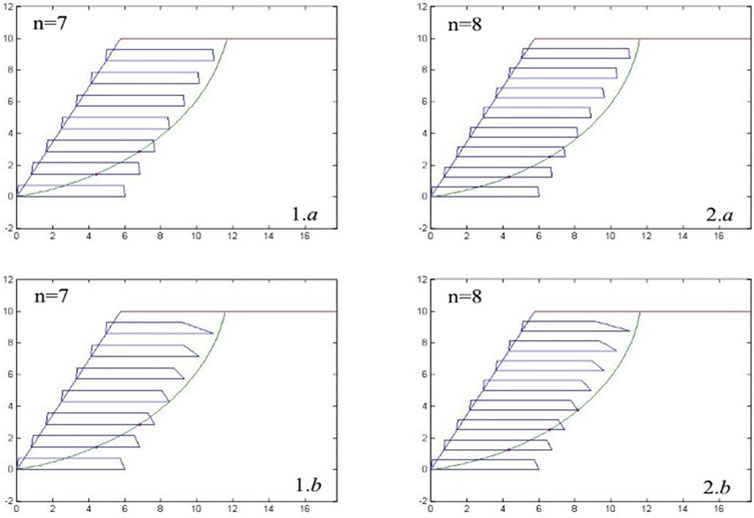
Figure 7. The slip surface for cases with the same yield acceleration.
3.2 Effect of different indices when the total pullout strength is consistent
It can be seen from Figure 8 that a slower decreasing trend of the seismic yield acceleration of the slope occurs under the condition of maintaining consistent total pullout strength of the geosynthetics and reducing the number of layers. Meanwhile, the seismic yield acceleration using the ultimate bearing capacity for calculation is smaller compared to the results obtained by using the ultimate pullout strength. This means that using the ultimate pullout strength to verify the seismic stability of reinforced soil slopes will overestimate the seismic stability of the slopes. In this case, when L/H = 0.7, the difference between the results obtained using the two indicators is the most significant. When the length is 0.6H, and n = 7 or 8, the seismic yield acceleration calculated using the two indicators is consistent. Similar to the case of the ultimate pullout force of a single geosynthetic, the corresponding slip surfaces are identical, the positions where the slip surfaces pass through are the same, and the pullout strengths that the geosynthetic can provide at the corresponding positions are consistent.
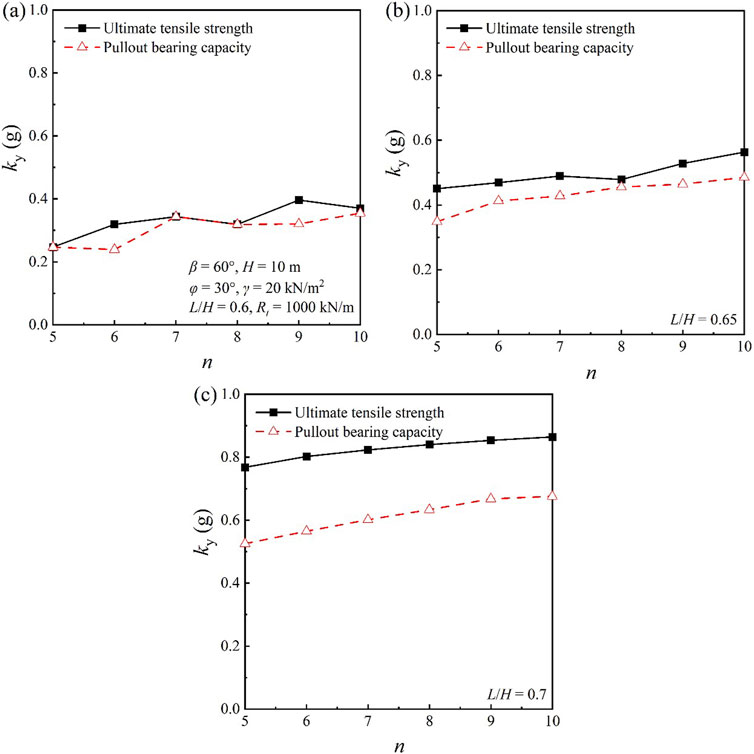
Figure 8. Yield accelerations of different layer designs with the same total strength. ((A) L/H=0.6; (B) L/H=0.65; (C) L/H=0.7).
Figure 9 presents the critical slip surfaces of reinforced soil slopes calculated using the ultimate bearing capacity and the ultimate pullout strength for different numbers of layers when L/H = 0.7. It can be seen that the positions that slip surfaces obtained using the ultimate bearing capacity pass through the upper geosynthetic is further-back. Figure 10 also provides the effective total length and maximum effective length corresponding to each model in Figure 9. It can be seen from Figure 10 that when the number of layers is constant, the effective total length verified by the two indicators is almost the same, and the difference in the maximum effective length is obviously less than the results obtained by controlling the ultimate pullout strength of a single geosynthetic. Moreover, the change in the number of layers has a smaller effect on the maximum effective length. The average result obtained from the ultimate pullout strength is 6.55 m, and that obtained using the ultimate bearing capacity is 6.78 m, with a difference of 0.23 m.
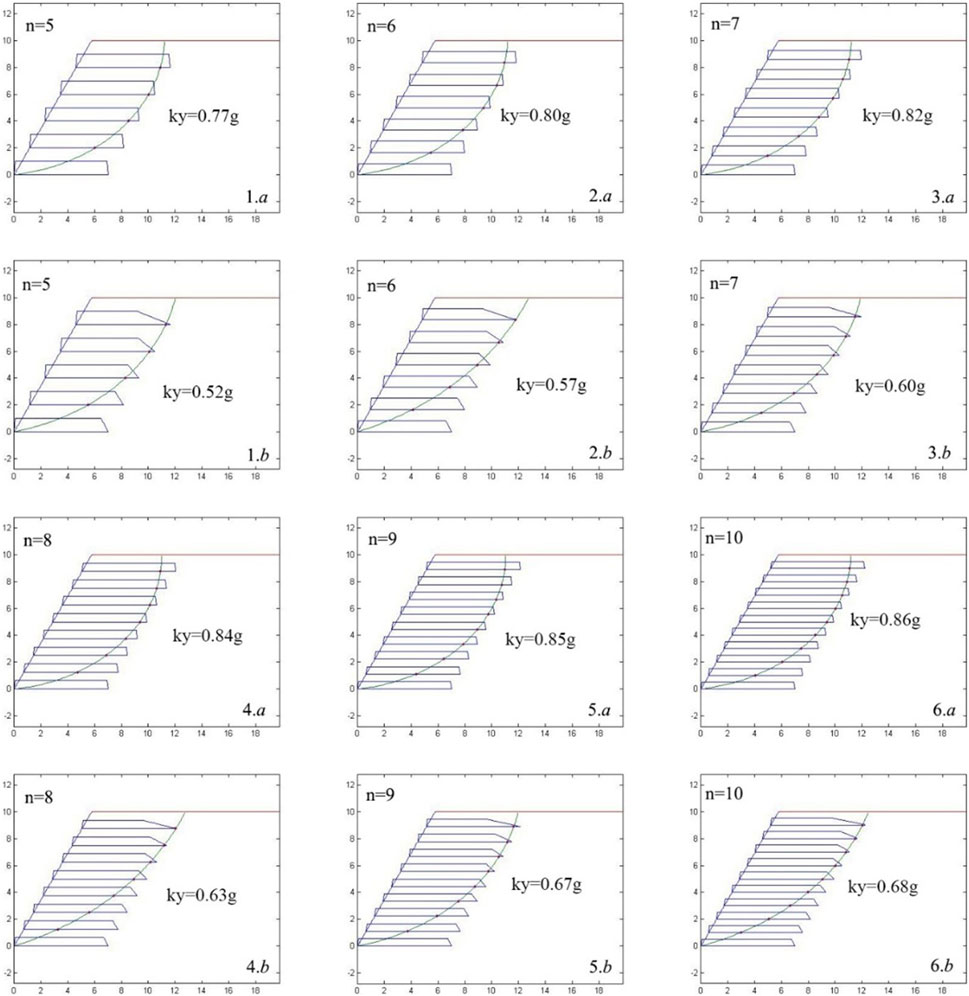
Figure 9. Slip surfaces of different layer designs with the same total strength(L/H = 0.7).
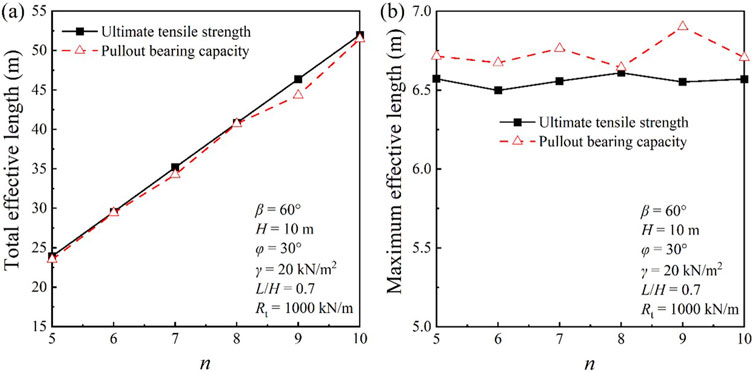
Figure 10. (A) Total effective length; (B) Maximum effective length.
3.3 Effect of different indices when the arrangement is consistent
When the strength of a single geosynthetic is consistent with the total strength, the effect of the two indicators is mainly reflected in the difference in seismic acceleration. And changing the number of layers has little effect on the shape and size of the slip surface. Here a reinforced soil slope model with an internal friction angle φ of 30° and a slope angle of 60° is selected, with a geosynthetic design length of L/H = 0.7 and the layer number n = 10, to reveal the effect of different indicators on the seismic yield acceleration by changing the total pullout force.
In Figure 11, the seismic yield acceleration obtained from the verification using the two indicators increases linearly with the increase in total pullout force within the range of 500–1,000 kN/m. The seismic yield acceleration obtained from the verification using the ultimate pullout strength is greater than that obtained using the ultimate bearing capacity. The maximum effective length obtained from the verification using the ultimate bearing capacity is greater than that corresponding to the ultimate pullout strength, and the effective total length obtained from the verification using the ultimate bearing capacity is less than that corresponding to the ultimate pullout strength indicator.
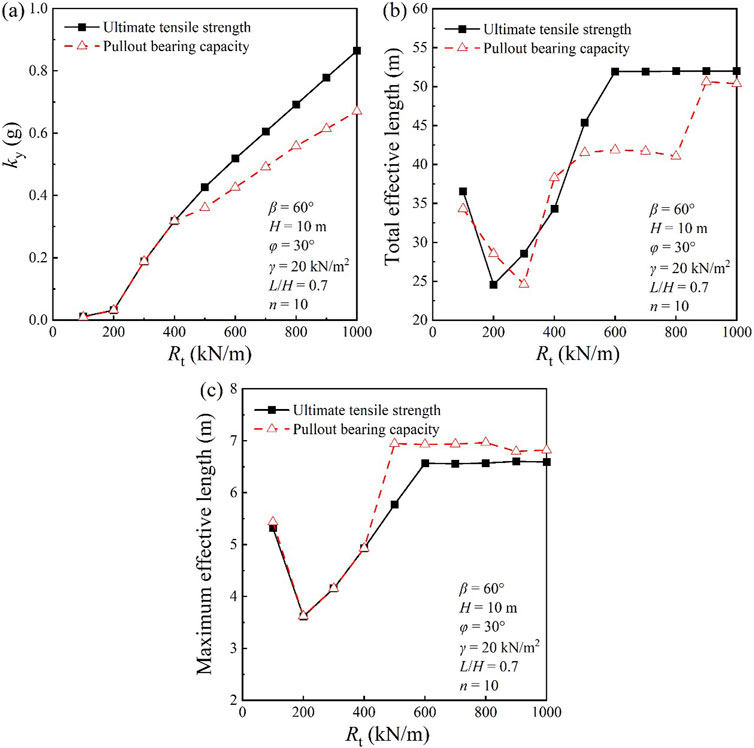
Figure 11. (A) Yield accelerations of different strength; (B) Total effective length; (C) Maximum effective length.
In Figure 12, using the ultimate pullout strength for verification, effects of the total pullout force on the maximum effective length and effective total length are negligible at levels more than 600 kN/m. However, an obvious reduction in these lengths is observed when the total pullout force drops to 500 kN/m. Figure 12 also displays the slip surfaces for total pullout forces of 500 and 600 kN/m. The comparison reveals that the slip surface area decreases substantially and a noticeable reduction emerges in both the effective total length and the maximum effective length at Rt = 500 kN/m.
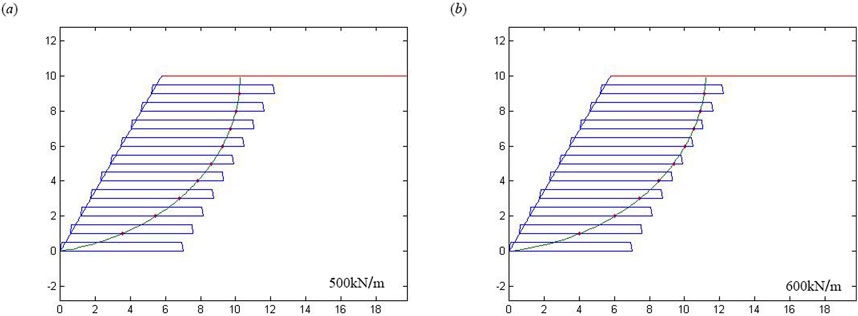
Figure 12. (A) The slip surfaces of slopes with Rt = 500 kN/m; (B) The slip surfaces of slopes with Rt = 600 kN/m.
In Figure 13, using the ultimate bearing capacity for verification, changes in total pullout force have a minor effect on the maximum effective length. As the total pullout force Rt decreases to 800 kN/m, the effective total lengths drop noticeably from 50 m to 42 m, and the maximum effective lengths increase slightly from approximately 6.75 m to about 6.9 m. Figure 13 also shows the slip surfaces for total pullout forces of 800 kN/m and 900 kN/m. It is evident that the slip surface does not intersect the first layer, leading to a marked decrease in the effective total length at Rt = 800 kN/m.
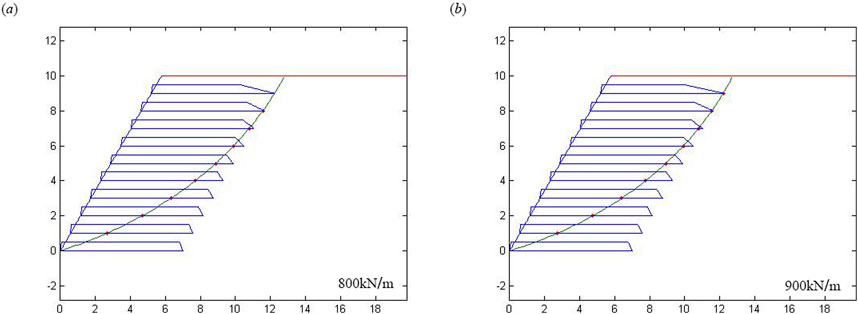
Figure 13. (A) The slip surfaces of slopes with Rt = 800 kN/m; (B) The slip surfaces of slopes with Rt = 900 kN/m.
4 Discussion
4.1 Merits of the proposed method
The method presented in this paper, which integrates the limit equilibrium method with the log spiral failure mechanism, offers several distinct merits that enhance our understanding and assessment of the seismic stability of reinforced soil slopes. Firstly, it provides a more sophisticated and realistic representation of slope failure modes under seismic conditions compared to traditional planar failure models. The log spiral curve acknowledges the rotational component of slope failures, which is often observed in practice but frequently overlooked in simpler models.
Secondly, this approach accounts for the variable pullout strength along geosynthetic reinforcements, which is a critical factor in the seismic performance of reinforced soil structures. This consideration allows for a more nuanced evaluation of the actual field conditions, where uniform distribution of reinforcement strength is rarely achieved.
Thirdly, the method’s applicability is broad, not confined to specific soil types or geosynthetic materials, thus offering a versatile tool for geotechnical engineers across a range of projects. It also leads to more informed design recommendations that can improve the seismic resilience of geosynthetic-reinforced soil structures.
4.2 Limitations of the proposed method
Despite its merits, this method is not without limitations. The complexity inherent in the log spiral failure mechanism requires detailed input data and a deep understanding of the soil-geosynthetic interaction, which may pose challenges for practitioners in various engineering settings.
The method also relies on several assumptions, including the rigid-plastic behavior of soil and the idealized log spiral failure surface, which can introduce approximation errors into the analysis. The precision of slope stability assessments is sensitive to the accuracy of input parameters, such as the internal friction angle of soil and the pullout strength of geosynthetics. Uncertainties in these parameters can lead to variations in the outcomes of slope stability evaluations.
5 Conclusion
This paper presents a thorough analysis of the seismic stability of reinforced soil slopes, utilizing both the limit equilibrium method and the log spiral curve model. The conclusion mainly revolves around the following key points:
5.1 Effects of pullout strength indicators of geosynthetics
The pullout strength indicators of geosynthetics have a significant effect on the seismic stability of reinforced soil slopes. The seismic yield accelerations calculated using the ultimate bearing capacity are noticeably smaller than that obtained using the ultimate pullout strength particularly as the length of the reinforcement is reduced. This suggests that the distribution characteristics of the actual pullout strength of geosynthetics should be fully considered in seismic design.
5.2 Optimization of reinforcement layout and layering
This paper discusses the effect of different layouts and layer numbers on slope stability. The results show that reducing the number of layers decreases the seismic stability of the slope, while a reasonable layout of geosynthetics can enhance the seismic performance of the slope. This provides theoretical support for the optimized layout of geosynthetics in engineering practice.
5.3 Guidance for seismic reinforcement design
The results have significant guiding implications for the seismic reinforcement design of reinforced soil slopes. By considering the nonuniform distribution of pullout strengths, the stability of the slope under seismic action can be more accurately assessed, and more effective reinforcement measures can be formulated.
Although this paper provides valuable insights, there are still some limitations. For example, the simplification of model assumptions and the uncertainty of parameters may affect the accuracy of the results. Future research can improve the precision and applicability of the evaluation method by considering more influencing factors and more complex models.
Data availability statement
The original contributions presented in the study are included in the article/supplementary material, further inquiries can be directed to the corresponding author.
Author contributions
XC: Formal Analysis, Funding acquisition, Investigation, Software, Supervision, Writing–original draft. ZZ: Conceptualization, Data curation, Formal Analysis, Methodology, Software, Validation, Writing–review and editing. YZ: Data curation, Formal Analysis, Validation, Writing–original draft. SP: Methodology, Software, Writing–review and editing. DZ: Methodology, Resources, Writing–review and editing. EL: Methodology, Supervision, Validation, Writing–review and editing.
Funding
The author(s) declare that financial support was received for the research, authorship, and/or publication of this article. This research was funded by the National Natural Science Foundation of China, grant number 52208361, 52278420; and the Natural Science Foundation of Jiangsu Province, grant number BK20220638.
Conflict of interest
The authors declare that the research was conducted in the absence of any commercial or financial relationships that could be construed as a potential conflict of interest.
The handling editor HT declared a shared affiliation with the author YZ at the time of review.
Generative AI statement
The author(s) declare that no Generative AI was used in the creation of this manuscript.
Publisher’s note
All claims expressed in this article are solely those of the authors and do not necessarily represent those of their affiliated organizations, or those of the publisher, the editors and the reviewers. Any product that may be evaluated in this article, or claim that may be made by its manufacturer, is not guaranteed or endorsed by the publisher.
References
1. Zhang F, Zhu Y, Chen Y, Yang S. Seismic effects on reinforcement load and lateral deformation of geosynthetic-reinforced soil walls. Front Struct Civil Eng (2021) 15(4):1001–15. doi:10.1007/s11709-021-0734-8
2. Fan C, Liu X, Zhang Y, An X, Liu H. Centrifuge shaking table tests on tiered reinforced soil retaining walls subjected to the excitations of near-field ground motions. Geotextiles and Geomembranes (2024) 52(4):343–54. doi:10.1016/j.geotexmem.2023.12.001
3. Ren F, Huang Q, Zhang F, Wang G. Numerical study on seismic performance of tiered reinforced soil retaining walls. Soil Dyn Earthquake Eng (2024) 181:108672. doi:10.1016/j.soildyn.2024.108672
4. Shu S, Ge B, Wu Y, Zhang F. Probabilistic assessment on 3D stability and failure mechanism of undrained slopes based on the kinematic approach of limit analysis. Int J Geomechanics (2023) 23(1):06022037. doi:10.1061/(asce)gm.1943-5622.0002635
5. Shu S, Ge B, Wu Y, Zhang F. Reliability analysis of excavated slopes in undrained clay. Front Struct Civil Eng (2023) 17(11):1760–75. doi:10.1007/s11709-023-0018-6
6. Bathurst RJ, Hatami K, Alfaro MC. Geosynthetic-reinforced soil walls and slopes—seismic aspects. In: Geosynthetics and their applications. Thomas Telford Publishing (2002). p. 327–92.
7. Yünkül K, Gürbüz A. Determination of shear stress-shear strain behavior of polymeric geostrip reinforced MSE wall. Geotextiles and Geomembranes (2024) 52(2):184–95. doi:10.1016/j.geotexmem.2023.10.002
8. Perez A, Holtz RD. Seismic response of reinforced steep soil slopes: results of a shaking table study. In: Geotechnical engineering for transportation projects (2004). p. 1664–72.
9. Nova-Roessig L, Sitar N. Centrifuge model studies of the seismic response of reinforced soil slopes. J Geotechnical Geoenvironmental Eng (2006) 132(3):388–400. doi:10.1061/(asce)1090-0241(2006)132:3(388)
10. Lin YL, Leng WM, Yang GL, Li L, Yang JS. Seismic response of embankment slopes with different reinforcing measures in shaking table tests. Nat Hazards (2015) 76:791–810. doi:10.1007/s11069-014-1517-5
11. Hazari S, Ghosh S, Sharma RP. Experimental and numerical study of soil slopes at varying water content under dynamic loading condition. Int J Civil Eng (2020) 18:215–29. doi:10.1007/s40999-019-00439-w
12. Jana K, Hazari S, Ghosh S. Experimental and numerical studies of three-layered unreinforced and geosynthetic-reinforced soil slopes. Innovative Infrastructure Solutions (2021) 6:41–29. doi:10.1007/s41062-020-00408-6
13. Huang L, He W, Hou Y, Liu D, Wang B, Zhu J, et al. Seismic behavior of flexible geogrid wrap-reinforced soil slope. Adv Civil Eng (2021) 2021(1):8833662. doi:10.1155/2021/8833662
14. Zeng WX, Liu FY, Ying MJ. Cyclic response of stereoscopic geogrid–sand interface under static and cyclic loading. Geosynthetics Int (2023) 1–14. doi:10.1680/jgein.23.00009
15. Yazdandoust M. Assessment of horizontal seismic coefficient for three different types of reinforced soil structure using physical and analytical modeling. Int J Geomechanics (2019) 19(7):04019070. doi:10.1061/(asce)gm.1943-5622.0001344
16. Patra S, Shahu JT. Pseudo-static analysis of reinforced soil wall based on pasternak model. Indian Geotechnical J (2020) 50(2):252–60. doi:10.1007/s40098-019-00400-7
17. Sarbishei S, Fakher A. Energy-based horizontal slice method for pseudo-static analysis of reinforced walls. Geosynthetics Int (2012) 19(5):370–84. doi:10.1680/gein.12.00023
18. Steedman RS, Zeng X. The influence of phase on the calculation of pseudo-static earth pressure on a retaining wall. Geotechnique (1990) 40(1):103–12. doi:10.1680/geot.1990.40.1.103
19. Basha BM, Babu GS. Reliability assessment of internal stability of reinforced soil structures: a pseudo-dynamic approach. Soil Dyn Earthquake Eng (2010) 30(5):336–53. doi:10.1016/j.soildyn.2009.12.007
20. Yan M, Xia Y, Liu T, Bowa VM. Limit analysis under seismic conditions of a slope reinforced with prestressed anchor cables. Comput Geotechnics (2019) 108:226–33. doi:10.1016/j.compgeo.2018.12.027
21. Ruan XB, Sun SL. Seismic stability of reinforced soil walls under bearing capacity failure by pseudo-dynamic method. J Cent South Univ (2013) 20:2593–8. doi:10.1007/s11771-013-1773-7
22. Kitamoto Y, Abe H, Shimomura H, Morishima H, Taniguchi Y. Rapid and strengthened repair construction for a seriously damaged railway embankment during violent earthquakes. In: Proc. Of 8th international conference on geosynthetics (2006). p. 861–4.
23. Kuwano J, Miyata Y, Koseki J. Performance of reinforced soil walls during the 2011 Tohoku earthquake. Geosynthetics Int (2014) 21(3):179–96. doi:10.1680/gein.14.00008
24. FHWA. Design and construction of mechanically stabilized earth walls and reinforced soil slopes-Volume I, Federal Highway Administration Publication No. FHWA-NHI-10-243. Washington, DC, USA: US Department of Transportation (2009).
Keywords: soil slopes, seismic stability, limit equilibrium method, pullout strength of geosynthetics, log spiral curve model
Citation: Chen X, Zhou Z, Zhu Y, Pu S, Zhang D and Li E (2025) Evaluating seismic stability of reinforced soil slopes using the limit equilibrium method: influence of geosynthetic strength indicators. Front. Phys. 12:1526223. doi: 10.3389/fphy.2024.1526223
Received: 11 November 2024; Accepted: 27 December 2024;
Published: 29 January 2025.
Edited by:
Huiming Tan, Hohai University, ChinaCopyright © 2025 Chen, Zhou, Zhu, Pu, Zhang and Li. This is an open-access article distributed under the terms of the Creative Commons Attribution License (CC BY). The use, distribution or reproduction in other forums is permitted, provided the original author(s) and the copyright owner(s) are credited and that the original publication in this journal is cited, in accordance with accepted academic practice. No use, distribution or reproduction is permitted which does not comply with these terms.
*Correspondence: Zheng Zhou, emhvdWdlb2hodUBmb3htYWlsLmNvbQ==