- Henan Kaifeng Power Supply Company, Kaifeng, Henan, China
This paper presents a low-carbon optimal scheduling model for distribution networks with wind and photovoltaic (PV), accounting for supply and demand uncertainties. The model optimizes thermal generation costs, wind and PV maintenance costs, and carbon emissions using a chance-constrained approach with fuzzy variables. The clear equivalent class method simplifies these constraints for easier problem-solving. Validation on the IEEE-30 node system shows the model reduces costs by 32.9% and carbon emissions by 19.2% compared to traditional scheduling, effectively lowering both costs and the carbon footprint. This real-world optimization approach tackles uncertainty in renewable energy supply and improves system efficiency and sustainability.
1 Introduction
With the introduction of the ‘dual carbon’ targets and the growing energy demand, low-carbon scheduling has become a key focus in power systems research [1]. The increasing integration of renewable energy, especially wind and solar, presents both opportunities and challenges for low-carbon dispatch in distribution networks [2]. Exploring strategies that incorporate wind and solar power can improve renewable energy utilization [3], reduce carbon emissions, and enhance the safety, efficiency, and sustainability of power systems, supporting the achievement of the “dual carbon” goals [4].
Current research on low-carbon optimization scheduling for distribution networks includes efforts both domestically and internationally [5]. Early work introduced the carbon flow theory, which links power generation emissions to load-side consumption, highlighting the impact of load patterns on low-carbon scheduling [6]. Studies have developed methods for calculating carbon flow and node carbon potential, incorporating these constraints to reduce emissions from renewable energy stations [7, 8]. Other research has quantified the carbon intensity of high-penetration wind systems and proposed models for low-carbon grid transformation using carbon flow theory [9, 10]. Further developments have integrated low-carbon demand response and carbon flow to enhance carbon mitigation potential [11], and some models consider carbon tax costs on both supply and demand sides to increase renewable energy penetration [12, 13]. In addition, big data analytics has been applied to analyze energy consumption and carbon emissions, aiding in the optimization of low-carbon scheduling [14].
As the share of wind and solar power increases, the uncertainties in both supply and demand present new challenges for low-carbon optimization in distribution networks. To address these issues, this article focuses on integrated optimization of renewable energy output, demand response, and the carbon trading mechanism. It proposes a low-carbon scheduling model for distribution networks that considers uncertainties on both the supply and demand sides. The model optimizes thermal generation costs, wind and solar operation and maintenance costs, and carbon emission costs, using fuzzy chance constraint methods to handle uncertainties in wind power, PV output, and load demand. The effectiveness of the approach is validated through simulations based on the IEEE-30 node system.
2 Implementation technology for low-carbon optimal dispatching strategy in distribution networks accounting
2.1 Determination of objective function
We take into consideration the power generation costs associated with thermal power units, the operational and maintenance expenses of wind and solar power generation, as well as the carbon emission costs. Consequently, the objective function is defined as follows:
where
The calculation formula for the generation cost
where
The calculation formula for the operation and maintenance cost
To effectively manage and control the carbon emissions of the system, the carbon emission cost is stratified into three distinct levels based on the volume of emissions. The formula for calculating the carbon emission cost
where
2.2 Determination of constraints
When integrating a wind-solar complementary power system into the grid, the system’s power balance is governed by an equation, and the rotating reserve balance is constrained by an inequality, as follows:
where
Due to the presence of uncertain variables, the system’s power balance equation and the rotating reserve inequality cannot be expressed deterministically. Therefore, it is necessary to account for system uncertainties in the day-ahead scheduling. In this article, we address these uncertainties by introducing wind power uncertainty parameter
where
The low-carbon optimization scheduling model for distribution networks encompasses various complex constraints, including power balance, limitations on wind and solar power generation outputs, operational characteristics of thermal power units, energy storage system capacity, and rotational reserve requirements. The detailed expression of these constraints is as follows:
1) Power balance constraint
2) Constraints on the output of wind and solar power generation
where
3) Constraints pertaining to traditional thermal power units
(i) The output constraints of the unit are as follows:
(ii) The climbing constraints for the crew are as follows:
(iii) The constraint regarding the minimum start-stop time for the unit is as follows:
In the formula,
where
where
4) Energy storage constraint
The calculation formula for the capacity
where
The energy storage constraints are as follows:
where
Furthermore, its charging and discharging power must also adhere to the following constraints:
where
5) Rotation backup constraint
2.3 Model solving
Managing chance constraints is a crucial aspect of solving fuzzy chance-constrained programming. We utilizes fuzzy chance-constrained programming and equivalent class processing techniques to address these constraints. Fuzzy chance-constrained programming is commonly used to tackle uncertain optimization problems. It sets a confidence level that determines how constraints are satisfied. This method not only handles randomness but also manages uncertainties from fuzziness, considering both the feasibility and optimality of solutions, particularly in complex systems with multiple interacting fuzzy parameters. The clear equivalence class method transforms fuzzy constraints into deterministic conditions, simplifying the solution process. This approach converts the original problem into an equivalent one with high confidence by analyzing the membership functions of fuzzy variables. It reduces the impact of fuzziness on model accuracy, enhances computational efficiency, and ensures solution stability. Since security is essential for system operation, establishing a reasonable reliability level is imperative. When the reliability level
In the formula,
The expression for the trapezoidal uncertainty parameter
where
Based on the aforementioned analysis, the system model is formulated as follows:
where
The explicit equivalent class representation of power balance is as follows:
The clear equivalence class representation for rotation backup is as follows:
3 Results
3.1 Parameter settings
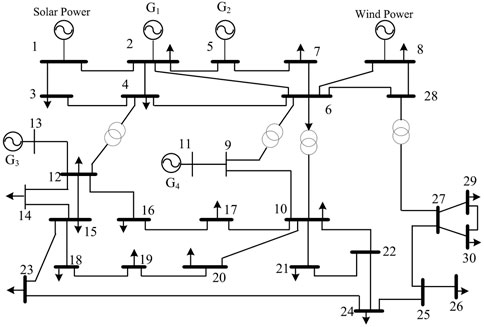
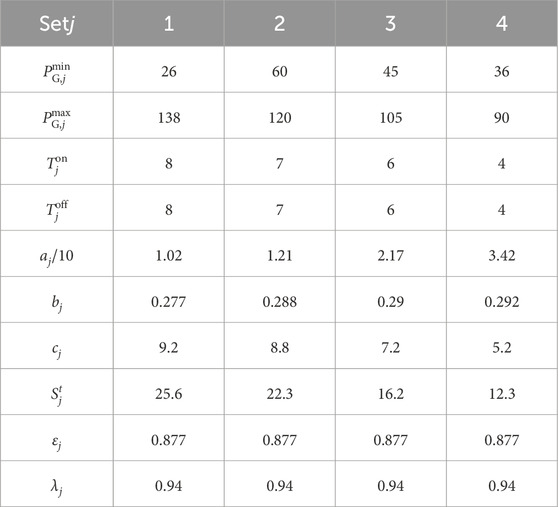
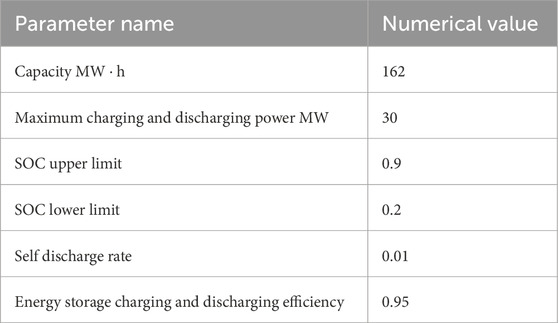
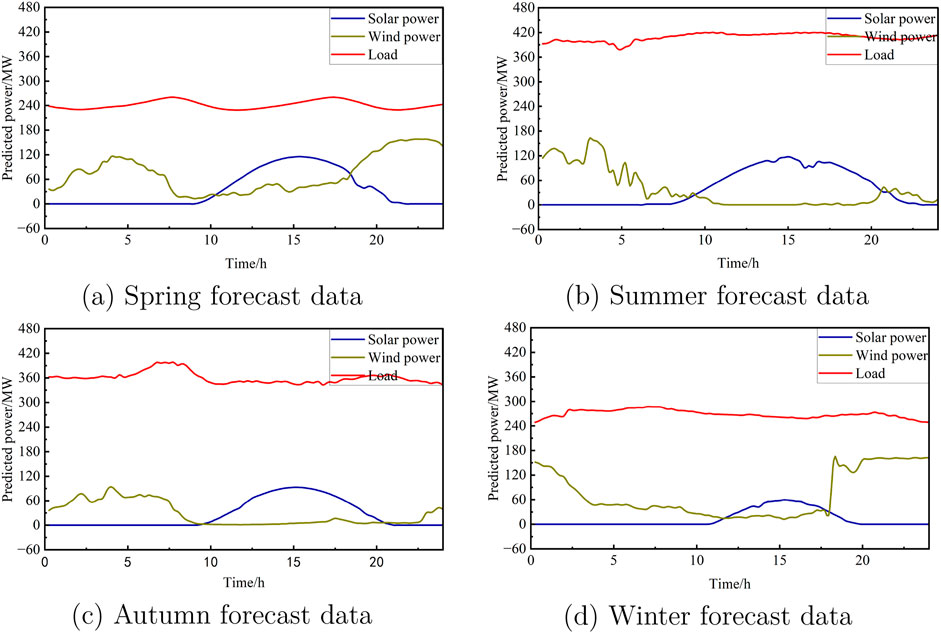
To assess the feasibility and efficacy of the proposed model, a case study was carried out utilizing the IEEE-30 node system, whose diagram is depicted in Figure 1. Initially, the IEEE-30 node system comprised six thermal power generators; however, two of these have been substituted with wind and photovoltaic power generation facilities. Consequently, the system now encompasses four thermal power generators and a hybrid wind-solar power generation system. The node system illustrated in Figure 1 features four thermal power generation units that simulate grid power. The detailed parameters for these units are presented in Table 1. Optimized scheduling calculations are performed in conjunction with wind and photovoltaic power. Furthermore, the system is equipped with wind turbines with a cumulative capacity of 75 MW and photovoltaic turbines with a total capacity of 150.3 MW. The energy storage system boasts a total capacity of 162 MW
3.2 Analysis of case results
In order to quantitatively assess the capacity of a specific region’s power system to integrate wind and solar power generation during time period
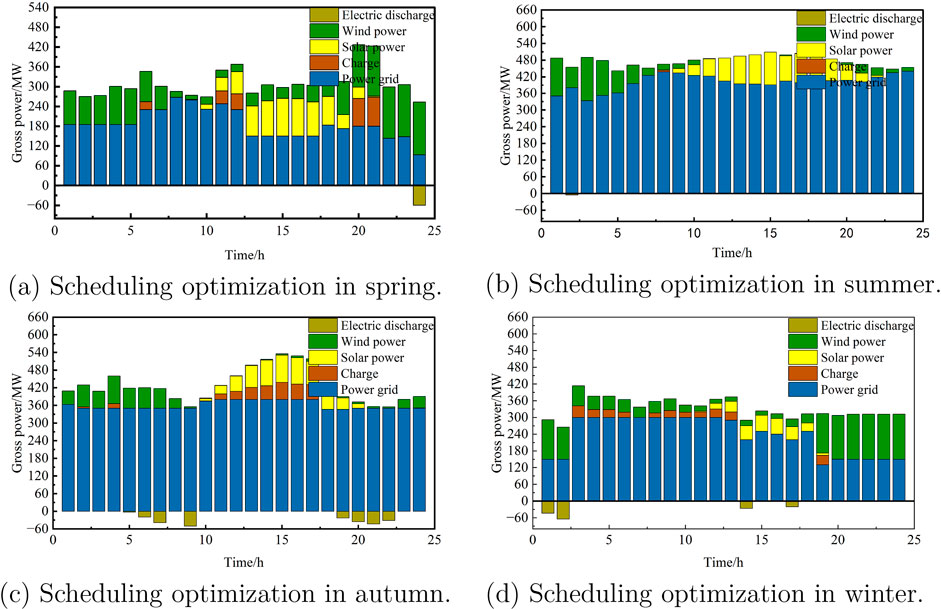
The system scheduling optimization results for different seasons are shown in Figure 3. In spring (Figure 2A), wind power remains stable throughout the day, compensating for the lack of photovoltaic (PV) generation at night. At night, the system primarily relies on wind and thermal power, with energy storage absorbing excess wind power. During the day, wind, PV, and thermal power are used together, reducing thermal output to maximize renewable energy penetration (59.38%). Energy storage absorbs surplus electricity when generation exceeds demand, while thermal power compensates for forecast inaccuracies. In summer (Figure 3B), the system fully absorbs wind and solar power. Due to increased load, thermal power output rises to meet demand, achieving a 32.01% penetration rate. When wind and solar, along with storage, cannot meet the load, all four thermal units may be activated. Excess power is stored and released as needed. In autumn (Figure 3C), wind power is sometimes unavailable, and the load is met by PV and thermal power, with a maximum renewable penetration of 30.16%. Even without wind, PV and thermal can meet grid demand, with energy storage helping to reduce emissions and costs. In winter (Figure 3D), shorter sunshine hours reduce PV output, and wind power compensates, achieving a peak penetration rate of 51.14%. In summary, wind power is higher in spring and winter, while summer has more PV generation due to longer daylight hours. Load demand varies seasonally, with summer requiring more thermal power to meet air conditioning loads during peak hours.
Seasonal differences in wind and photovoltaic (PV) power output affect the operating hours and frequency of traditional thermal power units. This impacts carbon emissions and, consequently, carbon trading costs. For instance, during seasons with high wind output, thermal units operate less, reducing carbon costs. In contrast, when wind output is low, thermal units run more, leading to higher emissions and carbon trading costs. Seasonal carbon cost variation is critical to the economic viability of system optimization. Additionally, during seasons with abundant wind and solar power, limited system flexibility or energy storage capacity may lead to curtailment, affecting system economics. The simulation confirms the model’s feasibility. Building on this, uncertainty chance constraints and carbon trading mechanisms are integrated into three scheduling models for comparison.
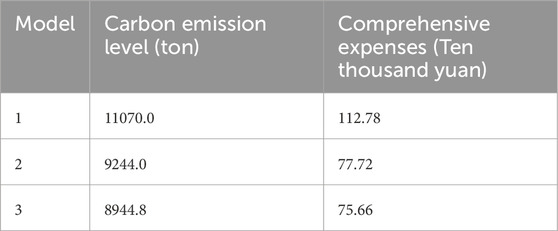
Model 1: A deterministic power balance model is used to handle wind, solar, and load uncertainties, with reserve capacities of 20% for wind and solar and 10% for load forecasting. A stepped carbon trading fee is included. Model 2: An uncertainty chance constraint model focuses on minimizing operating costs without considering carbon trading costs. Model 3: Similar to Model 2 but includes a stepped carbon trading fee and sets the reliability level at 0.9.
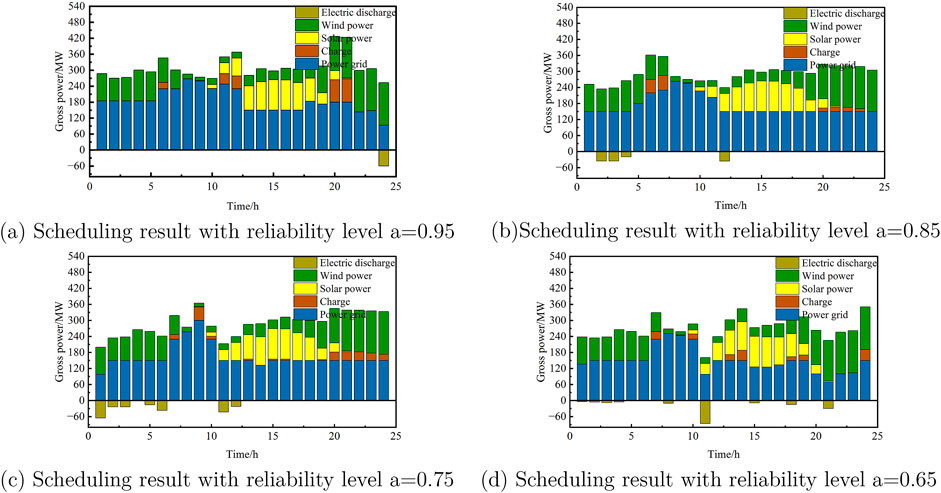
Table 4 shows Model 3 as the most effective, reducing total costs by 32.9% and carbon emissions by 19.2% compared to Model 1, and further lowering costs and emissions by 2.65% and 3.2% compared to Model 2. The wind-solar complementary scheduling model with uncertainty constraints minimizes system costs and emissions, aligning with China’s environmental policies. Figure 4 illustrates the system’s scheduling results under different reliability levels, using spring data.
As illustrated in Figure 4, the system’s backup capacity is intimately linked to its reliability level. A decrease in the reliability level reveals frequent charging and discharging of the energy storage device, accompanied by a reduction in the system’s rotational backup. The backup capacity of the system serves as an extra capacity to ensure its safety, safeguarding against any adverse effects caused by decreases in wind and solar power generation output or load growth. Configuring the backup capacity necessitates a thorough consideration of the system’s reliability requirements and operating costs, making it imperative to establish a reasonable reliability level. Enhancing the system’s backup capacity can elevate its reliability level and bolster its security. However, from an economic standpoint, augmenting the system’s backup capacity leads to an increase in the system’s construction cost. Therefore, to strike a balance between the system’s security and economy during scheduling, it is essential to choose the appropriate reliability level based on the actual needs of the system.
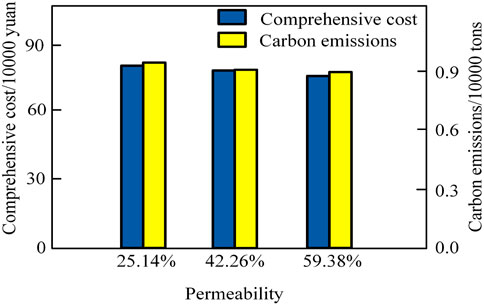
Using spring data as a case study, we investigated the influence of varying penetration rates of wind and solar power generation on scheduling optimization. The findings of this analysis are presented in Figure 5. As the penetration rate of wind and solar power generation diminishes, the reliance on thermal power units escalates. Furthermore, a decrease in the penetration rate results in an increase in overall costs. Specifically, when the penetration rate drops from 42.26% to 25.14%, the overall cost rises by 5%, while carbon emissions decrease by 5.5%. These findings suggest that the penetration rate of wind and solar power generation significantly influences the overall cost and carbon emissions associated with power generation. Hence, during the scheduling optimization process, it is imperative to prioritize the utilization of renewable energy to minimize carbon emissions and align with environmental standards. The simulation indicate that in comparison to Model 1 referenced in the article, the model proposed in this study has achieved a 32.9% reduction in comprehensive cost and a 19.2% decrease in carbon emission levels. Additionally, when compared to Model 2, Model 3 has further reduced the overall cost by 2.65% and carbon emissions by 3.2%. In conclusion, the grid-connected scheduling method for wind-solar complementary power generation systems, as proposed in this chapter, demonstrates the ability to effectively decrease both the overall cost and carbon emission levels of the system.
4 Conclusion
This paper addresses the challenge of low-carbon scheduling in grid-connected wind and solar power systems, where supply and demand uncertainty is a key factor. It employs the fuzzy chance constraint method to handle this uncertainty and proposes an optimization scheduling model, leading to the following conclusions: (1) By using the fuzzy chance constraint method to represent supply and demand uncertainty, the proposed model reduces both carbon emissions and overall costs compared to traditional deterministic scheduling models. (2) The integration of a tiered carbon trading mechanism, while accounting for supply and demand uncertainty, further decreases carbon emissions and overall costs. (3) Although this study does not examine the renewable energy consumption rate, it acknowledges the potential negative impact of a low consumption rate on the power system’s overall economy. Future research could investigate the relationship between renewable energy consumption and its economic impact to achieve more comprehensive optimization.
Data availability statement
The original contributions presented in the study are included in the article/supplementary material, further inquiries can be directed to the corresponding author.
Author contributions
YN: Conceptualization, Methodology, Writing–review and editing. ZL: Conceptualization, Methodology, Writing–review and editing. XG: Formal Analysis, Writing–original draft. XK: Conceptualization, Methodology, Writing–review and editing.
Funding
The author(s) declare that financial support was received for the research, authorship, and/or publication of this article. This work was supported by grants from State Grid Henan Electric Power Company Science and Technology Project (521790240007). The funder was not involved in the study design, collection, analysis, interpretation of data, the writing of this article, or the decision to submit it for publication.
Conflict of interest
Authors YN, ZL, XG, and XK were employed by Henan Kaifeng Power Supply Company.
Generative AI statement
The author(s) declare that no Generative AI was used in the creation of this manuscript.
Publisher’s note
All claims expressed in this article are solely those of the authors and do not necessarily represent those of their affiliated organizations, or those of the publisher, the editors and the reviewers. Any product that may be evaluated in this article, or claim that may be made by its manufacturer, is not guaranteed or endorsed by the publisher.
References
1. Qiuye S, Xiaohan Y, Jingao W. Discussion on challenges and countermeasures of “double-high” power distribution system. Proc CSEE (2024) 1-21(44):7115–36. doi:10.13334/j.0258-8013.pcsee.240077
2. Jordehi AR. How to deal with uncertainties in electric power systems? a review. Renew Sustain Energ Rev (2018) 96:145–55. doi:10.1016/j.rser.2018.07.056
3. Cui Mingyong HLEA, He J. Robust low-carbon economic scheduling of power system based on wind power consumption evaluation. J Solar Energ (2020) 41:270–80. doi:10.19912/j.0254-0096.2020.08.037
4. Morales-España G, Martínez-Gordón R, Sijm J. Classifying and modelling demand response in power systems. Energy (2022) 242:122544. doi:10.1016/j.energy.2021.122544
5. Li Q, Jiang Y, Du C, Zhou H, Chen T. Low-carbon optimization of distribution networks under the consideration of new energy integration. J Phys Conf Ser (2023) 2659:012017. doi:10.1088/1742-6596/2659/1/012017
6. Tianrui Z, Chongqing K, Qianyao X. Study on carbon emission flow analysis theory of electric power system. Automation Electric Power Syst (2012) 36:38–43.
7. Zhou Tianrui XQEA, Kang C. Characteristics and mechanism analysis of carbon emission flow distribution in electric power networks, 36 (2012). p. 39–44.
8. Kang C, Zhou T, Chen Q, Wang J, Sun Y, Xia Q, et al. Carbon emission flow from generation to demand: a network-based model. IEEE Trans smart grid (2015) 6:2386–94. doi:10.1109/tsg.2015.2388695
9. Cao Yitao JHEA, Wang D. Two-layer game expansion planning for regional integrated energy systems considering multi-energy carbon flow constraints. Automation Electric Power Syst (2023) 47:12–22. doi:10.7500/AEPS20220704007
10. Shen W, Qiu J, Meng K, Chen X, Dong ZY. Low-carbon electricity network transition considering retirement of aging coal generators. IEEE Trans Power Syst (2020) 35:4193–205. doi:10.1109/tpwrs.2020.2995753
11. Yaowang L, Ning Z, Ershun D, Yuliang L, Xiao C. Research and benefit analysis of low-carbon demand response mechanism in power system based on carbon emission flow. Chin J Electr Eng (2022) 42:2830–42. doi:10.13334/J.0258-8013.pcSE.220308
12. Cui Yang ZPEA, Deng G. Source-charge multi-time scale scheduling method for power systems with wind power considering low-carbon characteristics of carbon capture power plants. Proc CSEE (2022) 42:5869–86+6163. doi:10.13334/j.0258-8013.pcsee.210697
13. Cui Yang ZYEA, Deng G. Economic scheduling of power systems with wind power considering complementary source-charge low-carbon characteristics. Proc CSEE (2021) 41:4799–815. doi:10.13334/j.0258-8013.pcsee.202533
14. Leijun X, Houyou X, Lihua N. Grain powder classification based on random forest algorithm and hardware acceleration. Comput Appl Res (2022) 39:1143–7. doi:10.19734/j.issn.1001-3695.2021.09.0418
15. Hanyi O, Limei Z, Muke B. Combined prediction method for wind-photovoltaic-load in edge service center based on arima-gru. Mod Electric Power (2024) 41:65–71. doi:10.19725/j.cnki.1007-2322.2022.0180
Keywords: low-carbon scheduling model, uncertainty, chance-constrained approach, distribution networks, real-world optimization
Citation: Nan Y, Li Z, Gao X and Kou X (2024) Low-carbon optimal scheduling for distribution networks under supply and demand uncertainty. Front. Phys. 12:1514628. doi: 10.3389/fphy.2024.1514628
Received: 21 October 2024; Accepted: 05 November 2024;
Published: 03 December 2024.
Edited by:
Jianrong Wang, Shanxi University, ChinaCopyright © 2024 Nan, Li, Gao and Kou. This is an open-access article distributed under the terms of the Creative Commons Attribution License (CC BY). The use, distribution or reproduction in other forums is permitted, provided the original author(s) and the copyright owner(s) are credited and that the original publication in this journal is cited, in accordance with accepted academic practice. No use, distribution or reproduction is permitted which does not comply with these terms.
*Correspondence: Yu Nan, bmFueXUxMjAyNEAxNjMuY29t
 Yu Nan
 Zhi Li