- 1Department of Chemistry, Universidad Técnica Particular de Loja, Loja, Ecuador
- 2Facultad de Mecánica, Escuela Superior Politécnica de Chimborazo (ESPOCH), Riobamba, Ecuador
- 3Facultad de Informática y Electrónica, Escuela Superior Politécnica de Chimborazo (ESPOCH), Riobamba, Ecuador
- 4Nanoresearch Laboratory, Excellent Center, Baku State University, Baku, Azerbaijan
- 5INFN-Laboratori Nazionali di Frascati, Frascati, Italy
The COVID-19 pandemic has created a demanding need for fast, sensitive, and reliable diagnostic methods to identify viral infections like SARS-CoV-2. In response, surface plasmon resonance (SPR) biosensors have emerged as effective tools for detecting biomolecules. This theoretical study focuses on designing and refining multilayer SPR biosensor configuration to ensure high sensitivity and stability. The optimized configuration consists of a thin silver layer, a silicon nitride layer, a single graphene layer, and a ssDNA bioreceptor layer, each tailored to improve the effectiveness of the proposed biosensor. The capability of the biosensor to detect SARS-CoV-2 is assessed by analyzing its SPR response, specifically examining variations in resonance angle, attenuation, full width at half maximum, and sensitivity across a range of viral concentrations. Additionally, this study evaluated performance metrics such as refractive index sensitivity, detection accuracy, and quality factor to determine the effectiveness of the biosensor against SARS-CoV-2. Then, this work establishes a basis for further development of SPR biosensors aimed at various viral and biomolecular targets, supporting advances in biosensing technology and the creation of effective diagnostic tools to address current and future health challenges.
1 Introduction
The widespread impact of the COVID-19 pandemic, caused by severe acute respiratory syndrome coronavirus 2 (SARS-CoV-2) [1], has generated an urgent need for diagnostic tools that are rapid, sensitive, and reliable [2]. Early detection is essential to control virus transmission and improve patient outcomes. Conventional diagnostic techniques, including reverse transcription polymerase chain reaction (RT-PCR) [3] and enzyme-linked immunosorbent assays (ELISA) [4], are widely used due to their high accuracy. However, they face several limitations, such as lengthy processing times, high costs, and the requirement for advanced laboratory infrastructure, which restricts their accessibility and scalability, particularly in resource-limited settings. These limitations stem from the technical demands of the assays, which include complex sample preparation, the need for precise thermal cycling in RT-PCR, and the use of specialized reagents and equipment [5]. To address these challenges, considerable research has been dedicated to developing alternative virus detection methods. For instance, optical trapping techniques, such as those described in recent work using dielectric bowtie nanostructures, offer innovative approaches to nanoparticle trapping and virus detection by enabling efficient confinement of optical forces while maintaining low thermal effects, thereby preserving sample integrity [6]. This ongoing research into biosensing platforms seeks to overcome the constraints of traditional diagnostics and enables point-of-care testing for broader applications.
In parallel, biosensors have emerged as powerful tools for the detection of various biomolecules and pathogens due to their ability to convert biological responses into measurable signals [7]. Among the different types of biosensors, surface plasmon resonance (SPR) biosensors stand out for their label-free and real-time detection capabilities [8]. SPR is an optical phenomenon that occurs when polarized light interacts with a metal-dielectric interface, resulting in the generation of surface plasmons [9]. The resonance condition is highly sensitive to changes in the refractive index near the sensor surface, making SPR biosensors exceptionally sensitive to molecular binding features [10]. This technology has been successfully applied in numerous fields, including clinical diagnostics [11], environmental monitoring [12], and food safety [13].
In terms of effectiveness, SPR biosensors can be enhanced by incorporating advanced materials such as two-dimensional (2D) materials [14] or 2D periodic arrangements of one-dimensional (1D) systems [15]. Particularly, 2D materials such as graphene, hexagonal boron nitride (h-BN), transition metal dichalcogenides (TMDs) (e.g., MoS₂, WS₂, and MoSe₂), phosphorene (black phosphorus), MXenes (e.g., Ti₃C₂, Ti₂C), silicene, germanene, stanene, antimonene, and tellurene, exhibit unique electronic, mechanical, and optical properties that make them ideal for sensing applications [16]. Among these materials, graphene has received considerable attention due to its exceptional electrical conductivity, high surface area, and biocompatibility [17]. These properties allow graphene to serve as an effective transduction layer in SPR biosensors, improving signal strength and sensitivity [18]. Particularly, the large surface area of graphene is expected to facilitate the high-density immobilization of receptors, thereby increasing the capacity of graphene to capture target analytes [19].
Advancements have demonstrated the potential of integrating graphene with SPR biosensors for the detection of various biological targets, including viral pathogens [20]. The functionalization of graphene with specific receptors, such as antibodies or aptamers, enables the selective and sensitive detection of SARS-CoV-2, offering a promising alternative to traditional diagnostic methods [21]. Moreover, combining graphene with other materials, such as silicon nitride, can further enhance the stability and performance of the biosensor as observed by using black phosphorous [22]. Silicon nitride, known for its chemical stability and transparency, can be used as a protective layer or a waveguide in the biosensor design, contributing to improved signal integrity and robustness [23].
With this in mind, the present work focuses on the theoretical study of a multilayer SPR biosensor, incorporating graphene and silicon nitride for the sensitive and specific detection of SARS-CoV-2 at different concentrations. This analysis is based on numerical simulations to determine the reflectance of the systems under investigation, utilizing the Transfer Matrix Method (TMM) and Fresnel equations [20, 24]. The multilayer configuration is designed to enhance the performance of the sensor by leveraging the unique properties of these materials. The high electron mobility and surface area of graphene are expected to improve the sensitivity of the biosensor, while silicon nitride provides structural stability and optical clarity. This biosensor aims to achieve rapid, accurate detection of SARS-CoV-2, potentially offering a powerful tool for point-of-care diagnostics and epidemiological monitoring.
2 Methodology
2.1 Biosensor configuration
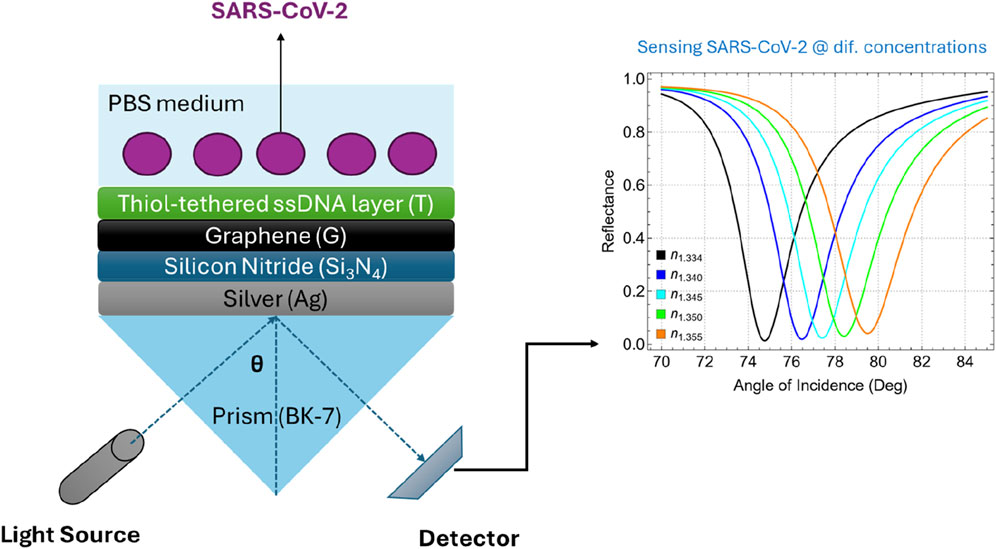
The proposed multilayer SPR biosensor is depicted in Figure 1. This sensor architecture integrates multiple layers, originating different configurations from the most basic to the most complex structures (Supplementary Table S1). The base of the biosensor is a BK-7 prism, which serves as the coupling medium for the incident light beam. BK-7 glass is characterized by its excellent optical transparency across the visible and near-infrared spectrum and has a refractive index of about 1.5151 at 633 nm (Supplementary Table S2) [25]. The high optical quality and availability of BK-7 glass make it a standard choice in SPR sensor configurations compared to other conventional prisms such as SF10 [20].
The plasmonic component of the sensor is a thin silver (Ag) film deposited on the BK-7 prism. Silver is favored over other metals such as gold due to its superior plasmonic properties, which result in a sharper and more defined resonance peak [26]. While silver is susceptible to oxidation, this issue is effectively mitigated by the protective silicon nitride layer, which safeguards the silver surface from degradation. Then, a thin layer of silicon nitride (Si3N4) is deposited over the silver film. As claimed, Si3N4 acts as a protective dielectric layer, shielding the silver film from oxidation while maintaining the structural stability of the biosensor [27]. Additionally, the dielectric properties of Si3N4 contribute to enhancing the electromagnetic field at the sensor surface, which is crucial for effective signal transduction [28]. This layer also serves as a compatible substrate for the subsequent deposition of graphene. Graphene, a single layer of carbon atoms arranged in a hexagonal lattice [29], is employed as the primary transduction layer in the biosensor. In particular, the high conductivity of graphene facilitates efficient signal amplification, while its biocompatibility allows for the stable immobilization of biomolecules [24].
Lastly, the biosensor surface is functionalized with a thiol-tethered ssDNA layer designed to capture complementary sequences of SARS-CoV-2 RNA [30]. The thiol group provides a robust and stable covalent bond to the graphene surface, ensuring that the ssDNA molecules are anchored and properly oriented. This configuration not only enhances the selectivity of the sensor but also minimizes non-specific binding, which is critical for achieving low detection limits in complex biological samples. The use of the ssDNA layer as the biorecognition element relies on the principle of complementary base pairing, a molecular mechanism where specific nucleotide bases in DNA or RNA naturally form hydrogen bonds with their complementary counterparts (i.e., adenine pairs with thymine or uracil, and cytosine pairs with guanine) [31]. This precise pairing enables the ssDNA layer to selectively bind to the target viral RNA sequence, allowing the biosensor to detect the presence of SARS-CoV-2 RNA with high specificity and accuracy.
Supplementary Table S1 shows a systematic progression of biosensor configurations analyzed in this study, starting from a basic setup and advancing to more complex structures. The simplest configuration, Sys0, encompasses only the prism, silver layer, and medium (P/Ag/M), representing a conventional SPR sensor. Adding a silicon nitride layer in Sys1 (P/Ag/SN/M) is expected to improve structural stability but lacks target detection capability. Introducing a thiol-tethered ssDNA layer in Sys2 (P/Ag/SN/T/M) provides specific binding sites for SARS-CoV-2 RNA, which is expected to enhance the selectivity of the sensor. Similarly, the incorporation of graphene in Sys3 (P/Ag/G/M) is expected to improve the sensitivity due to its high surface area and excellent electronic properties. Further functionalization with ssDNA in Sys4 (P/Ag/G/T/M) enhances both sensitivity and specificity. Configurations Sys5 and Sys6 explore different layer sequences of Si3N4 and graphene, affecting the sensor performance. The final configurations, Sys7 and Sys8, integrate all components (P/Ag/SN/G/T/M and P/Ag/G/SN/T/M), suggesting the optimal balance of sensitivity, stability, and specificity.
To further emphasize, the specific order of layers in the final configurations, Sys7 (P/Ag/SN/G/T/M) and Sys8 (P/Ag/G/SN/T/M) were chosen to evaluate how layer arrangement impacts sensor performance. In Sys7, the Si₃N₄ layer is placed directly on top of the Ag layer, which provides immediate protection against silver oxidation and stabilizes the plasmonic properties essential for sharp resonance. This arrangement enables the graphene layer to be positioned above the Si₃N₄, maximizing its role as a transduction layer by enhancing signal amplification. The thiol-tethered ssDNA layer sits on top, directly interfacing with the sample medium, where it acts as the primary biorecognition element, capturing SARS-CoV-2 RNA with high specificity due to complementary base pairing.
In Sys8, the sequence of graphene and silicon nitride layers is reversed. By placing graphene directly on the silver surface, Sys8 aims to exploit the strong interaction between graphene and silver, which can enhance electron transfer processes and potentially further increase sensitivity. However, the Si₃N₄ layer in this configuration still serves as a protective barrier, though above the graphene layer. After testing both configurations, Sys7 was found to be the optimized version (discussed below). Additionally, the experimental feasibility of this type of graphene-based biosensors has been widely reported [32].
Supplementary Table S2 presents the initial parameters (i.e., refractive index and thickness) for each layer in the proposed biosensor before optimization. To emphasize, the BK-7 prism (refractive index 1.5151) provides efficient light coupling. A 55 nm silver layer (refractive index 0.056253 + 4.2760i) is selected to generate a sharp plasmonic resonance. The 5 nm silicon nitride layer (refractive index 2.0394) enhances the field intensity at the sensor surface, while the graphene layer (thickness 0.34 nm, refractive index 2.7611 + 1.6987i) amplifies the sensor signal due to its excellent plasmonic properties. The thiol-tethered ssDNA layer (thickness 3.20 nm, refractive index 1.462) offers specific binding sites for the viral RNA, ensuring targeted detection.
2.2 Modeling approach
We have carried out a numerical analysis to calculate the reflectance curve using TMM and Fresnel equation, see details about the mathematical model in [20, 24], for details see Supplementary Information. Then, the total reflection analysis of the N-layer system is obtained as:
It is noted that for each SPR curve, surface plasmon excitation is identified as a dip in the reflected intensity
The sensitivity to the refractive index change can be expressed as:
The parameter
Finally, quality factor (QF) can be expressed in terms of
3 Results and discussions
3.1 Finding the best system configuration
Figure 2 shows the reflectance curves for different system configurations as a function of the angle of incidence ranging from 60° to 80°. Each panel compares the SPR response of a specific set of configurations against the baseline system (Sys0, black). In Figure 2A, the addition of a Si3N4 layer (Sys1, green) and a thiol-tethered ssDNA layer (Sys2, darker green) to the baseline configuration is shown. Both configurations demonstrate a noticeable shift in the SPR angle compared to Sys0. The introduction of Si3N4 increases the refractive index at the interface, causing a shift towards higher incidence angles as well as the inclusion of the ssDNA layer in Sys2 further accentuates this shift. Similarly, Figure 2B shows the impact of incorporating graphene (Sys3, cyan) and its subsequent functionalization with ssDNA (Sys4, blue). The presence of graphene sharpens the resonance dip and causes a slight SPR angle shift compared to Sys0. Functionalizing graphene with ssDNA in Sys4 further increases the SPR angle shift.
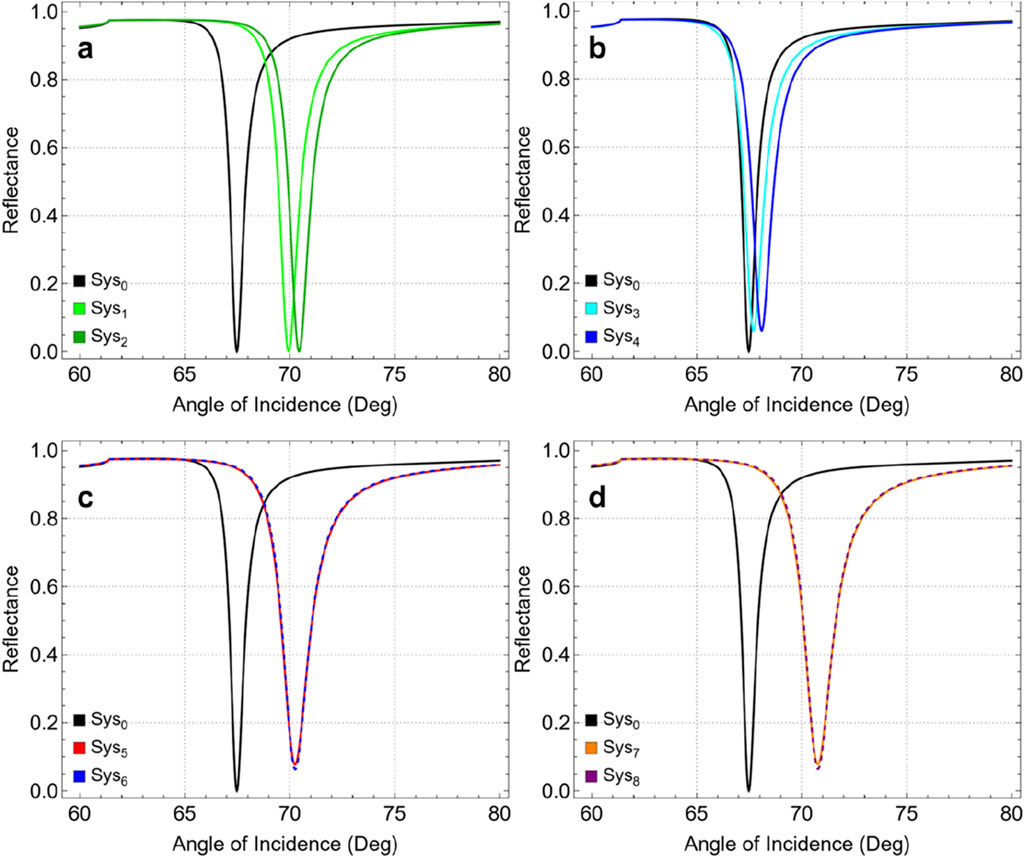
Figure 2. SPR curves as a function of the angle of incidence, compared to Sys0: (A) Sys1 and Sys2,(B) Sys3 and Sys4,(C) Sys5 and Sys6, and (D) Sys7 and Sys8.
Instead, Figure 2C presents the configurations Sys5 (red) and Sys6 (dashed blue), where the sequence of graphene and Si3N4 layers is alternated. Both systems show a substantial SPR angle shift compared to Sys0. However, the alternated sequence displays a non-critical influence of layer arrangement on the optical response of the biosensor. Analogously, in Figure 4D, Sys7 (orange) and Sys8 (dashed purple) represent the most advanced configurations, incorporating graphene, Si3N4, and ssDNA layers in different sequences, i.e., Si3N4/graphene/ssDNA or graphene/Si3N4/ssDNA. These systems exhibit large SPR angle shifts, suggesting that Sys7 and Sys8 are characterized by the greatest improvement.
Figure 3 and Supplementary Table S3 present the attenuation percentage, FWHM, and enhancement percentage for the various configurations, compared to the simplest configuration (Sys0, Figure 3A). Figure 3B shows the attenuation percentage of reflectance intensity as a function of the configuration system. An increase in attenuation is observed from Sys3 onwards, with a significant jump of 6.02%. This indicates that the incorporation of graphene drastically augments the interaction between the incident light and the sensor surface, resulting in greater energy loss and thus higher attenuation. The increasing trend continues from Sys4 to Sys8, with Sys7 achieving the highest attenuation (7.80%). This fact confirms the critical role of graphene, in the plasmonic response and sensitivity of the biosensor.
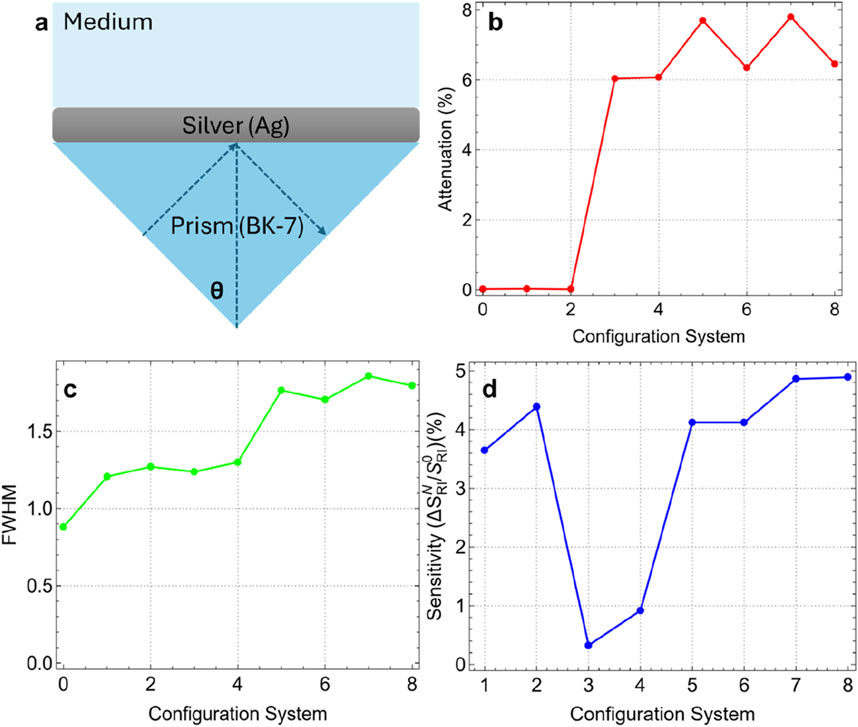
Figure 3. (A) Most basic SPR biosensor configuration. Results as a function of system configuration: (B) Attenuation percentage, (C) FWHM, and (D) sensitivity enhancement.
Figure 3C depicts the FWHM of the SPR curves for each configuration. The FWHM increases steadily with the complexity of the configurations, indicating a broader resonance dip. Sys0 has the narrowest FWHM (0.88 nm), reflecting a sharper resonance. The increase in FWHM with the addition of functional layers (up to 1.86 nm for Sys7) suggests an enhanced interaction volume, notwithstanding the cost of a broader resonance. This trade-off between sharpness and sensitivity is a common consideration in SPR biosensor design due to the inverse relationship between performance metrics and FWHM (see Equations 3, 4).
Figure 3D evaluates the sensitivity enhancement percentage (using Equation 1) of each configuration compared to Sys0. Then, sensitivity enhancement is defined as the change in SPR angle position after adding the different layers in comparison with the conventional sensor (Figure 3A). Sys7 and Sys8 exhibit the highest enhancement (4.86% and 4.89%), primarily due to the addition of the ssDNA layer. To clarify this fact, a drop in sensitivity enhancement is observed in Sys3 and Sys4 due to the introduction of graphene. It is observed that the sensitivity enhancement increases since Sys5 (4.12%), indicating that the strategic combination of graphene, Si3N4, and ssDNA layers can recover the sensitivity enhancement beyond the initial drop.
Based on these results, we selected Sys7 as the best configuration for the subsequent sensing of SARS-CoV-2. The selection of Sys7 as the optimal configuration is based on an evaluation of both sensitivity enhancement and practical considerations for biosensor fabrication. Although Sys8 exhibited a slightly higher sensitivity enhancement (4.89%) compared to Sys7 (4.86%), the difference is marginal (0.03%). On the other hand, the configuration of Sys7 is less complex compared to Sys8, reducing the risk of fabrication challenges such as layer misalignment, uneven thickness, and interfacial defects. In Sys7, placing the Si3N4 layer directly on the silver film before the graphene layer provides technical advantages:
• Si3N4 acts as a protective dielectric layer that prevents the silver film from oxidizing, which could otherwise degrade the plasmonic properties of silver.
• This layer also serves as an excellent substrate for the subsequent deposition of graphene, ensuring a uniform and stable interface.
• Moreover, Si3N4 enhances the electric field strength at the metal-dielectric interface, which is crucial for improving the sensitivity of the SPR signal.
Considering these points, the remainder of this paper will focus on the Sys7 configuration, where the optimization of the different layer thicknesses will be conducted while keeping the refractive index constant and assuming that variations in the refractive index are negligible.
3.2 Optimization of silver thickness
Figure 4A shows the SPR curves for different silver thicknesses (from 40 nm to 65 nm) as a function of the angle of incidence. A distinct reflectance intensity in the resulting SPR curves is observed as the thickness of the silver layer increases. Notably, the reflectance dip is the sharpest and most pronounced at a silver thickness of 50 nm. Figure 4B confirms that the minimum attenuation (0.41%) is achieved at this thickness (Ag50nm). This suggests that at 50 nm, the SPR conditions are most favorable for minimizing energy loss due to plasmon excitation, resulting in an optimal resonance response. Increasing the thickness beyond 50 nm leads to a significant rise in attenuation, reaching 38.65% at 65 nm. This increase indicates a higher energy dissipation in the metal layer, which can dampen the plasmonic response and reduce the efficiency of the biosensor.
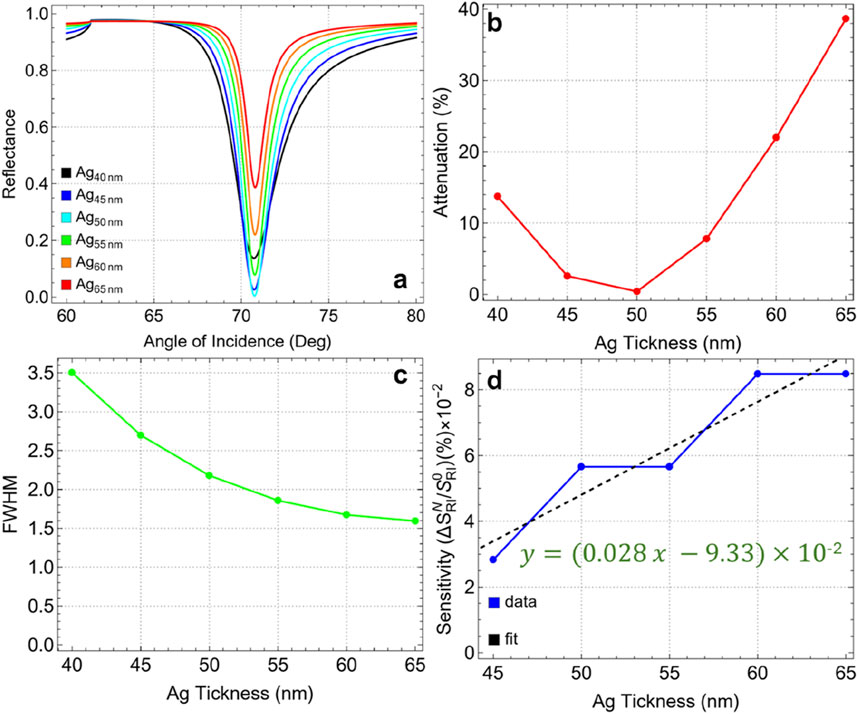
Figure 4. (A) SPR curves as a function of the angle of incidence for different values of silver thickness. (B) Attenuation percentage, (C) FWHM, and (D) sensitivity enhancement.
The FWHM values, presented in Figure 4C and Supplementary Table S4, show a decreasing trend with increasing silver thickness. The initial FWHM of 3.50 nm at 40 nm thickness narrows to 1.59 nm at 65 nm. This indicates that thicker silver layers produce sharper resonance dips, which are generally associated with higher spectral resolution. However, while a narrower FWHM is desirable for distinguishing small refractive index changes, it does not directly correlate with increased sensitivity in this context, as shown by the sensitivity enhancement when compared to 40 nm layer thickness (Figure 4D). Indeed, the sensitivity enhancement (with a quasi-linear increase, y = 0.00028x-0.0933), remains relatively low across all silver thicknesses, with values on the order of 10–2. This indicates that, although the silver thickness affects the plasmonic field distribution and resonance conditions, it is not the primary factor driving sensitivity improvements in the biosensor configuration.
Then, the optimal silver thickness is concluded to be 50 nm. At this thickness, the biosensor exhibits minimal attenuation, indicating the most efficient coupling of the plasmonic field. Although sensitivity enhancement is not significantly influenced by silver thickness, minimizing attenuation is crucial for achieving a clear and strong SPR signal. Therefore, the optimization of the silver layer is guided by attenuation metrics rather than sensitivity enhancement in this case.
3.3 Optimization of silicon nitride thickness
Figure 5 and Supplementary Table S5 present the results for various silicon nitride thicknesses ranging from 5 nm to 10 nm, with key performance metrics such as attenuation, FWHM, and sensitivity enhancement analyzed. In Figure 5A, as the silicon nitride thickness increases from 5 nm to 10 nm, there is a noticeable shift in the resonance angle along with marginal changes in the reflectance intensity. The resonance dip becomes broader and shifts to higher angles with increasing silicon nitride thickness, evidencing a modification in the plasmonic response of the sensor. Figure 5B emphasizes the marginal attenuation percentage for each thickness value. The results show a gradual increase in attenuation from 0.41% at 5 nm to 1.28% at 10 nm. Despite this increase, the maximum attenuation at 10 nm remains relatively low, below 2%, suggesting that energy losses due to plasmon excitation are still minimal, and the resonance conditions remain favorable. The low attenuation combined with the sharp resonance dip at higher thicknesses makes 10 nm a strong candidate for the optimal silicon nitride thickness.
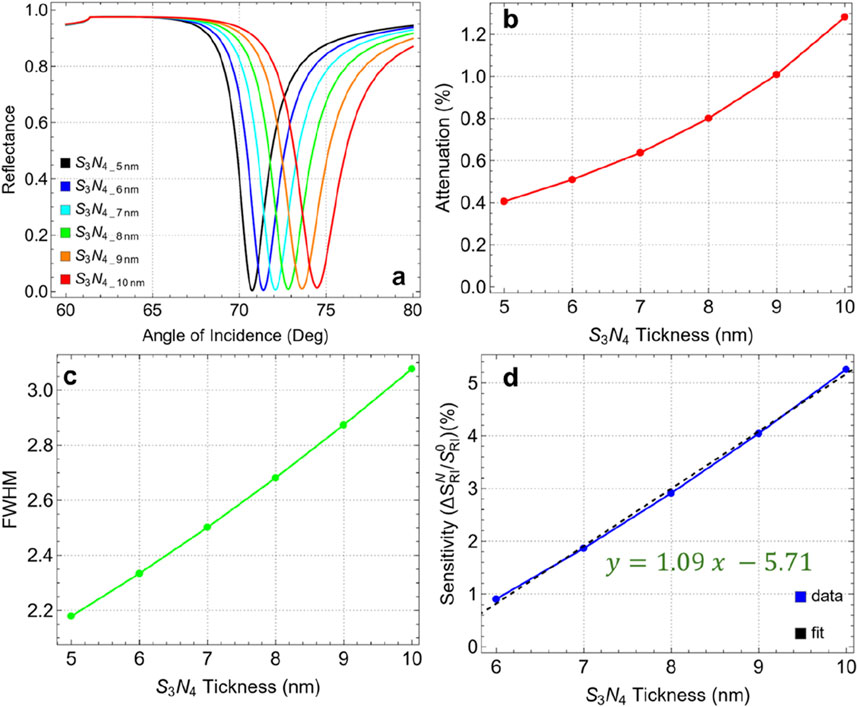
Figure 5. (A) SPR curves as a function of the angle of incidence for different values of silicon nitride thickness. (B) Attenuation percentage, (C) FWHM, and (D) enhancement sensitivity.
In Figure 5C, the FWHM values increase with the thickness of the silicon nitride layer, from 2.18 nm at 5 nm thickness to 3.08 nm at 10 nm. This widening of the FWHM indicates a broader resonance dip, which can be interpreted as a reduction in the spectral resolution of the sensor. However, this trade-off is counterbalanced by an improvement in the sensitivity enhancement of the sensor. Indeed, Figure 5D presents sensitivity enhancement compared to 5 nm thickness, showing a clear linear trend (y = 1.09x - 5.71) of increasing enhancement with thicker silicon nitride layers. The sensitivity enhancement rises from 0.91% at 6 nm to 5.26% at 10 nm. This important increase demonstrates the positive effect of a thicker dielectric layer in amplifying the sensitivity enhancement of the SPR biosensor.
These results suggest potential for further optimization of the silicon nitride layer. However, as shown in Supplementary Figure S1, the SPR curve measured across thicknesses from 10 to 100 nm reveals that beyond 20 nm, the SPR signal vanishes entirely. This observation indicates an optimal thickness range between 5 and 20 nm. An in-depth analysis of the 5–20 nm range is provided in Supplementary Figure S2. Specifically, Supplementary Figure S2A displays well-defined SPR peaks up to 15 nm, beyond which the SPR curve at 20 nm undergoes a significant alteration. Supplementary Figure S2B reveals an attenuation of about 3% at 13 nm, increasing critically to 87.3% at 20 nm. Meanwhile, Supplementary Figure S2C points out a rise in FWHM from 4 to 13 nm, reaching 12.75 nm at 20 nm. Although Supplementary Figure S2D shows a sensitivity enhancement of 20.44% at 20 nm, the pronounced attenuation and FWHM values make this thickness unsuitable for practical applications.
Hence, a silicon nitride thickness of 10 nm is identified as the optimal choice for the current biosensor configuration. At this thickness, the sensor exhibits good sensitivity enhancement (5.26%) while maintaining attenuation below 2%. Although there is an increase in FWHM, this is acceptable given the important improvement in sensitivity enhancement.
3.4 Optimization of the number of graphene layers
Figure 6 and Supplementary Table S6 show the effects of increasing the number of graphene layers, from one to six, on the key performance metrics of the sensor. In Figure 6A, we observe that as the number of layers increases, the SPR dip broadens and shifts toward higher incidence angles. This behavior indicates a pronounced alteration in the plasmonic response of the sensor, primarily due to the increase in optical thickness and the stronger interaction of the electromagnetic field with the additional graphene layers.
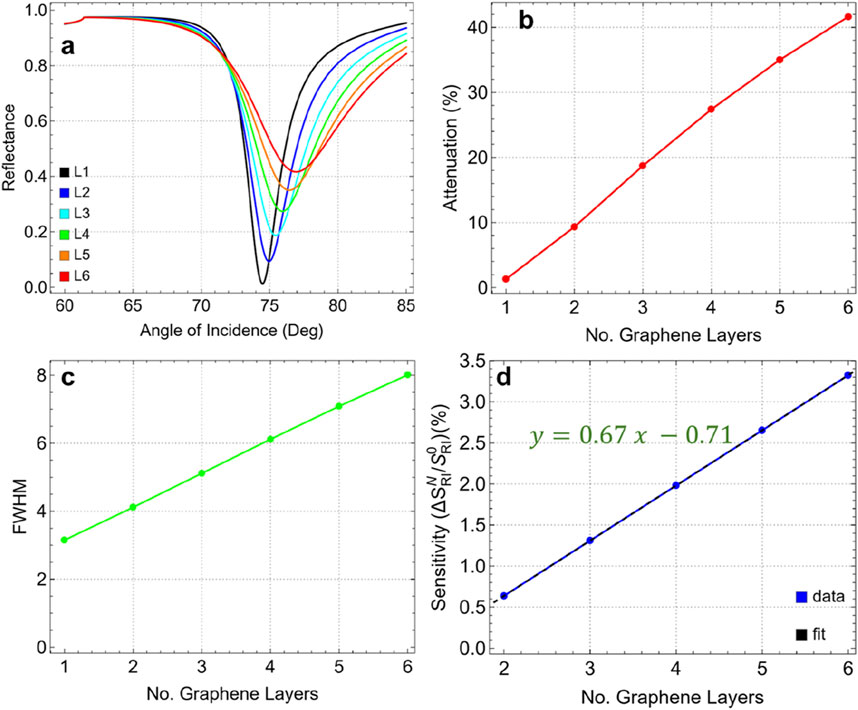
Figure 6. (A) SPR curves as a function of the angle of incidence ranging from 60° to 85° by increasing the number of graphene layers from 1 to 6. (B) Attenuation percentage, (C) FWHM, and (D) enhancement sensitivity as a function of the number of graphene layers.
Figure 6B presents the attenuation values corresponding to each layer configuration, showing a substantial increase in attenuation as additional graphene layers are added. For a single graphene layer (L1), the attenuation is relatively low at 1.28%. However, with each added layer, attenuation increases sharply, reaching 41.64% for six layers (L6). This steep rise indicates that additional layers lead to more energy dissipation, which diminishes the signal quality and reduces the plasmonic efficiency of the sensor.
In Figure 6C, we see that the FWHM values also increase significantly with the number of graphene layers. For a single-layer graphene sensor, the FWHM is 3.15 nm; however, with six layers, it broadens to 8.01 nm. This widening of the FWHM indicates a notable reduction in spectral resolution, as a broader resonance width lowers the precision of the sensor in distinguishing small refractive index changes. A narrower FWHM is generally preferred for biosensing applications to ensure high accuracy and sensitivity, making this broadening a key consideration when optimizing layer count.
Figure 6D shows the sensitivity enhancement trend as a function of the number of graphene layers compared to single-layer graphene, which follows a linear relationship (y = 0.67x - 0.71). Sensitivity improves incrementally with each additional layer, rising from 0.64% for two layers (L2) to a maximum of 3.32% for six layers (L6). Although sensitivity increases with additional layers, the complete sensitivity enhancement remains relatively modest. This limited improvement in sensitivity, coupled with the significant increase in attenuation and FWHM, suggests that beyond a single layer, additional graphene layers yield diminishing returns in terms of performance benefits.
To remark on the two- and three-layer graphene (Supplementary Table S6), the attenuation is 9.33% for L2 and 18.73% for L3 with an FWHM of 4.12 nm and 5.12 nm, respectively. Then, the one-layer graphene (L1) continues to be the optimal parameter for the biosensor configuration. This choice is supported by:
• At one layer, the attenuation is minimal (1.28%), ensuring that the sensor maintains strong plasmonic coupling and effective signal quality.
• The FWHM is the lowest (3.15 nm) for a single graphene layer, indicating a sharp and well-defined resonance dip, which is crucial for high-resolution sensing.
• Although the sensitivity enhancement is higher with six layers, the modest increase with additional layers does not justify the significant losses in signal quality and resolution.
• Using a single graphene layer provides the best balance between maintaining low attenuation, achieving a sharp resonance dip, and ensuring stable performance.
3.5 Optimization of thiol-tethered ssDNA thickness
Figure 7 and Supplementary Table S7 present the results for varying ssDNA thicknesses from 2.4 nm to 4.4 nm. In Figure 7A, the resonance dips remain relatively stable, indicating that variations in ssDNA thickness have a marginal effect on the position and shape of the resonance angle. Figure 7B demonstrates that the attenuation percentage remains constant with thickness, from 1.24% at 2.4 nm to 1.35% at 4.4 nm. This low attenuation, even at the maximum thickness tested, indicates that the ssDNA layer does not significantly disrupt the plasmonic field, maintaining effective energy coupling and resonance conditions.
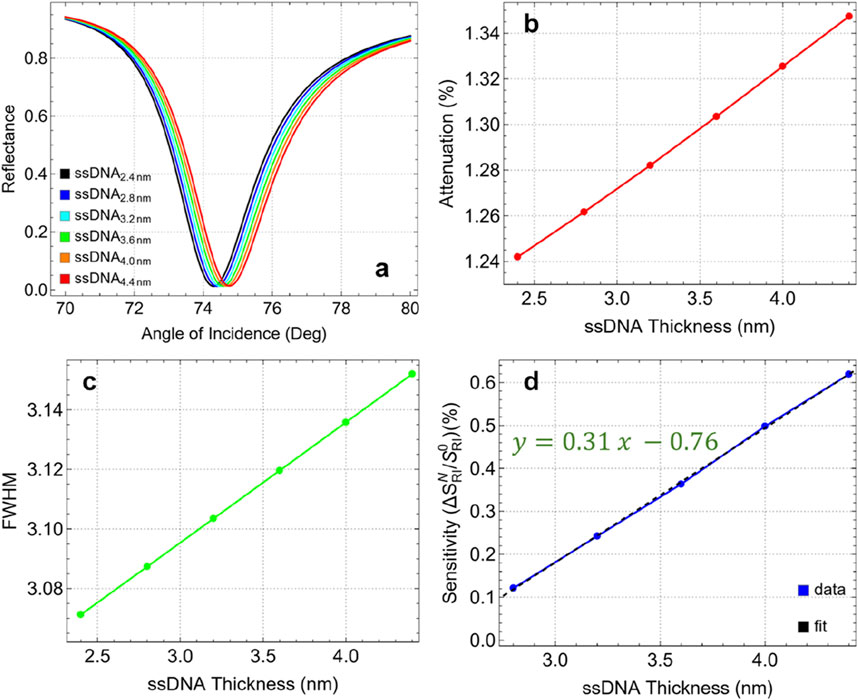
Figure 7. (A) SPR curves as a function of the angle of incidence for different values of ssDNA thickness. (B) Attenuation percentage, (C) FWHM, and (D) enhancement sensitivity.
The FWHM values, as shown in Figure 7C, fluctuate minimally with changes in ssDNA thickness. The FWHM increases from 3.07 nm at 2.4 nm thickness to 3.15 nm at 4.4 nm, indicating a minor broadening of the resonance dip. This consistency in FWHM suggests that the ssDNA layer has a negligible impact on the spectral resolution of the sensor within this thickness range. On the other hand, the sensitivity enhancement compared to 2.4 nm thickness, shown in Figure 7D, increases linearly with the thickness of the ssDNA layer. Enhancement rises from 0.12% at 2.8 nm to 0.62% at 4.4 nm. Although the maximum observed enhancement is relatively low (0.62%), it represents the best performance within the tested range. Additionally, based on the linear trend (y = 0.31x – 0.76), it is suggested that further increases in ssDNA thickness could potentially continue to enhance sensitivity. However, prior studies have shown that for multilayer biosensors detecting biomolecules, sensitivity drops dramatically beyond larger ssDNA layer thickness which can be attributed to the increased steric hindrance and reduced biomolecular interaction efficiency [22].
Then, the optimal ssDNA thickness is identified as 4.4 nm. At this thickness, the sensor demonstrates a balanced performance with low attenuation (1.35%), minimal changes in FWHM (3.15 nm), and the highest sensitivity enhancement (0.62%) among the tested values. Therefore, maintaining the ssDNA thickness below 5 nm is recommended to ensure optimal interaction between the biosensor and the target analytes, maximizing the sensitivity and stability of the sensor. This optimized configuration will serve as the base for the detection of SARS-CoV-2.
3.6 Application of the optimized SRP biosensor for the SARS-CoV-2 sensing
Supplementary Table S8 presents the optimized parameters of Sys7 and the corresponding refractive index values for SARS-CoV-2 at various concentrations in a phosphate-buffered saline (PBS) solution. To remark, the optimized parameters include a 50 nm silver layer, a 10 nm silicon nitride layer, a single graphene layer (0.34 nm), and a 4.4 nm ssDNA layer. This configuration was chosen to balance sensitivity, stability, and ease of fabrication. The refractive index values for SARS-CoV-2 range from 1.340 at a concentration of 150 mM to 1.355 at 525 mM. Specifically, Kumar et al. [31] utilized a theoretical and experimental approach to measure the refractive index of SARS-CoV-2 at different concentrations in a PBS solution. They employed the Kretschmann configuration of the SPR sensor, in which a p-polarized light beam is incident on a multi-layered structure.
Figure 8 and Supplementary Table S9 present the results of detecting SARS-CoV-2 using the optimized Sys7 configuration at various concentrations. The analysis focuses on the effects of virus adsorption on attenuation, FWHM, and sensitivity enhancement of the biosensor as the refractive index of the medium changes (by Equation 2) with increasing viral concentration. Figure 8A shows the SPR curves for different concentrations of SARS-CoV-2, corresponding to refractive index values ranging from 1.334 (PBS only) to 1.355 (525 mM). As the concentration increases, the resonance angle shifts toward higher values, indicating a direct correlation between virus concentration and refractive index change. Figure 8B shows a steady increase in attenuation from 1.35% at 0 mM (PBS only) to 4.10% at 525 mM. This increase reflects the enhanced interaction between the sensor surface and the virus particles, leading to greater energy dissipation. The higher attenuation at elevated concentrations suggests that the sensor is effectively responding to the presence of the virus, making it a reliable indicator of viral load in the sample.
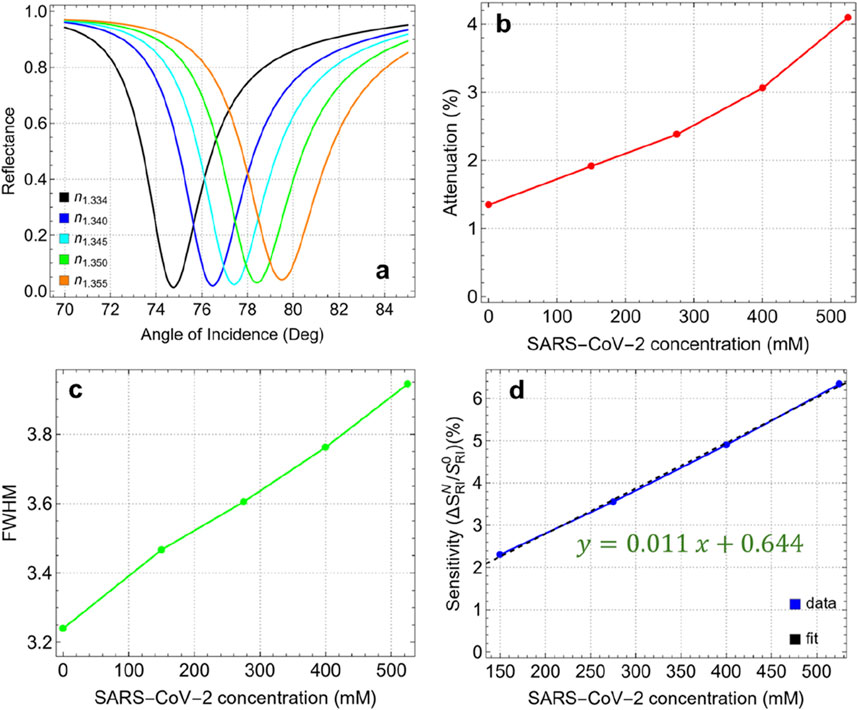
Figure 8. (A) SPR curves as a function of the angle of incidence for different values of SARS-CoV-2 concentration. (B) Attenuation percentage, (C) FWHM, and (D) enhancement sensitivity.
The FWHM values, shown in Figure 8C, increase gradually from 3.23 nm at 0 mM to 3.95 nm at 525 mM. This broadening of the resonance dip indicates a slight reduction in spectral resolution as the virus concentration increases. The broader FWHM at higher concentrations suggests that the interaction volume between the sensor surface and the analyte is expanding, which could reduce the precision of the sensor in distinguishing small changes in refractive index. However, the FWHM remains within a manageable range, ensuring that the sensor maintains its effectiveness even at higher viral concentrations. Figure 8D depicts the sensitivity enhancement as a function of SARS-CoV-2 concentration compared to the absence of the virus (0 mM). The linear relationship (y = 0.011x+0.644) shows a steady increase in sensitivity, from 2.31% at 150 mM to 6.34% at 525 mM. The observed sensitivity suggests that the optimized Sys7 configuration is well-suited for detecting even small changes in viral load, making it effective for early diagnosis and monitoring of SARS-CoV-2.
Figure 9 and Supplementary Table S10 show the performance metrics for the optimized Sys7 configuration in detecting SARS-CoV-2 across different concentrations. Key metrics such as variation in the resonance angle (Δθ), sensitivity to refractive index changes (S), detection accuracy (DA), and quality factor (QF) are analyzed. The Δθ values increase linearly with SARS-CoV-2 concentration, ranging from 1.73° at 150 mM to 4.74° at 525 mM. This linear relationship (y = 0.008x+0.482) confirms that the sensor is highly responsive to changes in the refractive index caused by different viral concentrations.
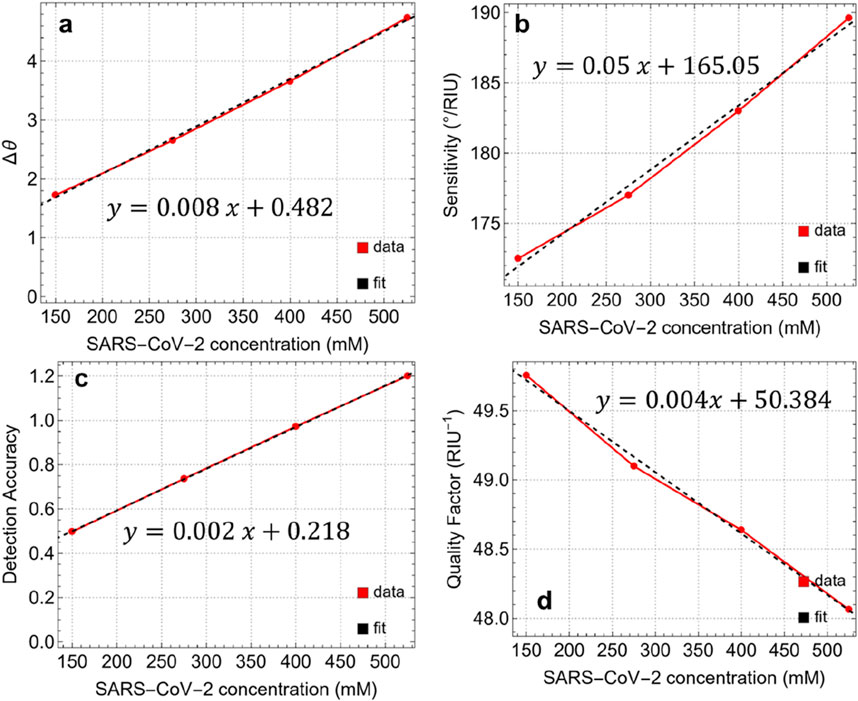
Figure 9. (A) Angle variation after the adsorption of SARS-CoV-2 at different concentrations. Performance metrics: (B) Sensitivity, (C) Detection Accuracy, and (D) Quality Factor.
The S values also show a linear increase in viral concentration, ranging from 172.5°/RIU at 150 mM to 189.6°/RIU at 525 mM. This indicates that the responsiveness of the sensor to refractive index variations improves with higher viral concentrations, which is crucial for achieving accurate detection. The linear equation (y = 0.05x+165.05) reflects this trend, suggesting that the sensor can maintain high sensitivity even at lower concentrations, which is essential for early-stage detection of the virus. The DA is a critical parameter for evaluating the precision of the sensor in distinguishing different concentrations of SARS-CoV-2. The DA increases steadily from 0.50 at 150 mM to 1.20 at 525 mM, following a linear trend (y = 0.002x+0.218). This progression further highlights the improved ability of the sensor to accurately detect and differentiate between various viral concentrations, reducing the likelihood of false positives or negatives.
The QF is a measure of the whole performance of the sensor, considering both sensitivity and resonance sharpness. In this study, QF decreases slightly from 49.76 RIU−1 at 150 mM to 48.06 RIU−1 at 525 mM. This decline, described by a linear rend (y = 0.004x+50.384), suggests that while the sensor maintains high sensitivity, there is a minor trade-off in spectral resolution as the concentration increases. However, the QF remains above 48 RIU−1, indicating that the sensor retains a high level of performance across the tested concentration range.
3.7 Comparison with previous works
Table 1 provides a comparison of the sensing performance of our proposed SPR biosensor along with recently reported biosensors [32–38]. Various configurations using materials such as PtSe₂, MoS₂, WS₂, and BaTiO₃ in combination with metals such as Ag and Au have been investigated in recent studies, each offering unique advantages in specific applications. In particular, the sensitivity of our biosensor (189.6°/RIU) falls within a competitive range when compared with other designs. For instance, the hybrid structures reported by Moznuzzaman et al. [35] (194°/RIU) and Lin et al. [33] (194°/RIU) demonstrate similar sensitivity, while configurations by Dey et al. [36] (208°/RIU) and Mostufa et al. [37] (230.77°/RIU) provide slightly higher sensitivities. However, the inclusion of a single graphene layer in our sensor design offers a balance between sensitivity and spectral resolution, ensuring minimal signal attenuation and better suitability for point-of-care diagnostics.
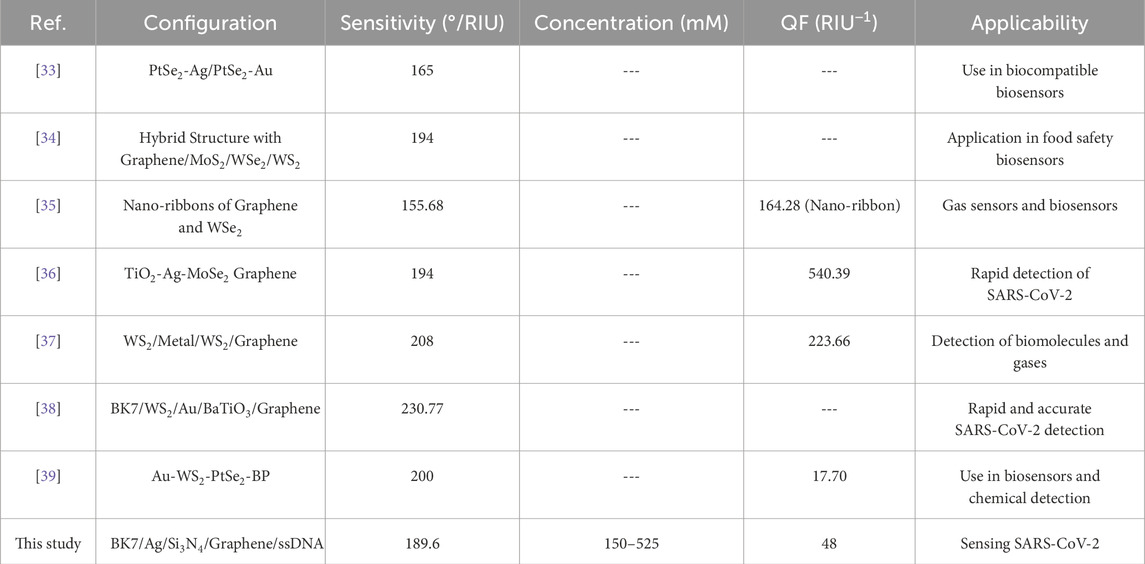
Table 1. Comparison of the sensing performance of the proposed SPR biosensor with recently reported configurations for biosensing applications, including sensitivity, quality factor (QF), and specific applicability.
In terms of QF, our biosensor (48 RIU⁻1) achieves moderate values, which are lower than some alternatives, such as the TiO₂-Ag-MoSe₂-Graphene sensor by Moznuzzaman et al. [35] (540.39 RIU⁻1). While certain designs achieve higher QF values, these often involve multiple or complex nanomaterial combinations that may increase fabrication complexity and cost. Our choice of a simpler, more practical configuration provides adequate performance for SARS-CoV-2 detection while maintaining manufacturability and stability.
Our proposed biosensor is specifically designed for SARS-CoV-2 detection across a concentration range of 150–525 mM, supporting its potential applicability in real-time viral detection. In comparison, several recent designs, such as those by Mostufa et al. [37] and Moznuzzaman et al. [35], also target SARS-CoV-2 detection, highlighting the ongoing focus on rapid, reliable biosensing solutions during the COVID-19 pandemic. Other configurations are applied to different biosensing fields, including food safety, gas detection, and general biomolecule sensing, demonstrating the versatility of 2D material-based SPR biosensors.
While this study presents a theoretical framework for optimizing the multilayer SPR biosensor configuration, we recognise that achieving the recommended layer thicknesses in a practical setting depends on high-precision nano-coating techniques. Theoretical simulations suggest that a silicon nitride thickness of 10 nm and precise single-layer graphene deposition are essential to maximize sensor performance in terms of sensitivity, specificity, and stability. In practical fabrication, however, achieving such exact thicknesses would require precise deposition methods, as minor variations in layer thickness can significantly impact the plasmonic response. To match the design standards outlined in this study, advanced nano-fabrication techniques, such as atomic layer deposition (ALD) [40] or molecular beam epitaxy (MBE) [41], are suitable options. ALD, for instance, allows for atomic-level control over film thickness and uniformity, making it well-suited for producing thin films like silicon nitride with high precision. Similarly, MBE offers controlled deposition of thin films with atomic precision, which is critical when working with ultra-thin graphene and other 2D materials. These methods enable the high-accuracy layering necessary to translate theoretical design parameters into physical devices.
However, given that this work is a theoretical analysis, a detailed investigation into the experimental precision of nano-coating techniques falls outside the scope of the current study. Our primary objective has been to establish an optimal configuration and layer structure for SPR biosensors targeting SARS-CoV-2 detection. Future experimental studies should focus on exploring the application of these high-precision techniques in biosensor fabrication, validating the theoretical design under practical conditions, and evaluating the reproducibility of layer thicknesses to meet our proposed standards.
4 Conclusion
This study developed and optimized a multilayer SPR biosensor configuration tailored specifically for detecting SARS-CoV-2. By carefully selecting and optimizing each layer—comprising a 50 nm silver film, 10 nm silicon nitride layer, a single graphene layer, and a 4.4 nm ssDNA bioreceptor layer—the biosensor was designed to achieve a balance between high sensitivity, structural stability, and practical manufacturability. In particular, the optimized Sys7 biosensor demonstrated excellent performance metrics across a wide range of SARS-CoV-2 concentrations. The sensor exhibited a linear increase in both resonance angle shift and sensitivity enhancement as viral concentrations increased, with a maximum sensitivity enhancement of 6.34% at 525 mM. This high sensitivity, coupled with a improvement in detection accuracy, confirms the capacity of the sensor to detect and quantify SARS-CoV-2 effectively. Moreover, the biosensor maintained a high-quality factor and stable FWHM values throughout the tested concentration range, indicating that it retains good spectral resolution and reliability. This robustness is critical for practical applications, ensuring consistent and repeatable performance in diverse settings, from clinical diagnostics to field-based testing.
Looking forward, future research could focus on enhancing the specificity of the biosensor by exploring alternative functionalization strategies to minimize cross-reactivity with other pathogens. Additionally, integrating the biosensor into portable and automated detection systems could expand its application for rapid, point-of-care testing, making it a powerful tool for managing future viral outbreaks and other public health challenges.
Data availability statement
The original contributions presented in the study are included in the article/Supplementary Material, further inquiries can be directed to the corresponding author.
Author contributions
TT: Conceptualization, Data curation, Formal Analysis, Funding acquisition, Investigation, Methodology, Project administration, Resources, Software, Supervision, Validation, Visualization, Writing–original draft, Writing–review and editing. MG: Conceptualization, Data curation, Formal Analysis, Funding acquisition, Investigation, Methodology, Project administration, Resources, Software, Supervision, Validation, Visualization, Writing–original draft, Writing–review and editing. PR: Conceptualization, Data curation, Formal Analysis, Funding acquisition, Investigation, Methodology, Project administration, Resources, Software, Supervision, Validation, Visualization, Writing–original draft, Writing–review and editing. AG: Conceptualization, Data curation, Formal Analysis, Funding acquisition, Investigation, Methodology, Project administration, Resources, Software, Supervision, Validation, Visualization, Writing–original draft, Writing–review and editing. LG: Conceptualization, Data curation, Formal Analysis, Funding acquisition, Investigation, Methodology, Project administration, Resources, Software, Supervision, Validation, Visualization, Writing–original draft, Writing–review and editing. CG: Conceptualization, Data curation, Formal Analysis, Funding acquisition, Investigation, Methodology, Project administration, Resources, Software, Supervision, Validation, Visualization, Writing–original draft, Writing–review and editing.
Funding
The author(s) declare that financial support was received for the research, authorship, and/or publication of this article. This work was funded and supported by Universidad Técnica Particular de Loja under grant No.: POA_VIN-56. This work was partially supported by LNF-INFN: Progetto HPSWFOOD Regione Lazio-CUP I35F20000400005.
Acknowledgments
CVG, MG, and TT wish to thank Escuela Superior Politécnica de Chimborazo for their hospitality during the completion of this work.
Conflict of interest
The authors declare that the research was conducted in the absence of any commercial or financial relationships that could be construed as a potential conflict of interest.
Generative AI statement
The author(s) declare that no Generative AI was used in the creation of this manuscript.
Publisher’s note
All claims expressed in this article are solely those of the authors and do not necessarily represent those of their affiliated organizations, or those of the publisher, the editors and the reviewers. Any product that may be evaluated in this article, or claim that may be made by its manufacturer, is not guaranteed or endorsed by the publisher.
Supplementary material
The Supplementary Material for this article can be found online at: https://www.frontiersin.org/articles/10.3389/fphy.2024.1503400/full#supplementary-material
References
1. Sharma A, Tiwari S, Deb MK, Marty JL. Severe acute respiratory syndrome coronavirus-2 (SARS-CoV-2): a global pandemic and treatment strategies. Int J Antimicrob Agents (2020) 56:106054. doi:10.1016/j.ijantimicag.2020.106054
2. Khodaie A, Heidarzadeh H. Evaluation of severe acute respiratory syndrome coronavirus 2 (SARS-CoV-2) using a high figure-of-merit plasmonic multimode refractive index optical sensor. Sci Rep (2024) 14:25499. doi:10.1038/s41598-024-77336-3
3. Fomenko A, Dähne T, Weibel S, Panning M, Grummich K, Schlesinger S, et al. Test accuracy of rapid diagnostic tests and reverse-transcription polymerase chain reaction against virus isolation in cell culture for assessing SARS-CoV-2 infectivity: systematic review and meta-analysis. Rev Med Virol (2024) 34:e2569. doi:10.1002/rmv.2569
4. Deshpande N, Suryawanshi PV, Tripathy S. Unveiling the quest: crafting an enzyme-linked immunosorbent assay (ELISA) technique to uncover COVID-19 antibodies. Cureus (2024) 16:e66659. doi:10.7759/cureus.66659
5. Pérez-López B, Mir M. Commercialized diagnostic technologies to combat SARS-CoV2: advantages and disadvantages. Talanta (2021) 225:121898. doi:10.1016/j.talanta.2020.121898
6. Brunetti G, Sasanelli N, Armenise MN, Ciminelli C. Nanoscale optical trapping by means of dielectric bowtie. Photonics (2022) 9:425. doi:10.3390/photonics9060425
7. Tene T, Bellucci S, Arias Arias F, Carrera Almendariz LS, Flores Huilcapi AG, Vacacela Gomez C. Role of graphene in surface plasmon resonance-based biosensors. Sensors (2024) 24:4670. doi:10.3390/s24144670
8. Tene T, Guevara M, Svozilík J, Coello-Fiallos D, Briceño J, Vacacela Gomez C. Proving surface plasmons in graphene nanoribbons organized as 2D periodic arrays and potential applications in biosensors. Chemosensors (2022) 10:514. doi:10.3390/chemosensors10120514
9. Aftab M, Mansha MS, Iqbal T, Farooq M. Surface plasmon excitation: theory, configurations, and applications. Plasmonics (2024) 19:1701–19. doi:10.1007/s11468-023-02095-2
10. Liu C, Lü J, Liu W, Wang F, Chu PK. Overview of refractive index sensors comprising photonic crystal fibers based on the surface plasmon resonance effect [invited]. Chin Opt Lett (2021) 19:102202. doi:10.3788/COL202119.102202
11. D'Agata R, Bellassai N, Spoto G. Exploiting the design of surface plasmon resonance interfaces for better diagnostics: a perspective review. Talanta (2024) 266:125033. doi:10.1016/j.talanta.2023.125033
12. Alsharari M, Wekalao J, Patel SK, Kumar UA, Aliqab K, Armghan A. Enhanced sensing efficiency of ultra-narrow band graphene-based surface plasmon resonance refractive index sensor for biochemical applications and environmental monitoring. Plasmonics (2024) 19:1701–19. doi:10.1007/s11468-024-02372-8
13. D'Agata R, Bellassai N, Jungbluth V, Spoto G. Recent advances in antifouling materials for surface plasmon resonance biosensing in clinical diagnostics and food safety. Polymers (2021) 13:1929. doi:10.3390/polym13121929
14. Bansal A, Srivastava SK. High performance SPR sensor using 2-D materials: a treatise on design aspects, material choice and figure of merit. Sensors Actuators A Phys (2024) 369:115159. doi:10.1016/j.sna.2024.115159
15. Tene T, Guevara M, Borja M, Mendoza Salazar MJ, Palacios Robalino Md.L, Vacacela Gomez C, et al. Modeling semiconducting silicene nanostrips: electronics and THz plasmons. Front Phys (2023) 11:1198214. doi:10.3389/fphy.2023.1198214
16. Dutta T, Yadav N, Wu Y, Cheng GJ, Liang X, Ramakrishna S, et al. Electronic properties of 2D materials and their junctions. Nano Mater Sci (2024) 6:1–23. doi:10.1016/j.nanoms.2023.05.003
17. Coello-Fiallos D, Tene T, Guayllas JL, Haro D, Haro A, Vacacela Gomez C. DFT comparison of structural and electronic properties of graphene and germanene: monolayer and bilayer systems. Mater Today Proc (2017) 4:6835–41. doi:10.1016/j.matpr.2017.07.011
18. Suvarnaphaet P, Pechprasarn S. Graphene-based materials for biosensors: a review. Sensors (2017) 17:2161. doi:10.3390/s17102161
19. Philip A, Kumar AR. The performance enhancement of surface plasmon resonance optical sensors using nanomaterials: a review. Coord Chem Rev (2022) 458:214424. doi:10.1016/j.ccr.2022.214424
20. Wu L, Chu HS, Koh WS, Li EP. Highly sensitive graphene biosensors based on surface plasmon resonance. Opt Express (2010) 18:14395–400. doi:10.1364/OE.18.014395
21. Hossain MM, Talukder MA. Graphene surface plasmon sensor for ultra-low-level SARS-CoV-2 detection. PLoS ONE (2023) 18:e0284812. doi:10.1371/journal.pone.0284812
22. Kumar A, Kumar A, Srivastava SK. Silicon nitride-BP-based surface plasmon resonance highly sensitive biosensor for virus SARS-CoV-2 detection. Plasmonics (2022) 17:1065–77. doi:10.1007/s11468-021-01589-1
23. Mudgal N, Saharia A, Choure KK, Agarwal A, Singh G. Sensitivity enhancement with anti-reflection coating of silicon nitride (Si3N4) layer in silver-based surface plasmon resonance (SPR) sensor for sensing of DNA hybridization. Appl Phys A (2020) 126:946. doi:10.1007/s00339-020-04126-9
24. Tene T, Svozilík J, Colcha D, Cevallos Y, Vinueza-Naranjo PG, Vacacela Gomez C, et al. The tunable parameters of graphene-based biosensors. Sensors (2024) 24:5049. doi:10.3390/s24155049
25. Pandey PS, Raghuwanshi SK, Kumar S. Recent advances in two-dimensional materials-based Kretschmann configuration for SPR sensors: a review. IEEE Sens J (2022) 22:1069–80. doi:10.1109/JSEN.2021.3133007
26. Baburin AS, Merzlikin AM, Baryshev AV, Ryzhikov IA, Panfilov YV, Rodionov IA. Silver-based plasmonics: golden material platform and application challenges [invited]. Opt Mater Express (2019) 9:611–25. doi:10.1364/OME.9.000611
27. Malik FK, Panteli C, Goel K, Moser N, Georgiou P, Fobelets K. Improved stability of graphene-coated CMOS ISFETs for biosensing. IEEE Trans Biomed Circuits Syst (2023) 17:1293–304. doi:10.1109/TBCAS.2023.3292002
28. Petralia S, Cosentino T, Sinatra F, Favetta M, Fiorenza P, Bongiorno C, et al. Silicon nitride surfaces as active substrate for electrical DNA biosensors. Sens Actuators B Chem (2017) 224:492–502. doi:10.1016/j.snb.2017.06.023
29. Tene T, Guevara M, Moreano G, Calderón E, Bonilla García N, Vacacela Gomez C, et al. Modeling plasmonics and electronics in semiconducting graphene nanostrips. Emerg Sci J (2023) 7:1459–77. doi:10.28991/ESJ-2023-07-05-01
30. Yadav PK, Upadhyay S, Kumar A, Chaurasia RN, Srivastava SK. A study of highly sensitive surface plasmon resonance biosensor for the detection of SARS-CoV-2 virus. Opt Quan Electron. (2024) 56:1663. doi:10.1007/s11082-024-07586-y
31. Halder S, Bhattacharyya D. RNA structure and dynamics: a base pairing perspective. Prog Biophys Mol Biol (2013) 113:264–83. doi:10.1016/j.pbiomolbio.2013.07.003
32. Cheon S, Kihm KD, Kim HG, Lim G, Park JS, Lee JS. How to reliably determine the complex refractive index (RI) of graphene by using two independent measurement constraints. Sci Rep (2014) 4:6364. doi:10.1038/srep06364
33. Jia Y, Li Z, Wang H, Saeed M, Cai H. Sensitivity enhancement of a surface plasmon resonance sensor with platinum diselenide. Sensors (2020) 20:131. doi:10.3390/s20010131
34. Lin Z, Chen S, Lin C. Sensitivity improvement of a surface plasmon resonance sensor based on two-dimensional materials hybrid structure in visible region: a theoretical study. Sensors (2020) 20:2445. doi:10.3390/s20092445
35. Bijalwan A, Singh BK, Rastogi V. Surface plasmon resonance-based sensors using nano-ribbons of graphene and WSe2. Plasmonics (2020) 15:1015–23. doi:10.1007/s11468-020-01122-w
36. Moznuzzaman M, Khan I, Islam MR. Nano-layered surface plasmon resonance-based highly sensitive biosensor for virus detection: a theoretical approach to detect SARS-CoV-2. AIP Adv (2021) 11:065023. doi:10.1063/5.0046574
37. Dey B, Islam MS, Park J. Numerical design of high-performance WS2/metal/WS2/graphene heterostructure based surface plasmon resonance refractive index sensor. Results Phys (2021) 23:104021. doi:10.1016/j.rinp.2021.104021
38. Mostufa S, Akib TBA, Rana MM, Mehedi IM, Al-Saggaf UM, Alsaggaf AU, et al. Numerical approach to design the graphene-based multilayered surface plasmon resonance biosensor for the rapid detection of the novel coronavirus. Opt Continuum (2022) 1(3):494–512. doi:10.1364/OPTCON.445255
39. Rahman MM, Abdulrazak LF, Ahsan M, Based MA, Rana MM, Anower MS, et al. 2D nanomaterial-based hybrid structured (Au-WSe2_22-PtSe2_22-BP) surface plasmon resonance (SPR) sensor with improved performance. IEEE Access (2022) 10:689–98. doi:10.1109/ACCESS.2021.3137420
40. Whitney AV, Elam JW, Zou S, Zinovev AV, Stair PC, Schatz GC, et al. Localized surface plasmon resonance nanosensor: a high-resolution distance-dependence study using atomic layer deposition. J Phys Chem B (2005) 109:20522–8. doi:10.1021/jp0540656
Keywords: surface plasmon resonance, graphene, silicon nitrite, SARS-CoV-2, biosensors
Citation: Tene T, Guevara M, Romero P, Guapi A, Gahramanli L and Vacacela Gomez C (2024) SARS-CoV-2 detection by surface plasmon resonance biosensors based on graphene-multilayer structures. Front. Phys. 12:1503400. doi: 10.3389/fphy.2024.1503400
Received: 28 September 2024; Accepted: 03 December 2024;
Published: 20 December 2024.
Edited by:
Maria Josè Lo Faro, University of Catania, ItalyReviewed by:
Giuseppe Brunetti, Politecnico di Bari, ItalyMaoqing Chen, Northeastern University, China
Copyright © 2024 Tene, Guevara, Romero, Guapi, Gahramanli and Vacacela Gomez. This is an open-access article distributed under the terms of the Creative Commons Attribution License (CC BY). The use, distribution or reproduction in other forums is permitted, provided the original author(s) and the copyright owner(s) are credited and that the original publication in this journal is cited, in accordance with accepted academic practice. No use, distribution or reproduction is permitted which does not comply with these terms.
*Correspondence: Cristian Vacacela Gomez, dmFjYWNlbGFAbG5mLmluZm4uaXQ=
 Talia Tene
 Marco Guevara
 Paul Romero3
 Lala Gahramanli
 Cristian Vacacela Gomez