- 1Nanjing Shanhai Engineering Technology Co., Ltd., Nanjing, China
- 2College of Transportation Engineering, Nanjing Tech University, Nanjing, China
- 3Jiangsu Earthquake Agency, Nanjing, China
- 4Seismic Safety Assessment Center, East-China Metallurgical Institute of Geology and Exploration, Hefei, China
The Huoshan region, located on the northern margin of the Dabie Orogenic Belt at the junction of the North China Plate and the Yangtze Plate, is one of the most seismically active and concentrated areas in the Dabie Orogenic Belt and adjacent regions. Utilizing the travel time data from 4,427 seismic events observed by 202 stations, we investigated the deep medium structure of the Huoshan region using the double-difference tomography method. The results reveal the medium structure and characteristics of mid-strong earthquake preparation in the region. The crustal medium in the study area exhibits significant lateral heterogeneity. The Dabie Orogenic Belt shows notably high velocity, whereas the North China Plate and the Yangtze Plate display relatively lower velocities. The Tan-Lu Fault Zone exhibits segmentation characteristics; with the crustal medium velocity south of Lujiang being relatively high, north of Jiashan being relatively low, and between Lujiang and Jiashan being intermediate. The epicenters of mid-strong earthquakes are located on the gradient zones of velocity and Poisson’s ratio. The source regions of these earthquakes show significant anomalies of high Poisson’s ratio and low S-wave velocity, which may indicate the presence of fluids. These anomalies possibly reflect the intrusion of deep materials along the fault zone, which could be the driving force for the preparation of mid-strong earthquakes.
1 Introduction
The Huoshan region (HSR), located on the northern margin of the Dabie Orogenic Belt (DOB) at the junction of the North China Plate (NCP) and the Yangtze Plate (YP), is one of the most seismically active and concentrated areas within the DOB and its surrounding regions. To date, four earthquakes of magnitude 6 or higher have occurred in Anhui Province, two of which were in the HSR: a magnitude 6 earthquake in 1,652 and a magnitude 6¼ earthquake in 1917. The fine structural characteristics, seismogenic environment, earthquake generation mechanisms, and earthquake prediction in the HSR have long been key areas of focus for researchers.
In recent years, numerous geophysicists have adopted diverse methodologies to deepen scientific inquiry in the HSR. Through the application of magnetotelluric techniques, Cui et al. (2020) [1] elucidated a three-dimensional electrical structure within the deep HSR. By integrating relocated minor earthquake data, they inferred that small seismic events predominantly arise along structurally weakened zones, with frequent shallow seismicity likely associated with fluid presence in the mid-lower crust, suggesting the region’s potential to host moderate to strong earthquakes exceeding magnitude 6. Zhang et al. (2012) [2] employed a multidisciplinary approach combining gravity, magnetics, electromagnetics, and seismology, revealing a deep structural regime along the northern Dabie Mountains characterized by southward subduction of the North China Block and a northward thrust of the North Huaiyang Tectonic Belt (NHTB)—an insight offering profound geological constraints on the collision dynamics between the NCP and South China Plate. Wang et al. (2024) [3] utilized the matched location method to detect small earthquakes in the Huoshan seismic window region, obtaining a more complete earthquake catalog and revealing the relationship between these small earthquakes and the Gushi M3.6 earthquake in 2018 and the Yingcheng M4.9 earthquake in 2019. Ambient noise tomography and body-wave tomography results revealed a widespread low-velocity anomaly in the lower crust to upper mantle beneath the HSR [4–8]. Researchers using double-difference location (LocDD) method have further delineated a concentrated, banded seismic distribution [9, 10], illuminating that the Xiaotian-Mozitan Fault and the Luo’erling-Tudiling Fault jointly govern seismic activity in Huoshan [11]. Focal mechanism analyses yielded fault plane parameters, highlighting a regional stress regime marked by east-west compression and north-south extension [12].
Nonetheless, existing findings remain limited by methodological differences, perspectives, and foundational data variability. Previous large-scale imaging results were limited by the low spatial resolution of the models [5–7, 13], while small-scale imaging primarily focused on the upper crustal velocity structure, lacking constraints on the middle and lower crustal velocity structures [14]. Therefore, conducting detailed studies on the P-wave and S-wave velocity structures and Poisson’s ratio in the HSR could provide important seismological constraints for understanding the deep seismogenic environment of the Huoshan earthquake swarm.
In this study, initial P-wave and S-wave arrival data from 4,427 seismic events spanning January 1998 to December 2021 were collected. Utilizing double-difference tomography (TomoDD) method, we constructed a high-resolution three-dimensional model of P-wave and S-wave velocities and Poisson’s ratio across the HSR, thereby elucidating the region’s crustal medium structure and the characteristics underlying moderate to strong earthquake genesis.
2 Geological background
The study area and its surrounding regions are divided by the NNE-trending Tan-Lu Fault Zone (F1), the near EW-trending Feixi-Hanbaidu Fault (F2), and the NE-trending Huaiyin-Xiangshuikou Fault (F6) into the NCP, the DOB, the YCP, and the Sulu Orogenic Belt. The HSR’s geological setting is distinct, located at the southern edge of the northeastern subsidence zone of the Dabie Mountains, near the Anhui-Hubei border. It also lies at the intersection of the DOB and fault F1.The HSR is segmented by several faults, including the NW-trending fault F2, the Meishan - Longhekou Fault (F3) and the Xiaotian-MoziTan Fault (F4), which intersect with the NE-trending Luo’erling-Tudiling Fault (F5) (Figure 1).
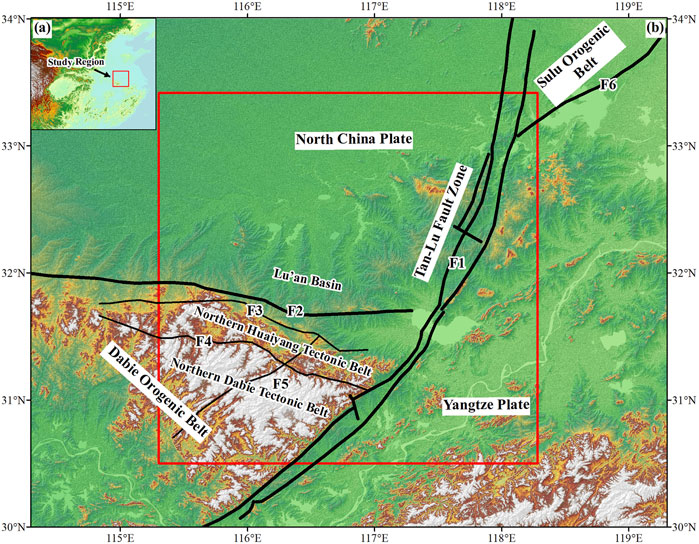
Figure 1. Geological structure background map. (A) Schematic diagram of the location of the study area, (B) Main structural units in and around the study area. The red rectangular box is the research area of this paper, and the black line represents the fault, F1: Tan-Lu Fault Zone, F2: Feixi-Hanbaidu Fault, F3: Meishan-Longhekou Fault, F4: Xiaotian-Mozitan Fault, F5: Luo’erling-Tudiling Fault, F6: Huaiyin - Xiangshuikou Fault.
Fault F4 serves as a boundary separating the North Dabie Tectonic Belt (NDTB) from the NHTB. This fault is an ancient deep fault zone that has significantly influenced the geomorphology and lithology of the region, with metamorphic rocks predominating to the south and sedimentary rocks to the north. Faults F2 and F3 separate the NHTB and the Lu’an Basin. Fault F2 primarily shows normal fault characteristics, classified as a pre-Quaternary fault, with strong activity during the Mesozoic and early Cenozoic periods. Fault F3 is primarily characterized by extensional tension, with significant tectonic deformation since the Cenozoic era. It mainly exhibits ductile slip activity and is an older fault that remains active today. Fault F5 traverses the NHTB and the Lu’an Basin in a northerly direction, exhibiting strong tectonic activity during the Neotectonic period. The most recent movement of this fault occurred in the Late Pleistocene [15]. Uneven basin-mountain development is observed on both sides of this fault. This unique geological background indicates that the HSR is a tectonic weak point, providing a favorable environment for the generation of tectonic earthquakes. It also suggests that the area is prone to frequent small to mid earthquakes, with large earthquakes being relatively rare [16].
3 Data and methods
3.1 Double-difference tomography method
The TomoDD method is a technique that simultaneously inverts for velocity structures and earthquake source parameters using both absolute and relative travel-time data [17, 18]. This method extends the LocDD method [19]. In the TomoDD method, the model is parameterized using a three-dimensional regular grid, with ray tracing and theoretical travel-time calculation performed using the pseudo-bending method. The inversion process is solved using the damped least squares algorithm [17, 18, 20]. The inversion results can be evaluated using model resolution experiments [21–23], DWS numerical methods or seismic ray density distribution [24], and checkerboard resolution tests [25, 26].
Considering spatial variations in medium velocity structures, TomoDD method employs absolute travel-time data to mitigate errors associated with the assumption of constant velocities between event pairs and stations, leading to more accurate location results. The velocity structure both within and outside the source region, along with the source locations, are determined using differential and absolute travel-time data, respectively [19]. By integrating relative and absolute travel-time data in a joint inversion, it is possible to obtain a more refined three-dimensional velocity structure and precise earthquake locations [27, 28]. In the inversion process, priority is first given to absolute travel-time data to establish absolute earthquake locations and large-scale velocity structures. Subsequently, emphasis is placed on differential travel-time data to refine the velocity structure within the source region and achieve precise earthquake localization [17, 18].
This study employs regional-scale the TomoDD method to calculate and obtain a more detailed three-dimensional velocity structure and precise earthquake locations within the study area. It further explores the relationships between geological structures, fault systems, and seismic activity in this area.
3.2 Data
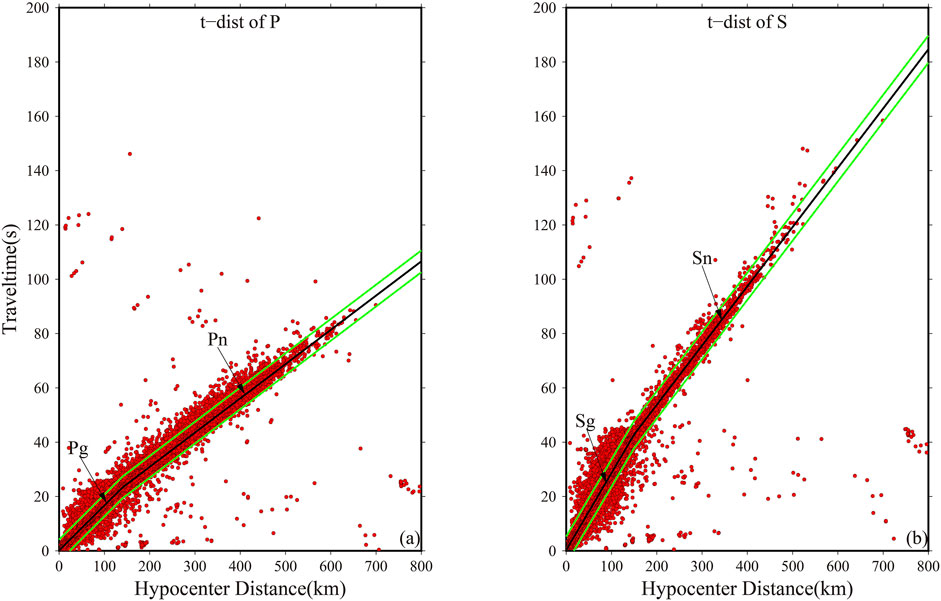
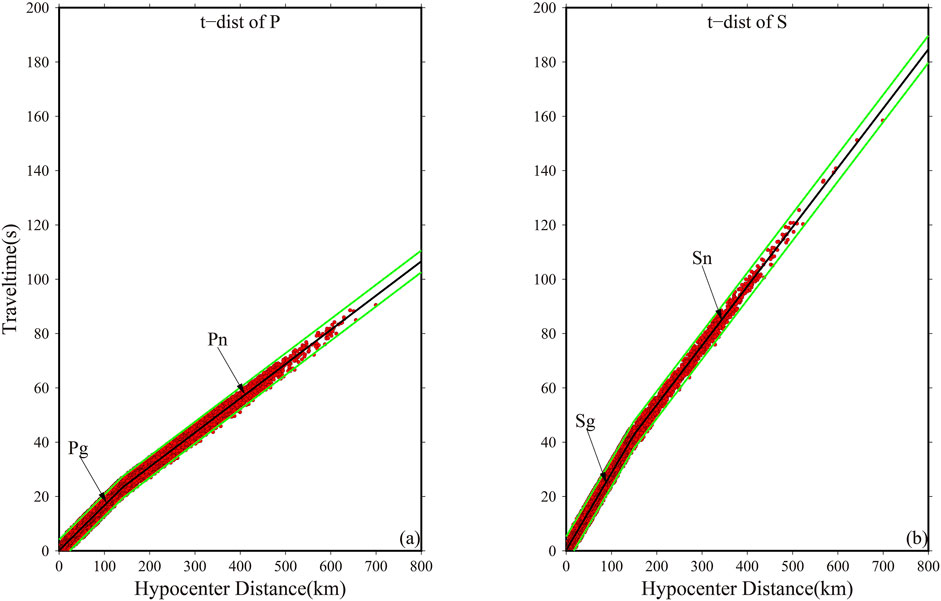
The study area for this paper is defined by the coordinates 30.5°N-33.416°N, 115.3°E−118.283°E. To achieve better seismic ray coverage across the study region, the data collection area was expanded to 29.5°N-34.416°N, 114.3°E−119.283°E. A total of 4,427 earthquake events were collected from January 1998 to December 2021, along with the P- wave and S-wave arrival time data from 202 seismic stations within this extended area. To enhance data quality and achieve more accurate velocity structures and earthquake locations, a rigorous selection of seismic phase data was conducted: (1) Earthquake events recorded by at least five stations were selected; (2) The distance between the earthquake and the station was restricted to no more than 800 km; (3) The maximum distance between earthquake pairs was set at 30 km, with a minimum of 10 km; (4) The required number of phases per earthquake pair ranged from 8 to 120; (5) The maximum number of neighbors for each earthquake was limited to 30. Seismic phase data with significant errors were removed based on the fitted travel-time curves [29]. The travel-time curves before and after data filtering are shown in Figures 2, 3. Ultimately, 4,007 effective earthquake events were selected from the initial 4,427 for joint inversion, yielding 52,465 absolute travel-time data points and 616,425 relative travel-time data points.
Figure 4 displays the distribution of earthquake events and stations after relocation using the TomoDD method. The majority of the relocated events are concentrated at depths of 5–15 km, predominantly within the upper to middle crust, which has significant tectonic implications. A strong correlation is observed between the distribution of small to mid earthquakes and fault structures. The distribution of seismic ray paths within the study area is shown in Figure 5, demonstrating that the study region has good ray path coverage.
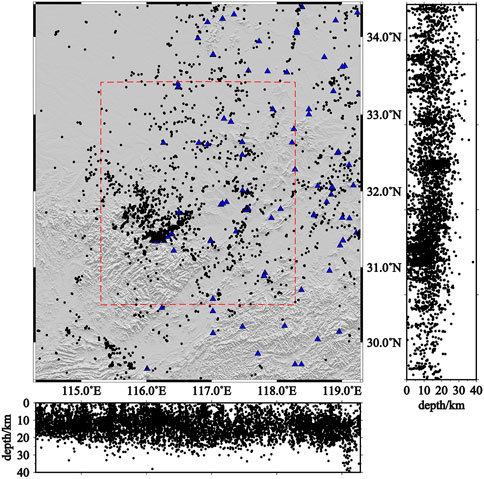
Figure 4. Distribution of seismic events and stations after location. The black dots represent the positions of the earthquakes after relocation, the blue triangles indicate the seismic stations, and the red dashed rectangular box outlines the study area.
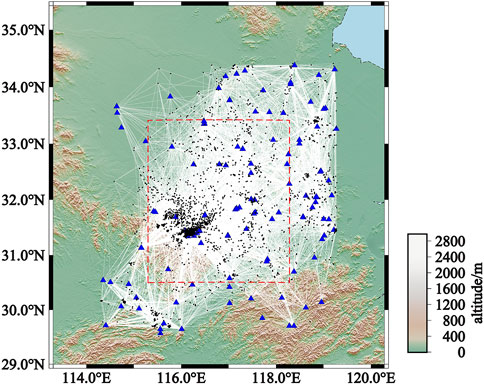
Figure 5. Distribution of earthquake, station and ray path. The black dots represent the positions of the earthquakes after relocation, the blue triangles indicate the seismic stations, the red dashed rectangular box outlines the study area, and the white lines depict the seismic ray paths.
3.3 Selection of the initial model and parameters
Tomographic inversion is highly sensitive to the initial model, making the selection of an appropriate model critical. In this study, we incorporated wide-angle reflection data and performed a comprehensive analysis based on the HQ13 artificial seismic sounding velocity profile, alongside the findings of Huang et al. (2011) [30] and Li et al. (2018) [31], to develop the initial 1D P-wave velocity model. The specific parameters are listed in Table 1, with a P-wave to S-wave velocity ratio set at 1.73. In this paper, the model was parameterized using a horizontal grid spacing of 0.25° × 0.25°, with vertical grid nodes set at the depths defined by the initial velocity model.
In the TomoDD method inversion, the solution is derived using the damped least squares algorithm, where smoothing and damping factors are incorporated to reduce the influence of data errors on the inversion results. These factors play a crucial role in controlling the stability of the inversion process [32]. The smoothing factor constrains the model’s slowness, while the damping factor simultaneously constrains both the slowness and the earthquake location parameters. If the smoothing and damping factors are set too low, the solution norm may become excessively large; conversely, if set too high, the data residual norm may increase significantly. In this study, the optimal smoothing and damping factors were determined to be 150 and 500, respectively, using the L-curve method [33, 34].
4 Tomography results
4.1 Model resolution test analysis
In this study, the reliability of the inversion results was evaluated using the checkerboard resolution test [35, 36]. This method involves introducing perturbations to the velocity values of each grid in the initial velocity model to create a perturbed 3D velocity model. The perturbed model is then used to generate synthetic travel times, which are inverted using the TomoDD method with the initial model as a reference. The extent to which the inversion recovers the perturbed model is then assessed. A successful checkerboard test, characterized by alternating positive and negative velocity anomalies, indicates good resolution and high reliability of the inversion results.
In this study, a 5% positive and negative velocity perturbation was applied for the checkerboard test. The results at various depths are presented in Figures 6, 7. As shown, the P-wave and S-wave models demonstrate good recovery at depths of 5–25 km, with high resolution across most areas, except for the northwest corner, where resolution is lower. At a depth of 33.9 km, the resolution is comparatively lower due to sparse seismic activity and reduced ray density. However, the upper mantle at 40 km depth exhibits higher ray density and resolution, as Pn and Sn waves predominantly travel through the uppermost mantle [37]. Overall, the resolution test results indicate good recovery across most regions and depths, confirming the relative reliability of the inversion results.
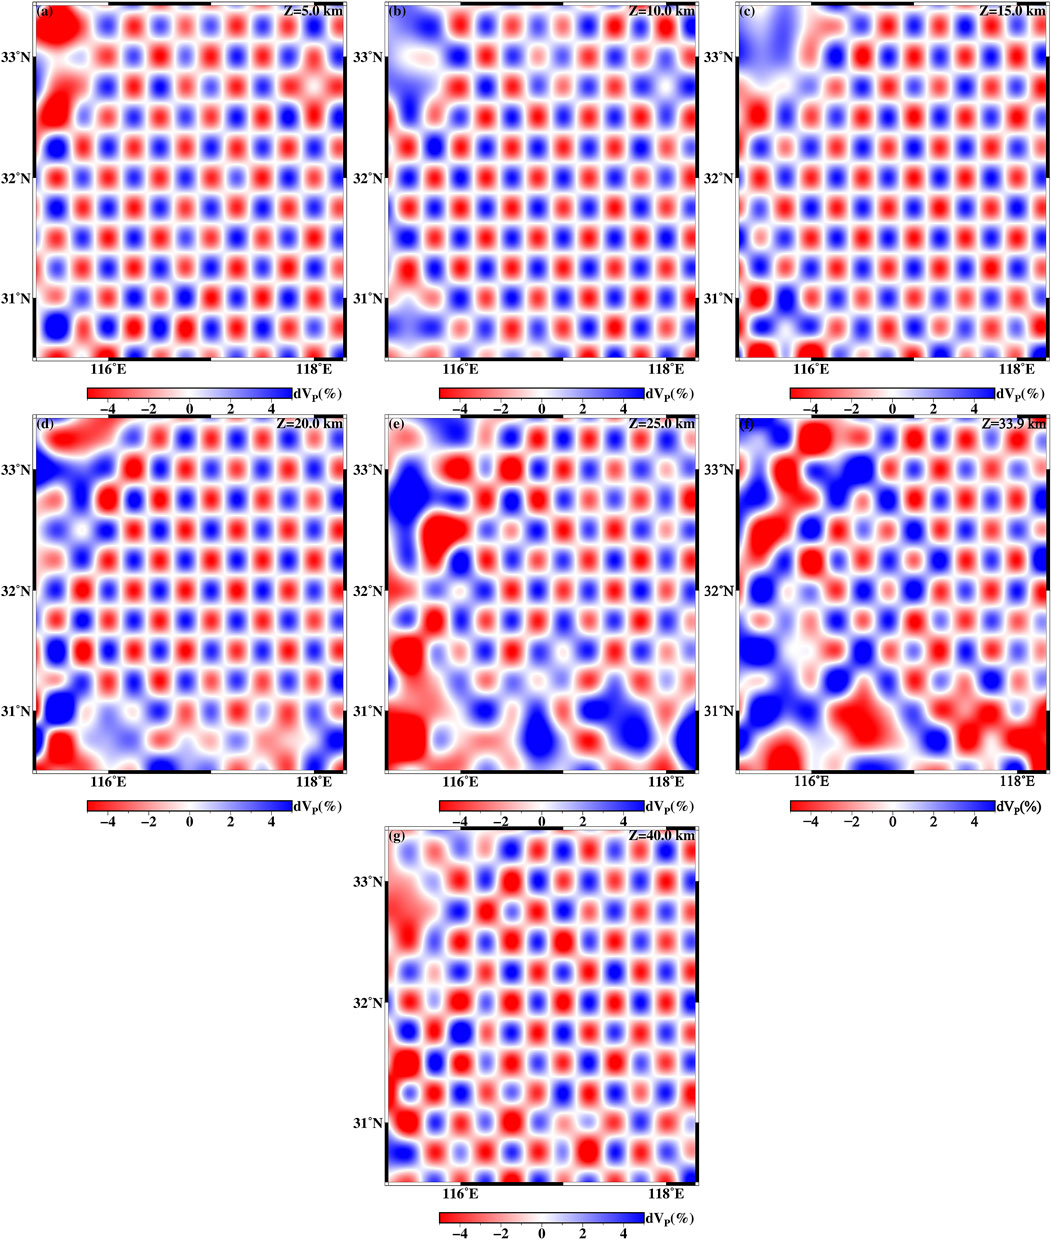
Figure 6. P-wave velocity imaging test board. (A) 5 km, (B) 10 km, (C) 15 km, (D) 20 km, (E) 25 km, (F) 33.9 km, (G) 40 km.
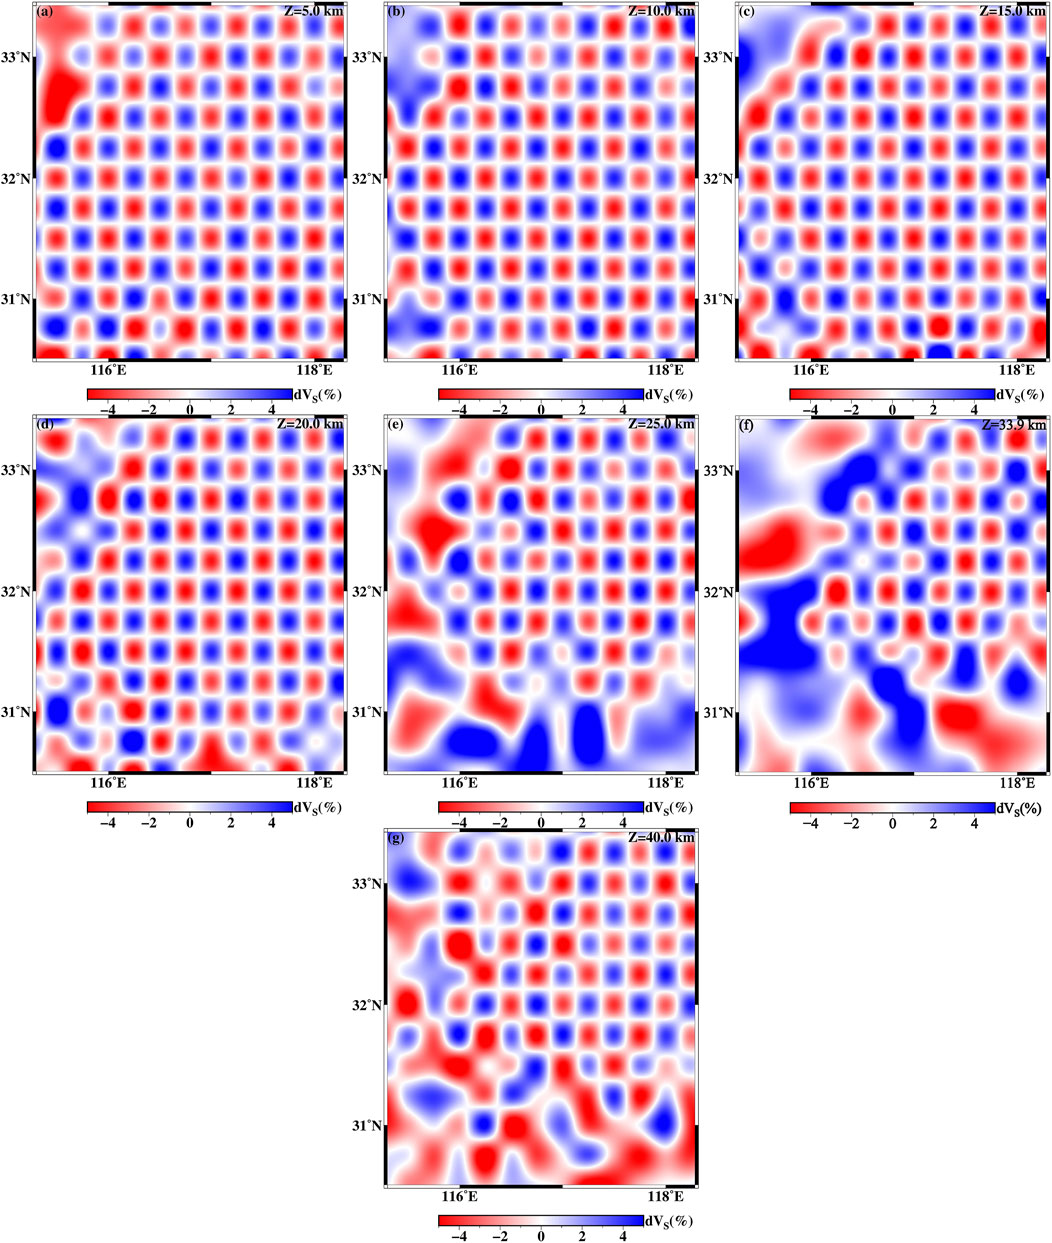
Figure 7. S-wave velocity imaging test board. (A) 5 km, (B) 10 km, (C) 15 km, (D) 20 km, (E) 2 5km, (F) 33.9 km, (G) 40 km.
4.2 Distribution characteristics of velocity and Poisson’s ratio
Figures 8–10 display the P-wave and S-wave velocity imaging results, as well as the Poisson’s ratio imaging results at various depths within the study area. In these figures, red circles represent historical earthquake epicenters, with the size of the circles indicating earthquake magnitude—the larger the circle, the greater the magnitude. Black line segments denote fault lines. The figures reveal significant lateral heterogeneity in the P-wave and S-wave velocity structures and Poisson’s ratio distribution in the crust and upper mantle of the study area. Additionally, the velocity and Poisson’s ratio distributions exhibit segmented characteristics along fault F1.
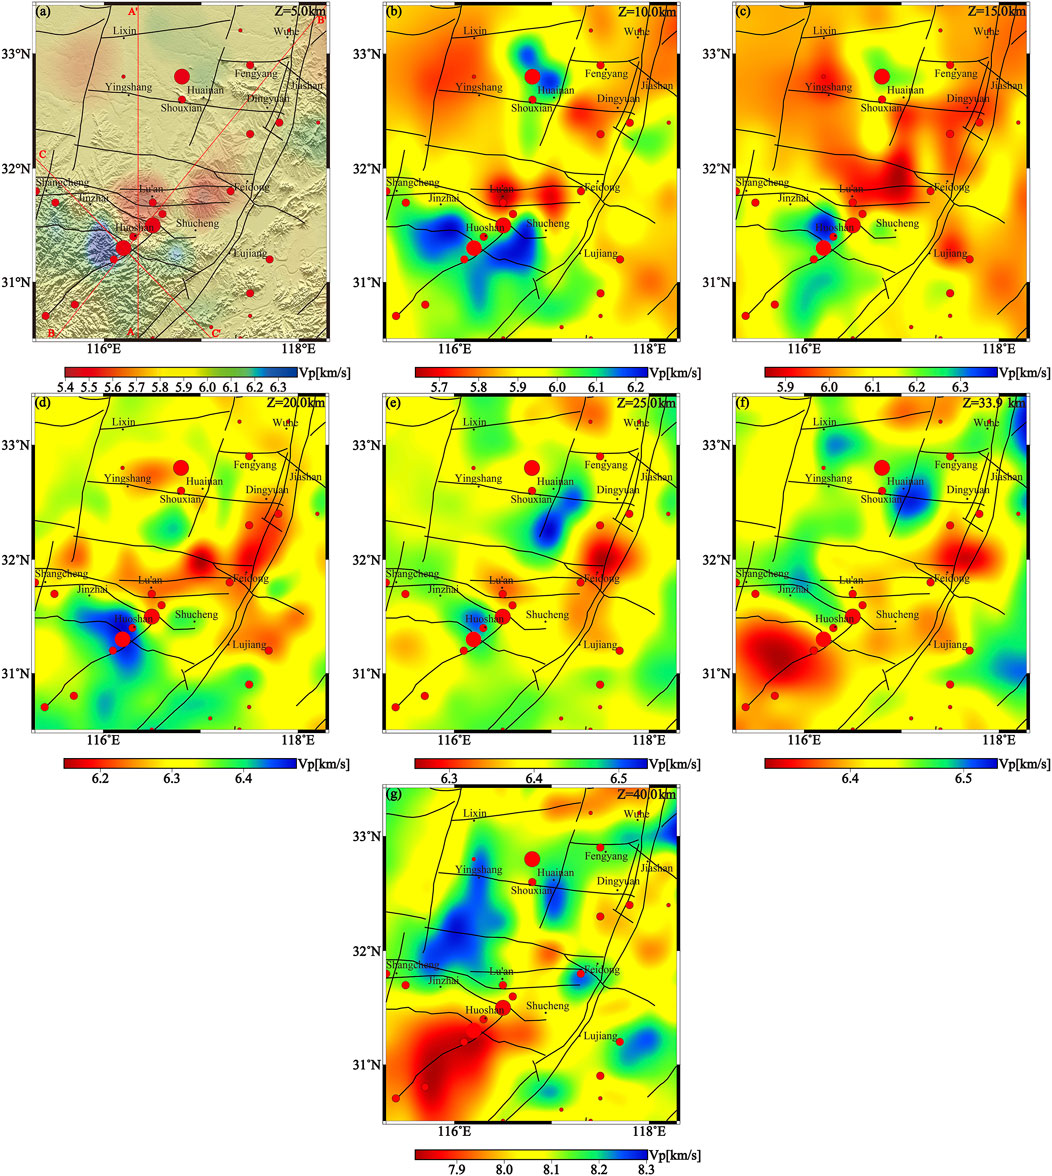
Figure 8. P-wave velocity structure imaging results at different depths. ((A) 5 km, (B) 10 km, (C) 15 km, (D) 20 km, (E) 25 km, (F) 33.9 km, (G) 40 km.
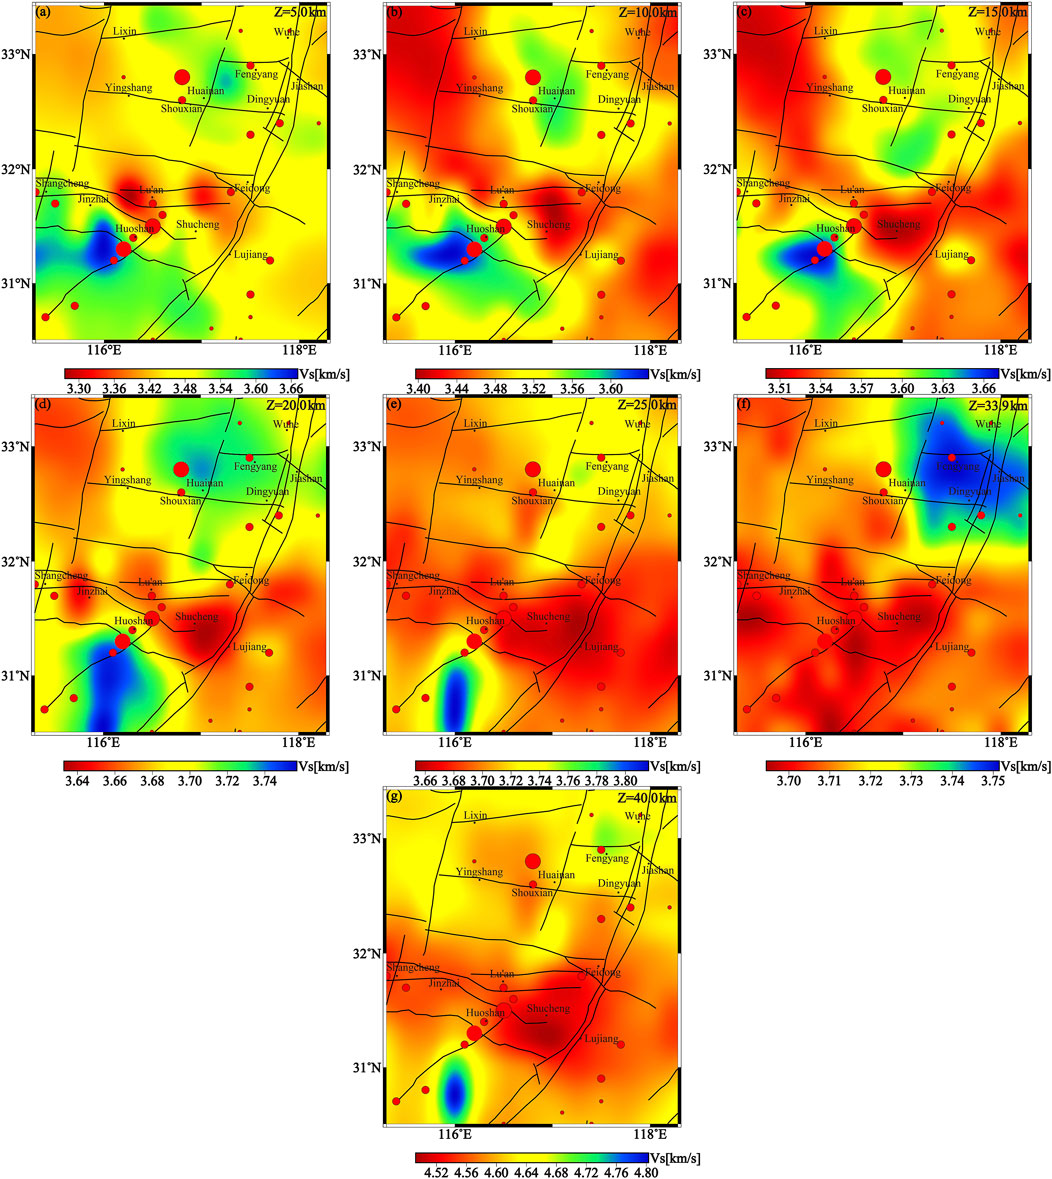
Figure 9. S-wave velocity structure imaging results at different depths. (A) 5 km, (B) 10 km, (C) 15 km, (D) 20 km, (E) 25 km, (F) 33.9 km, (G) 40 km.
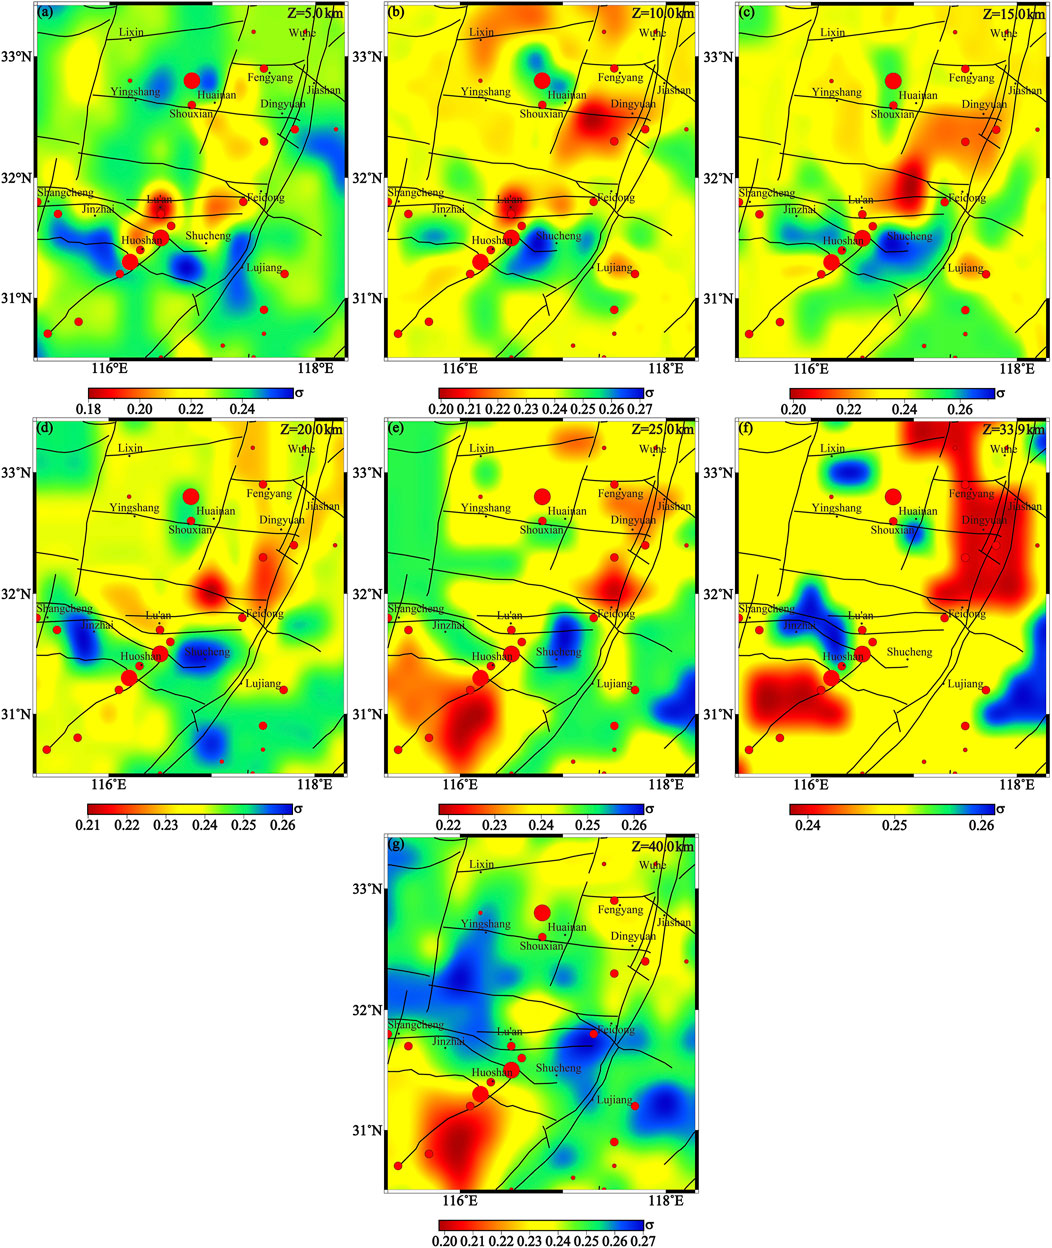
Figure 10. Poisson’s ratio structure imaging results at different depths. (A) 5 km, (B) 10 km, (C) 15 km, (D) 20 km, (E) 25 km, (F) 33.9 km, (G) 40 km.
The crust-mantle velocity structures of the DOB, the NCP, and the YP reveal marked lateral heterogeneity. The velocity structure of the middle to upper crust in the study area reveals distinct tectonic features. At depths of 5–10 km (upper crust) (Figures 8A, B), there are pronounced lateral variations in crustal velocity. The DOB displays relatively high velocities, whereas the NCP and the Lower YP exhibit comparatively lower velocities. At depths of 15–25 km (middle to lower crust) (Figures 8C–E, 9C–E), the region of high velocity in the DOB orogen significantly diminishes. Notably, at a depth of 25 km, the S-wave velocity reveals a marked low-velocity zone within the DOB (Figure 9E). Despite this, the overall velocity characteristics in the study area indicate that velocities in the DOB remain higher than those in the NCP and the Lower YP, suggesting a continuity in the velocity structure from the upper to the middle crust.
At depths of 33.9–40 km (lower crust to the upper mantle) (Figures 8F,G, 9F,G), the DOB transitions from a high-velocity to a low-velocity distribution. The NCP displays relatively high-velocity features compared to the DOB [38], which may be associated with significant thinning and disruption of the lithosphere in the eastern North China Craton due to Pacific Plate subduction since the Mesozoic and Cenozoic eras [39]. Besides the marked velocity differences between tectonic blocks, high and low-velocity anomalies are interspersed within the same block. These variations in velocity structures between and within plates suggest that different geological structures have undergone diverse tectonic evolutionary histories.
Fault F1, extending NNE-SSW across the study area, delineates the boundary between the NCP and the YP. The velocity structure from the upper crust to the top of the upper mantle exhibits pronounced lateral heterogeneity along fault F1 and its surrounding areas. The distribution of P-wave and S-wave velocities along the fault demonstrates a segmented pattern. Specifically, crustal velocities south of Lujiang are relatively high, while those north of Jiashan are relatively low, with the region between Lujiang and Jiashan exhibiting intermediate velocities. These results are consistent with findings from He et al. (2021) [7] based on body wave imaging. The observed segmentation of the crustal and mantle velocity structures along fault F1 is likely associated with its multi-phase tectonic activity and the movement of deep-seated materials [40].
Along the F1 (Figures 8, 9), at a depth of 5 km, the segmentation characteristics of P-wave and S-wave velocities are relatively consistent. At depths of 10–15 km, the segmentation of P-wave velocity becomes more pronounced, with relatively high velocities south of Lujiang, intermediate velocities between Lujiang and Jiashan, and relatively low velocities north of Jiashan. In contrast, S-wave velocities show relatively low values in the Feidong to Lujiang segment. At depths of 20–25 km, the velocity is generally higher north of Dingyuan compared to the south. At a depth of 33.9 km, the boundary roughly lies at Feidong, with slightly higher velocities in the Feidong region compared to the south, and more pronounced segmentation in S-wave velocity. At a depth of 40 km, the segmentation of S-wave velocity becomes more distinct, with the segmentation point around Dingyuan, where velocities are slightly higher in the northern segment compared to the south. The inconsistent distribution characteristics of P-wave and S-wave high-velocity anomalies may be related to the physical properties and the state of the medium within the crust [7]. The surface and subsurface structural morphology of fault F1 exhibits vertical spatial variations, indicating the complexity of its deep and shallow tectonic relationships.
Figures 4, 8 reveal that after relocation, the small to mid earthquakes are predominantly concentrated within the HSR, particularly around the intersection of the NW-trending fault F4 and the NE-trending fault F5. Historical seismic activity is primarily aligned along the NE-trending fault F5 in a banded distribution. The frequent and concentrated seismic activity in the HSR is likely closely related to the unique deep-seated structures in the region. Analyzing the underground velocity structure and Poisson’s ratio distribution is an effective method for studying the crustal and mantle medium structures.
The P-wave and S-wave velocities distribution results obtained in this study (Figures 8, 9) reveal significant lateral heterogeneity in the velocity structure of the HSR. At depths of 5–10 km, the NDTB shows high-velocity anomalies in both P-wave and S-wave structures, while the NHTB is located within a transition zone between high and low-velocity anomalies (Figures 8A,B, 9A,B). Faults F4 and F5 transect the high P-wave velocity region (Figures 8A,B, 9A,B), consistent with previous 3D body-wave imaging results [6–8, 13]. At a depth of 10 km, fault F5 is situated within a zone of relatively weak high P-wave velocity between two P-wave high-velocity anomalies (Figure 8B). At 5 km depth, the intersection of faults F4 and F5 is characterized by a weak low S-wave velocity anomaly (Figure 9A), supported by ambient noise tomography results from Li et al. (2023) [14], indicating that the upper crustal fault intersection zone has weak rock physical properties.
At depths of 15–25 km, the high-velocity regions in both the NDTB and the NHTB significantly reduce in size (Figures 8C–E, 9C–E), while the areas of high Poisson’s ratio gradually expand (Figures 10C–E). The P-wave low-velocity anomalies are primarily concentrated at a depth of 25 km (Figure 8E), with S-wave low-velocity anomalies extending upwards to 15 km (Figures 9C–E), aligning well with previous body-wave imaging [6, 8] and ambient noise tomography results [4, 5]. At 15 km, the F5 is situated within a weaker P-wave high-velocity zone between two prominent high-velocity anomalies (Figure 8C).
At depths of 33.9–40 km, the extent of low-velocity regions in both P-wave and S-wave structures increases in the NDTB and the NHTB, consistent with large-scale velocity imaging results [4–6, 8, 41]. Fault F4 lies along a P-wave velocity transitional zone, indicating that this fault likely extends deeply, reaching down to the Moho discontinuity.
Poisson’s ratio is a vital elastic parameter for elucidating the material composition of Earth’s interior, providing an essential basis for understanding earthquake nucleation mechanisms, especially in evaluating the role of crustal fluids in influencing seismic activity [42]. The sensitivity of Poisson’s ratio to chemical composition and the nature and degree of fluid content leads to the association of high Poisson’s ratio and low velocity anomalies (particularly low Vs.) with the presence of fluids such as water or partial molten materials [43]. Poisson’s ratio (σ) for the study region was derived from the calculated P-wave and S-wave velocities using the formula
At depths of 5–10 km (Figures 10A, B), high Poisson’s ratio anomalies align NW along fault F4 on either side of the fault intersection, while low Poisson’s ratio anomalies extend NE along fault F5. At a depth of 10 km, east of the fault junction, anomalies in high Poisson’s ratio (Figure 10B), high P-wave velocity (Figure 8B), and low S-wave velocity (Figure 9B) are observed, consistent with previous body-wave imaging results [44].
At depths of 15–25 km (Figures 10C–E), high Poisson’s ratios are prevalent in the NHTB, while the NDTB transitions from high to lower Poisson’s ratios. Fault F4 traverses a marked Poisson’s ratio gradient, effectively delineating the structural boundary. Fault F5 lies on a Poisson’s ratio gradient only at 15 km depth, implying that this fault may not extend to the middle-lower crust.
At depths of 33.9–40 km (Figures 10F, G), fault F4 is situated within a Poisson’s ratio transition zone, suggesting that it acts as a boundary fault separating the NDTB and the NHTB, extending deeply into the Moho [45, 46]. In the northwest sector of the convergence zone between faults F4 and F5, Poisson’s ratio is notably elevated compared to the northeast sector of the junction. The low S-wave velocity structure (Figures 9F, G) and heightened Poisson’s ratio (Figures 10F, G) on the northwest side extend upwards to approximately 15 km depth (Figures 9C–E and 10C, E), suggesting potential fluid involvement in the mid-to-lower crust of this region [47].
5 Discussionn
5.1 Earthquake, fault and velocity distribution relationship
To more intuitively demonstrate the variation of velocity and Poisson’s ratio structures with depth and their relationship to earthquake distribution, this paper selects three vertical profiles (locations shown in Figure 8A): Profile AA’ is located between the epicenters of the 1,652 Huoshan M6 earthquake and the 1917 Huoshan M6¼ earthquake; Profile BB’ passes through the earthquake cluster at the intersection of faults F4 and F5; and Profile CC’ passes through the epicenter of the 1917 Huoshan M6¼ earthquake. The imaging results of P-wave velocity, S-wave velocity, and Poisson’s ratio along these profiles are presented in Figures 11–13. In these figures, the solid black lines represent the fault projections in the profiles, inferred from the velocity or Poisson’s ratio structures combined with the relocated earthquakes. The red circles indicate the projections of the epicenters of the 1,652 Huoshan M6 earthquake and the 1917 Huoshan M6¼ earthquake on the profiles.
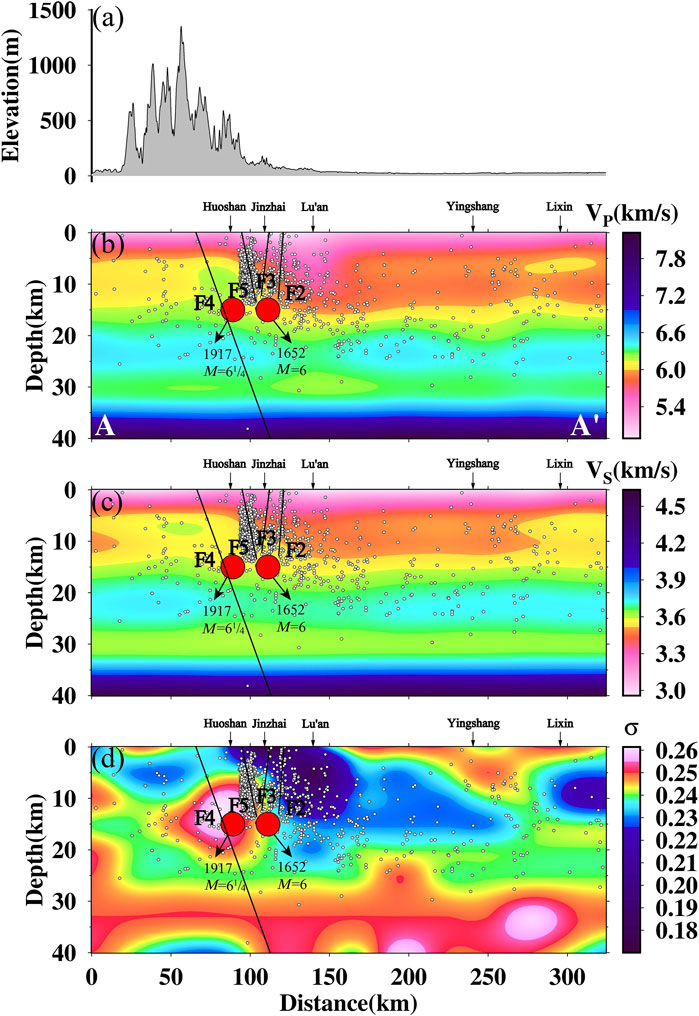
Figure 11. Elevation and imaging results along profile AA’, including P-wave, S-wave velocities, and Poisson’s ratio. (A) Elevation, (B) P-wave velocity, (C) S-wave velocity, (D) Poisson’s ratio.
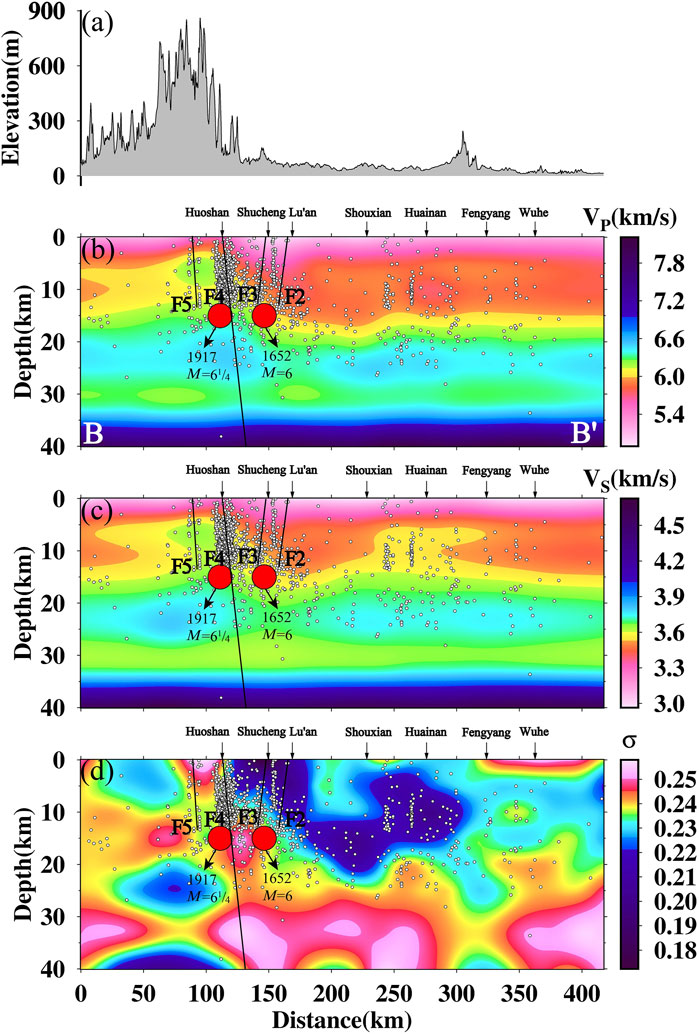
Figure 12. Elevation and imaging results along profile BB’, including P-wave, S-wave velocities, and Poisson’s ratio. (A) Elevation, (B) P-wave velocity, (C) S-wave velocity, (D) Poisson’s ratio.
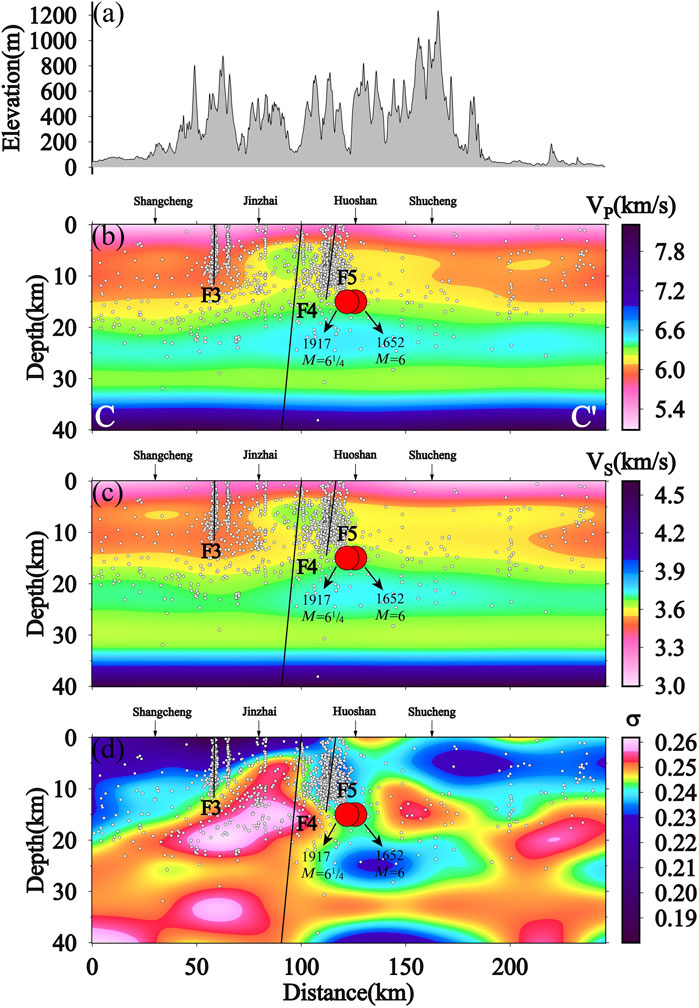
Figure 13. Elevation and imaging results along profile CC’, including P-wave, S-wave velocities, and Poisson’s ratio. (A) Elevation, (B) P-wave velocity, (C) S-wave velocity, (D) Poisson’s ratio.
In the AA′ profile (Figure 11), at depths of 5–25 km, high-velocity anomalies for both P-wave and S-wave, along with a high Poisson’s ratio, are observed beneath the NDTB and the NHTB, located between faults F4 and F5. Conversely, a weak low-velocity anomaly for P-wave and S-wave velocities and a weak low Poisson’s ratio structure are present beneath the NHTB between faults F3 and F5. Additionally, the Lu’an Basin at depths of 5–15 km exhibits low P-wave and S-wave velocities and a low Poisson’s ratio anomaly, indicating that the NCP has likely extended beneath the NHTB, north of fault F5. Earthquakes along the AA’ profile are primarily concentrated at depths of 5–15 km beneath faults F3 and F5, with the fault F3 acting as a boundary separating the high-velocity and high-Poisson’s ratio layers of the orogenic belt in the middle to upper crust from the low-velocity and low-Poisson’s ratio layers of the basin.
In the BB′ profile (Figure 12), the NDTB exhibits high-velocity anomalies for both P-wave and S-wave velocities at depths of 5–25 km, while the NHTB shows weak low-velocity anomalies for both P-wave and S-wave velocities. The Lu’an Basin, at depths of 5–15 km, is characterized by low P-wave and S-wave velocities, indicating that the NCP has extended beneath the NHTB, south of fault F3. At depths of 10–25 km beneath the NHTB, the P-wave velocity is relatively high, the S-wave velocity is relatively low, and the Poisson’s ratio is elevated, suggesting the presence of fluids in this region [48]. This high Poisson’s ratio anomaly is connected to a similar high Poisson’s ratio structure below 25 km depth, indicating that fault F4 likely extends down to the upper mantle [49]. This fault represents a typical zone of crustal weakness, providing a conduit for the upwelling of hot material from the mantle. The BB’ profile shows a concentration of earthquakes, primarily located beneath fault F4, at depths of 5–15 km. This fault acts as a boundary between the NDTB and the NHTB.
In the CC′ profile (Figure 13), high-velocity anomalies for both P-wave and S-wave velocities, along with high Poisson’s ratio structures, are observed beneath the NDTB and the NHTB at depths of 5–25 km. Conversely, at depths of 5–15 km beneath the NCP, low-velocity anomalies for both P-wave and S-wave velocities, along with low Poisson’s ratio anomalies, extend southward to the NHTB near fault F3. This suggests that the NCP has intruded beneath the NHTB, south of fault F3. Earthquakes in the CC’ profile are predominantly concentrated at depths of 5–15 km beneath fault F5. The relocated seismic events are primarily distributed in this depth range, with smaller earthquakes forming a linear distribution in the vertical direction, well-aligned with the fault structures. The high Poisson’s ratio structure beneath fault F4 extends from the lower crust through the upper mantle to the upper crust, indicating that this fault is a deep, major fault cutting through the Moho. Hot mantle material upwells along fault F4, intruding into the middle and upper crust, extending northward beneath fault F3 before tapering off (Figure 13D). The influence of fluid intrusion has resulted in a high concentration of seismic activity within the middle and upper crust between faults F3 and F4 (Figures 4, 13).
In Figures 11–13, the red circles represent the epicenters of the 1,652 Huoshan M6 earthquake and the 1917 Huoshan M6¼ earthquake. While the latitude and longitude of these epicenters can be obtained from historical earthquake catalogs, the focal depths are unknown. Based on the velocity-Poisson’s ratio structure, the relocation results of small to moderate earthquakes, and fault distribution, we infer that the focal depths of these two earthquakes are around 15 km. The inferred hypocenters are located near the gradient zones of velocity and Poisson’s ratio, and closer to structures characterized by high P-wave velocities, low S-wave velocities, and high Poisson’s ratios. This is corroborated by magnetotelluric results showing low resistivity and high conductivity in the mid-crust [1], which may indicate the presence of fluids [48]. These anomalous structures suggest that deep material intrusions along the fault zone may serve as a driving force for moderate to strong earthquake development [50], indicating that the Huoshan seismic area has the deep-seated conditions necessary for generating earthquakes of magnitude 6 or greater.
5.2 Analysis of formation of earthquake swarm and deep seismogenic environment
After earthquake relocation, seismic events are particularly concentrated on the northwest side of the intersection between faults F4 and F5 (Figures 4, 8). Under the influence of near east-west horizontal compression and north-south horizontal extensional regional stress, the rock mass along fault F4 is likely to be highly fractured, forming a tectonically weak zone within the Huoshan Seismic Area. When fault F4 intersects with fault F5, it exploits the pre-existing structural weakness of fault F4, where the fractured zone, influenced by external factors, becomes a region prone to stress release, leading to the concentration of small to mid earthquakes in this area [1]. Small to moderate earthquakes in the region are primarily distributed in the western segment of the intersection between faults F4 and F5. This concentration may be attributed to the gravitational sliding along fault F4 in the NHTB, which predominantly occurs in the western section of the NHTB [46].
Mid to strong earthquakes are primarily located within the tectonically weak zones at fault intersections. For instance, the 1,652 Huoshan M6 earthquake occurred near the intersection of faults F3 and F5, while the 1917 Huoshan M6¼ earthquake was located near the intersection of faults F4 and F5 (Figure 8). The epicenters of these mid to strong earthquakes are situated along zones of velocity and Poisson’s ratio gradients within the middle to upper crust (Figures 11, 13). Additionally, beneath these epicenters, there exists a high Poisson’s ratio structure extending from the middle and upper crust down to the lower crust and upper mantle. This suggests that high-temperature materials from the deep mantle have upwelled along the fault zones into the middle and upper crust. The strong crust-mantle interaction in this region, with the upwelling fluids, may represent the deep tectonic source for the 1,652 Huoshan M6 earthquake and the 1917 Huoshan M6¼ earthquake [50].
The spatial distribution of the Huoshan earthquake swarm is influenced by underlying deep-seated structures, which require corresponding explanations based on deep structural analyses. Previous research indicates that the deep dynamic background of the Huoshan earthquake swarm is closely related to the subduction interactions among the Tibetan Plateau, the NCP, the YP, and the Pacific Plate [51–53].
On one hand, velocity structures and anisotropy studies [54–57] confirm that tectonic movements at the southeastern margin of the Tibetan Plateau exert near east-west compressive stress on the DOB, resulting in the presence of east-west trending low-velocity material and fast wave directions in the upper mantle beneath the DOB. This may provide a source of fluids for the HSR.
On the other hand, the subduction of the YP beneath the NCP has led to the lithospheric thickening of the DOB. During the post-collision phase, this thickened lithosphere may undergo delamination, allowing asthenospheric material to upwell. The interaction between the upwelling mantle and partial melting of the middle and lower crust generates magma, which intrudes into the overlying crust, cooling to form high-velocity bodies in the middle crust [51, 52].
Additionally, high-velocity subducted slab segments lying flat in the transition zone beneath the Huoshan earthquake swarm, similar to those observed under the North China Craton, suggest that the formation of the Huoshan earthquake swarm is closely related to the westward subduction of the ancient Pacific Plate [58]. The combined influence of upwelling fluids from subduction and low-velocity material extruded from the Tibetan Plateau has made the Huoshan earthquake swarm region a convergence point of multiple deep dynamic processes, leading to the development of tectonic weak zones and consequently inducing seismic activity.
6 Conclusion
Drawing on arrival-time data for initial P-wave and S-wave from 4,427 seismic events recorded between January 1998 and December 2021, this study applies double-difference tomography to generate refined earthquake relocations, P-wave and S-wave velocity models, and Poisson’s ratio structures. This methodology significantly enhances the precision of earthquake localization and improves the resolution of velocity inversion. The study integrates the characteristics of velocity, Poisson’s ratio distribution, double-difference earthquake location results, and other data to analyze the relationship between regional velocity distribution and geological structures. It also examines the segmented velocity characteristics along fault F1 and investigates the causes of concentrated seismic distribution in the HSR, focusing on the deep seismogenic structures associated with moderate to strong earthquakes. The following results were obtained:
The crustal medium in the study area exhibits significant lateral heterogeneity. The DOB shows notably high velocity values, while the NCP and the YP exhibit relatively low values.
The crustal structure of fault F1 exhibits distinct segmentation, with relatively high velocity values south of Lujian, low values north of Jiashan, and intermediate values in the segment between Lujiang and Jiashan. This segmentation of the crust-mantle structure in fault F1 is related to its multiphase activity and the migration of deep materials.
Relocated seismic events are primarily concentrated in the HSR, particularly around the confluence of the faults F4 and F5. We suggest that, under regional tectonic stress, the active fault F5 exploits the structurally weakened zone created by the earlier fault F4. Deep fluids may migrate upward along these faults, reducing fault strength and encouraging earthquake clustering within this area.
The epicenters of mid-strong earthquakes are located on the gradient zones of velocity and Poisson’s ratio. The source regions of these earthquakes show significant anomalies of high Poisson’s ratio and low S-wave velocity, which may indicate the presence of fluids. These anomalies may indicate the presence of fluids in the earthquake source regions, suggesting that the intrusion of deep materials along the fault could be the driving force behind the generation of mid to strong earthquakes.
Data availability statement
The original contributions presented in the study are included in the article/supplementary material, further inquiries can be directed to the corresponding authors.
Author contributions
TH: Methodology, Software, Writing–original draft. XF: Conceptualization, Funding acquisition, Writing–review and editing. YH: Supervision, Validation, Writing–review and editing. LY: Data curation, Formal Analysis, Writing–review and editing. CY: Visualization, Writing–review and editing. PJ: Project administration, Writing–review and editing. ZL: Investigation, Writing–review and editing. ZX: Software, Writing–review and editing. MX: Validation, Writing–review and editing. YW: Validation, Writing–review and editing.
Funding
The author(s) declare that financial support was received for the research, authorship, and/or publication of this article. This study was supported by the National Natural Science Foundation of China (Grant No. 42104099 and 41874051) and Active Fault Detection and Seismic Risk Assessment in Lu’an City.
Conflict of interest
Authors TH, PJ and ZL were employed by Nanjing Shanhai Engineering Technology Co., Ltd.
The remaining authors declare that the research was conducted in the absence of any commercial or financial relationships that could be construed as a potential conflict of interest.
Generative AI statement
The author(s) declare that no Generative AI was used in the creation of this manuscript.
Publisher’s note
All claims expressed in this article are solely those of the authors and do not necessarily represent those of their affiliated organizations, or those of the publisher, the editors and the reviewers. Any product that may be evaluated in this article, or claim that may be made by its manufacturer, is not guaranteed or endorsed by the publisher.
References
1. Cui T, Chen X, Zhan Y, Zhao L, Liu Z. Characteristics of deep electrical structure and seismogenic structure beneath Anhui Huoshan earthquake area. Chin J Geophys (in Chinese) (2020) 63(01):256–69. doi:10.6038/cjg2019M0458
2. Zhang J, Yang X, Liu C, Zhang L, Li B, Xu Y, et al. The fine deep structure of the northern margin of the Dabie Orogenic Belt from gravity-magnetic-electrical-seismic combination survey. Chin J Geophys (in Chinese) (2012) 55(07):2292–306. doi:10.6038/j.issn.0001-5733.2012.07.015
3. Wang X, Zhou D, Li L, Zhang B, Liu J, Li J. Small earthquake detection in huoshan seismic window and its application in earthquake prediction. Earthquake (2024) 44(02):135–46. doi:10.12196/j.issn.1000-3274.2024.02.009
4. Luo S, Yao H, Li Q, Wang W, Wan K, Meng Y, et al. High-resolution 3d crustal s-wave velocity structure of the middle-lower yangtze river metallogenic belt and implications for its deep geodynamic setting. Sci China Earth Sci (2019) 62:1361–78. doi:10.1007/s11430-018-9352-9
5. Luo S, Yao H, Zhang Z, Bem TS. High-resolution crustal and upper mantle shear-wave velocity structure beneath the central-southern Tanlu Fault: implications for its initiation and evolution. Earth Planet Sci Lett (2022) 595:117763. doi:10.1016/j.epsl.2022.117763
6. Cui X, Song X, Xu L, Zhu Y, Li B, Zhang W. Three dimensional crustal P-wave structure beneath the central south segment of the Tanlu Fault Zone determined by local earthquake travel-time tomography. Terra Nova (2021) 33(6):613–20. doi:10.1111/ter.12553
7. He Y, Fan X, Zhao Q, Huo Z, Yang C, Zheng L, et al. Segmentation of crustal structure beneath the middle-south segment of tan-Lu Fault Zone. J Geophys (2021) 64(09):3164–78. doi:10.6038/cjg2021O0247
8. Sun Y, Wang H, Huang Y, Wang J, Jiang H, He Y, et al. Insight into seismotectonics of the central-south Tanlu Fault in east China from P-wave tomography. J Asian Earth Sci (2023) 258:105722. doi:10.1016/j.jseaes.2023.105722
9. Huang X, Yu J, Qi H, Zang B, Xia S, Han C. Precise relocation of small medium earthquakes in Anhui“Huoshan seismic window”. China Earthquake Eng J (2016) 38(02):236–41+48. doi:10.3969/j.issn.1000-0844.2016.02.0236
10. Zhu H, Lu D, Tao F, Ying Y, Zhou Z, Liu H, et al. Fine location of small and medium earthquakes in Huoshan window based on double difference method. Sci and Technology Inf (2020) 18(27):52–5. doi:10.16661/j.cnki.1672-3791.2007-5042-1804
11. Li L, Yao H, Li J, Zhang B, Wang X, Zhou D. High-resolution shallow crustal shear wave velocity structure in Huoshan and its relationship with seismicity. Seismological Geomagnetic Observation Res (2022) 43(S1):66–9. doi:10.1360/SSTe-2020-0106
12. Xu X, Wan Y, Meng G, Li X, Liu Z, He J. Study on three seismic fault segments and their sliding properties revealed by clustered seismic events in Huoshan area, Anhui Province. Chin J Geophys (in Chinese) (2022) 65(05):1688–700. doi:10.6038/cjg2022P0768
13. Zhang Y, Wang B, Xu T, Yang W, Wang W, Xu Y, et al. Three-dimensional crustal Vp and vs structures beneath the southern segment of the Tan-Lu Fault revealed by active source and earthquake data. Geophys J Int (2020) 223(3):2148–65. doi:10.1093/gji/ggaa314
14. Li L, Yao H, Zhang B, Li J, Shu P, Yang Y, et al. High resolution upper crustal velocity and seismogenic structure of the Huoshan “seismic window” in the Dabie orogenic belt. Front Earth Sci (2023) 11:1110061. doi:10.3389/feart.2023.1110061
15. Yao D, Liu J, Li J, Zhai H. Seismic activities and structures of the Liu'an-Huoshan seismic risk area. Seismology Geology (2003)(02) 211–9.
16. Zhang J, Yao D, Liu D, Shen Y, Shen X, Wang X. Prediction study on mid-long-term seismic risk zone in Anhui Province. In: Seismological and geomagnetic observation and research (2006). p. 29–39.
17. Zhang H, Thurber C. Double-Difference Tomography: the method and its application to the hayward fault, California. Bullseismolsocam (2003) 93(5):1875–89. doi:10.1785/0120020190
18. Zhang H, Thurber C. Development and applications of double-difference seismic tomography. Pure and Appl Geophys (2006) 163(2-3):373–403. doi:10.1007/s00024-005-0021-y
19. Felix W, William L. Ellsworth. A double-difference earthquake location algorithm: method and application to the northern hayward fault, California. Bull Seismological Soc America (2000) 90(6):1353–68. doi:10.1785/0120000006
20. Paige CC, Saunders MA. Algorithm 583: lsqr: sparse linear equations and least squares problems. ACM Trans Math Softw (Toms) (1982) 8(2):195–209. doi:10.1145/355993.356000
21. Thurber CH. Earthquake locations and three-dimensional crustal structure in the coyote lake area, central California. J Geophys Res Solid Earth (1983) 88(B10):8226–36. doi:10.1029/jb088ib10p08226
22. Lei J, Zhao D. Teleseismic evidence for a break-off subducting slab under eastern Turkey. Earth and Planet Sci Lett (2007) 257(1-2):14–28. doi:10.1016/j.epsl.2007.02.011
23. Lei J, Zhao D, Su J, Zhang G, Li F. Fine seismic structure under the Longmenshan fault zone and the mechanism of the large Wenchuan earthquake. Chin J Geophys (in Chinese) (2009) 52(02):339–45.
24. Hui S, Zhang Y, Li S. Study on the t-D earthquake location method. Northwest Earthquake J (2012) 34(01):10–3.
25. Junho U, Clifford T. A fast algorithm for two-point seismic ray tracing. Bull Seismological Soc America (1987) 77(3):972–86. doi:10.1785/BSSA0770030972
26. Humphreys E, Clayton RW. Adaptation of back projection tomography to seismic travel time problems. J Geophys Res Solid Earth (1988) 93(B2):1073–85. doi:10.1029/JB093iB02p01073
27. Okada T, Umino N, Matsuzawa T, Nakajima J, Uchida N, Nakayama T, et al. Aftershock distribution and 3d seismic velocity structure in and around the focal area of the 2004 mid niigata prefecture earthquake obtained by applying double-difference tomography to dense temporary seismic network data. Earth, planets and space (2005) 57(5):435–40. doi:10.1186/BF03351830
28. Yu X, Chen Y, Zhang H. Relocation of earthquakes in Beijing-Tianjin-Tangshan region with double-difference tomography technique. Acta Seismologica Sinica (2010) 32(03):257–69.
29. Xin H, Zhang H, Kang M, He R, Gao L, Gao J. High-resolution lithospheric velocity structure of continental China by double-difference seismic travel-time tomography. Seismological Res Lett (2019) 90(1):229–41. doi:10.1785/0220180209
30. Huang Y, Li Q, Zhang Y, Sun Y, Bi X, Jin S, et al. Crustal velocity structure beneath the Shandong-Jiangsu-Anhui segment of the Tancheng-Lujiang fault zone and adjacent areas. Chin J Geophys (in Chinese) (2011) 54(10):2549–59. doi:10.3969/j.issn.0001-5733.2011.10.012
31. Li X, Zhao Q, Zhu F, Hong M, Wang H. The study of 1d velocity model based on multi-phase joint inversion in jiangsu province. Earthquake Res China (2018) 34(02):312–21.
32. Eberhart-Phillips D. Three-dimensional velocity structure in northern California coast ranges from inversion of local earthquake arrival times. Bullseissocam (1986) 76(4):1025–52. doi:10.1785/BSSA0760041025
33. Hansen PC. Analysis of discrete ill-posed problems by means of the L-curve. Siam Rev (1992) 34(4):561–80. doi:10.1137/1034115
34. O’Leary DP, Hansen PC. The Use of the L-curve in the regularization of discrete ill-posed problems. SIAM J Scientific Comput (1993) 14(6):1487–503. doi:10.1137/0914086
35. Zhao D, Hasegawa A, Horiuchi S. Tomographic imaging of P and S wave velocity structure beneath northeastern Japan. J Geophys Res Solid Earth (1992) 97(B13):19909–28. doi:10.1029/92JB00603
36. Spakman W, van der Lee S, van der Hilst R. Travel-time tomography of the european-mediterranean mantle down to 1400 km. Phys Earth Planet Interiors (1993) 79(1-2):3–74. doi:10.1016/0031-9201(93)90142-V
37. Ma M, Zhao A. Double-difference tomography of crustal P-and S-wave velocity structures beneath north China. Acta Seismologica Sinica (2021) 43(01):13–33+136. doi:10.11939/jass.20200062
38. Yao Z, Eric S, Wang C, Ding Z, Chen Y. Asthenospheric upwelling beneath northeastern margin of ordos block: constraints from Rayleigh surface-wave tomography. Tectonophysics (2020) 790:228548. doi:10.1016/j.tecto.2020.228548
39. Chen L, Tao W, Zhao L, Zheng T. Distinct lateral variation of lithospheric thickness in the northeastern north China craton. Earth Planet Sci Lett (2008) 267(1-2):56–68. doi:10.1016/j.epsl.2007.11.024
40. Li C, Yao H, Yang Y, Luo S, Wang K, Wan K, et al. 3-D shear wave velocity structure in the shallow crust of the Tan-Lu fault zone in Lujiang, Anhui, and adjacent areas, and its tectonic implications. Earth Planet Phys (2020) 4(3):1–12. doi:10.26464/epp2020026
41. Lu H, Lei J, Zhao D. Uppermost mantle structure and dynamics of the Tanlu fault zone: new insights from Pn anisotropic tomography. J Asian Earth Sci (2024) 268:106170. doi:10.1016/j.jseaes.2024.106170
42. Zhao D, Kanamori H, Negishi H, Wiens D. Tomography of the source area of the 1995 Kobe earthquake: evidence for fluids at the hypocenter? Science (1996) 274(5294):1891–4. doi:10.1126/science.274.5294.1891
43. Wang Z, Jin Z, Lin J. Slab melting and arc magmatism behind the Japan Trench: evidence from seismic and thermal structure imaging. Tectonophysics (2022) 833:229340. doi:10.1016/j.tecto.2022.229340
44. Ji G, Lei J, Zhao D. Three-dimensional crustal veloeity structure and seismogenic environment arund the Huoshan earthquake swarm. Seismology Geology (2024) 46(3):665–85. doi:10.3969/j.issn.0253-4967.2024.03.009
45. Lin W, Michel F, Wang Q. Tectonic evolution of the Dabieshan orogen: in the view from polyphase deformation of the Beihuaiyang metamorphic zone. Sci China Ser D: Earth Sci (2005) 48(7):886. doi:10.1360/03YD0306
46. Xiang B, Wang Y, Li C, Zhu G, Shi Y. Evolution of the Xiaotian-Mozitan fault and its implications for exhumation of Dabie HP–UHP rocks. Prog Nat Sci (2008) 18(06):713–22. doi:10.1016/j.pnsc.2007.11.020
47. Lei J, Zhao D. Structural heterogeneity of the Longmenshan fault zone and the mechanism of the 2008 Wenchuan earthquake (Ms 8.0). Geochem Geophys Geosystems (2009) 10(10). doi:10.1029/2009GC002590
48. Wang Q, Hawkesworth CJ, Wyman D, Chung S-L, Wu F, Li X, et al. Pliocene-Quaternary crustal melting in central and northern Tibet and insights into crustal flow. Nat Commun (2016) 7(1):11888. doi:10.1038/ncomms11888
49. Yuan X, Klemperer SL, Teng W, Xiang L, Chetwin E. Crustal structure and exhumation of the Dabie Shan ultrahigh-pressure orogen, eastern China, from seismic reflection profiling. Geology (2003) 31:435–8. doi:10.1130/0091-7613(2003)031<0435:csaeot>2.0.co;2
50. Tang Y, Weng A, Yang Y, Li S, Niu J, Zhang Y, et al. Connection between earthquakes and deep fluids revealed by magnetotelluric imaging in Songyuan, China. Sci China Earth Sci (2021) 64(1):161–76. doi:10.1007/s11430-019-9633-y
51. Zhao Z, Zheng Y. Remelting of subducted continental lithosphere: petrogenesis of Mesozoic magmatic rocks in the Dabie-Sulu orogenic belt. Sci China Ser D: Earth Sci (2009) 52(9):1295–318. doi:10.1007/s11430-009-0134-8
52. Liu S-A, Li S, Guo S, Hou Z, He Y. The Cretaceous adakitic–basaltic–granitic magma sequence on south-eastern margin of the North China Craton: implications for lithospheric thinning mechanism. Lithos (2012) 134-135:163–78. doi:10.1016/j.lithos.2011.12.015
53. Liao P, Wang X, Hong D, Li L, Wang J. Dynamic backgrounds of the “huoshan seismic window” and its implications. Earthquake Res China (2014) 30(04):534–42.
54. Lei J, Li Y, Xie F, Teng J, Zhang G, Sun C, et al. .P Pn anisotropic tomography and dynamics under eastern Tibetan plateau. J Geophys Res Solid Earth (2014) 119(3):2174–98. doi:10.1002/2013JB010847
55. Lei J, Zhao D. Teleseismic P-wave tomography and mantle dynamics beneath Eastern Tibet. Geochem Geophys Geosystems (2016) 17(5):1861–84. doi:10.1002/2016GC006262
56. Sun A, Zhao D. Anisotropic tomography beneath Northeast Tibet: evidence for regional crustal flow. Tectonics (2020) 39(7):e2020TC006161. doi:10.1029/2020TC006161
57. Yu Y, Chen YJ, Feng Y, An M, Liang X, Guo Z, et al. Asthenospheric flow channel from northeastern tibet imaged by seismic tomography between Ordos Block and Yangtze Craton. Geophys Res Lett (2021) 48(17):e2021GL093561. doi:10.1029/2021GL093561
Keywords: Huoshan region, seismogenic environment, double-difference tomography, deep fluids, crustal structure
Citation: Hu T, Fan X, He Y, Yang L, Yang C, Jiang P, Liu Z, Xia Z, Xu M and Wu Y (2024) Velocity structure of crust and mid-strong earthquake preparation characteristics in the Huoshan region, East China. Front. Phys. 12:1502248. doi: 10.3389/fphy.2024.1502248
Received: 26 September 2024; Accepted: 06 November 2024;
Published: 25 November 2024.
Edited by:
Yifei Sun, Taiyuan University of Technology, ChinaCopyright © 2024 Hu, Fan, He, Yang, Yang, Jiang, Liu, Xia, Xu and Wu. This is an open-access article distributed under the terms of the Creative Commons Attribution License (CC BY). The use, distribution or reproduction in other forums is permitted, provided the original author(s) and the copyright owner(s) are credited and that the original publication in this journal is cited, in accordance with accepted academic practice. No use, distribution or reproduction is permitted which does not comply with these terms.
*Correspondence: Xiaoping Fan, bmpfZnhwQG5qdGVjaC5lZHUuY24=; Yicheng He, aHlja2V2aW5AbWFpbC51c3RjLmVkdS5jbg==
 Tiantian Hu
 Xiaoping Fan2*
 Yicheng He