- 1School of Electronic and Information Engineering, University of Science and Technology Liaoning, Anshan, Liaoning, China
- 2School of Business Administration, University of Science and Technology Liaoning, Anshan, Liaoning, China
- 3Asset Company, University of Science and Technology Liaoning, Anshan, Liaoning, China
- 4School of Economics and Management, Dalian Jiaotong University, Dalian, Liaoning, China
Traffic congestion is a serious problem faced by many cities worldwide today. Congestion warning information is one of the important influencing factors of urban road congestion; To this end, based on the dynamics of infectious diseases, a congestion warning information dissemination model considering the attitudes of travelers and the network structure was constructed. The existence and stability of the equilibrium points of non congestion warning information and congestion warning information in the model were analyzed, and the optimal control strategy of the model was proposed. Numerical simulation was conducted to verify the results of theoretical analysis, simulate and analyze the impact of changes in various parameters in the model on the dissemination of congestion warning information, and perform sensitivity analysis on several parameters. The results indicate that travelers are more inclined towards “fast” modes of transportation and have a stronger willingness to share congestion warning information. The dissemination range of warning information is wider, which can play a positive role in reducing traffic congestion pressure.
1 Introduction
With the rapid development of the urban economy, urban traffic congestion has brought many inconveniences to people’s travel, and alleviating the pressure of urban traffic congestion has become an important task that urgently needs to be solved in the development of many cities around the world. The dissemination of road congestion warning information is an important way to prevent and control urban congestion [1]. The attitude of travelers toward congestion warning information can affect the dissemination process of warning information to some extent, thereby affecting the degree of urban traffic congestion. Therefore, It is necessary to explore the dissemination mechanism of congestion warning information considering the attitude of travelers and propose corresponding optimization strategies.
In recent years, urban road congestion warning information has been disseminated among users through social networks and navigation apps, providing travel plans for travelers and alleviating the pressure of urban traffic congestion. Scholars from different fields have conducted numerous studies on congestion warning information. Ahmad et al. proposed a novel detection scheme (IVCD) to support the propagation of congestion information that is about to occur on all roads in its coverage area [2]. Many scholars began discussing the application of space supply chain in transportation many years ago [3–9]. Yilmaz et al. proposed an urban traffic monitoring system that utilizes participatory sensing and cloud messaging capabilities and can issue warnings or suggestions to drivers near congested roads or on the route [10]. Online sharing of congestion warning information is an effective way to quickly spread congestion information. Travelers can make timely choices and change routes, which is beneficial for controlling vehicle diversion. Yang et al. proposed the concept of an event consistency proof suitable for vehicle networks and introduced two-stage transactions on the blockchain to send warning messages in appropriate regions and time periods [11]. Shi et al. proposed a framework for a physically informed spatiotemporal graph convolutional neural network (PSTGCN) based on the theory of physically informed deep learning to estimate congestion warning information [12]. Ning et al. proposed the traffic warning message dissemination system (TWMDS) framework, which allows travelers to quickly rebuild their travel paths to alleviate traffic congestion [13]. Humayun et al. promotes dissemination by using roadside message proxies to provide real-time traffic information about traffic congestion and unexpected traffic events [14]. Jiang et al. proposed an innovative early traffic congestion warning system to monitor and plan traffic conditions [15]. The above discussion describes the research conducted by scholars on how to develop and send a complete set of congestion warning information, indicating the importance of congestion warning information for urban traffic management.
There are lots of studies in transportation areas to discuss the value of information, Zhang et al. developed a day-to-day route-choice learning model with friends’ travel information [16]. Chen et al. presented a model of a social network-based attitude diffusion system in the context of activity and travel choice behavior [17]. Yu et al. investigated the welfare effects of inaccurate pre-trip information on commuters’ departure time choice under stochastic bottleneck capacity in the morning commute [18]. Han et al. experimentally investigated how routing advice influenced strategic uncertainty and analyzed compliance behavior and decision time that might affect strategic uncertainty [19].
The dissemination of congestion warning information is strongly influenced by travelers’ psychological perceptions of congestion status. Many scholars have studied the attitudes of travelers toward road congestion. Khoo et al. believes that the choice of travel route is directly related to drivers’ sensitivity to congestion and that changing the travel route is positively correlated with the degree of road congestion [20]. Huang et al. quantified drivers’ response to congestion warning information and the traffic congestion mitigation effect based on congestion warning information [21]. Zhou et al. proposed that traffic congestion can be spread among people or through public media, leading to the interactive dissemination of warning information in the network [22]. Huang et al. considered two states in the warning information network, travelers receiving warning information and travelers not receiving warning information, and studied the impact of travelers’ behavioral characteristics when facing warning information on the spread of congestion risk [23]. The warning information is divided into two types: “fast speed” and “short distance”. These two types of warning information can lead travelers to make different travel decisions. The impact of various warning information, such as “fast speed” and “short distance”, on traffic congestion pressure should be analyzed [24].
From the perspective of research methods, because the dissemination process of urban congestion warning information is similar to that of infectious diseases, infectious disease models can be widely applied to analyze various transmission mechanism problems. Saberi et al. (2020) described the dynamic process of urban traffic congestion transmission and dissipation based on the susceptibility infection recovery (SIR) model and monitored, predicted, and controlled the status of urban traffic congestion [25]. Jia et al. proposed an improved susceptible infected susceptible (SIS) congestion propagation model to estimate the probability of congestion risk (RPC) in subway networks [26]. Chen et al. established an urban traffic congestion propagation model based on the SIS propagation theory to study the mechanism and characteristics of urban traffic congestion propagation [27]. For example, Ma et al. established a new UAU-SEIR (Unaware Aware Unaware Susceptible Exposed Infected Recovered) model to study the impact of individual and mass media information dissemination on epidemic transmission [28]. She et al. constructed an SIS model to study the mutual influence between the spread of epidemics and the spread of opinions on the network [29]. Nian et al. explored the propagation patterns of public opinion in social networks based on the susceptible exposed infected recovered (SEIR) model and conducted empirical research on the relationships among rumor propagation, user characteristics, and differences in subject interests. The authors also analyzed the common effects of individual factors and the social environment [30]. Ojha et al. developed a model based on epidemiological methods for detecting and controlling false information propagation in OSNs [31].
In summary, most of the current research has focused on developing congestion warning information and controlling the spread of urban traffic congestion, with little research on the dissemination patterns of congestion warning information. Some studies have also considered the impact of congestion warning information on urban traffic congestion but have considered only two states: each traveler received or did not receive warning information. In addition, when network platforms push warning information, they directly push “fast” and “short distance” messages without considering that travelers’ attitudes toward congestion directly affect the dissemination of congestion warning information. Therefore, to better predict and control the dissemination process of congestion warning information, it is necessary to consider the impact of network topology characteristics and complex user behavior characteristics on the dissemination process of congestion warning information in the social network. In view of this, this article divides travelers into ignorant, negative, positive, disseminator, and immune individuals based on the classic infectious disease SIR model and considers the structural characteristics of the congestion warning information dissemination network to construct a congestion warning information dissemination model to more accurately and reasonably describe the dynamic laws of congestion warning information dissemination in social networks.
The remainder of this article is organized as follows: In the section on model construction, a congestion warning information dissemination model (SPEIR model) is constructed by considering the attitudes of travelers toward road congestion. In the section on model analysis, the basic regeneration number of the model is calculated, and the stability of no congestion warning information and the presence of congestion warning information are analyzed. In the section on the optimal control model, the optimal control model is constructed, and the optimal control strategy is proposed. In the numerical simulation section, the stability analysis in the previous section is simulated and verified, and the impact of parameter changes on the propagation process of congestion warning information is simulated. A sensitivity analysis of the parameters is conducted, and numerical simulations are conducted on the optimal control strategy. The conclusion section provides a summary of the entire article and highlights its limitations.
2 Materials and methods
The model constructed in this article is based on the classic SIR model, assuming that congestion warning information propagates in a mixed uniform network with nodes, each node represents a user in the social network, and the total number of nodes is variable. The information can be divided into 5 categories: (1) Ignorant, which refers to the group of people who have not been exposed to congestion warning information but are easily receptive to it, denoted as
In a social system, the number of users on social networks dynamically changes over time. Therefore, this article assumes that the number of people joining social networks per unit of time is
When the ignorant individuals receive the congestion warning information, if they are willing to share congestion warning information with other users, they will transform into distributors with probability
Although passive individuals are not sensitive to traffic congestion, if they are willing to share congestion warning information with others, they will transform into distributors based on probability
In addition, the impact of network structure on the dissemination process of congestion warning information should be considered. If each social network user is viewed as a node in the network and the connections between users are viewed as edges between nodes, then the social network can be represented as a directed graph
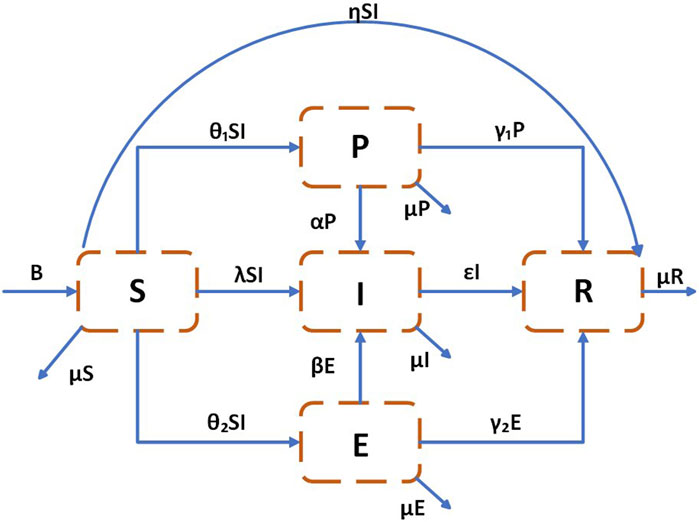
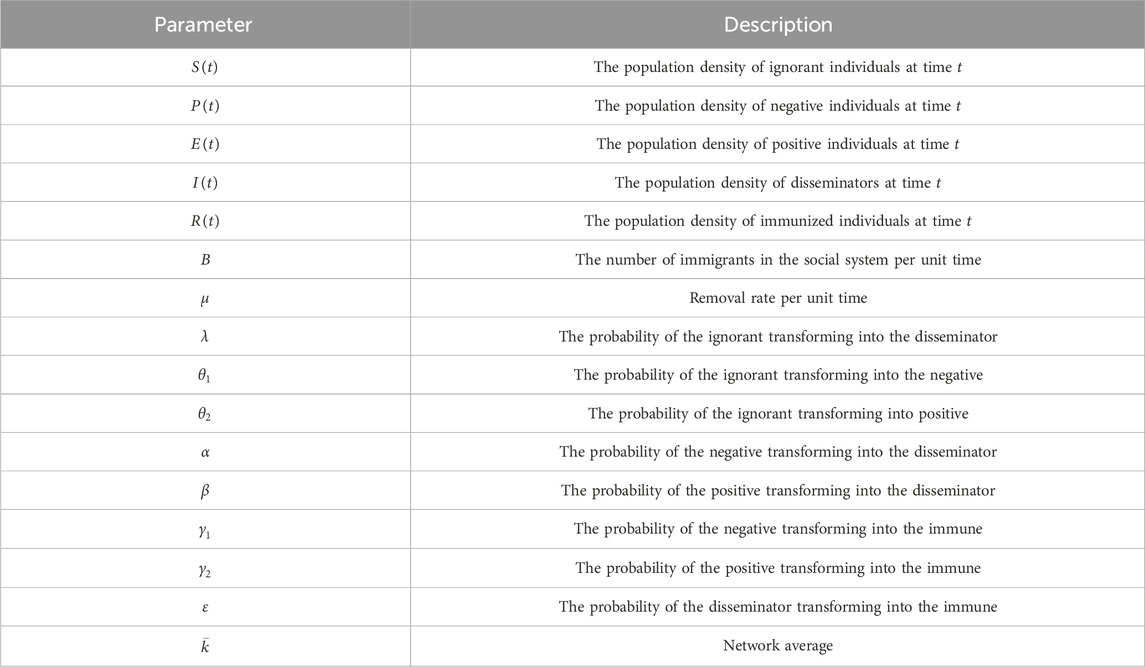
Based on the above assumptions, the state transition process of social network users during the dissemination of congestion warning information is obtained, as shown in Figure 1. Table 1 provides the meaning of each parameter in Figure 1, where all probabilities are positive constants.
(1) As shown in Figure 1, The changes in the states of the ignorant, negative, positive, spreader, and immune individuals per unit time are as follows: Within a unit of time, there are
(2) The density of people who transform from ignorant to negative within a unit of time is
(3) The density of people who transform from ignorant to active within a unit of time is
(4) The population density of ignorant individuals transforming into disseminators within a unit of time is
(5) The population density of uninformed, passive, active, and disseminators who become immune due to their neutrality or lack of interest in congestion warning information per unit of time is
Based on the above analysis, this article considers the congestion warning information dissemination model for the sensitivity of travelers to traffic congestion as follows:
Satisfy
3 Stability analysis of the model
It is not difficult to determine that the model has a balance point
Let
We can get:
Through calculation, it can be concluded that
Therefore, the basic regeneration number of system Equation 1 is the spectral radius
Theorem 1. When
Theorem 2. When
Theorem 3. When
Theorem 4. When
Theorem 5. The congestion warning information has an equilibrium point
4 Optimal control model
Convert the four proportional constants
Therefore, it can be proposed that the objective function is Equation 7:
Satisfy the following state system:
The initial conditions of system Equation 8 meet (Equation 9):
Where:
while
Theorem 6. An optimal control pair
Theorem 7. For the optimal control pair
With boundary conditions (Equation 13):
In addition, the optimal control pair
5 Numerical simulations
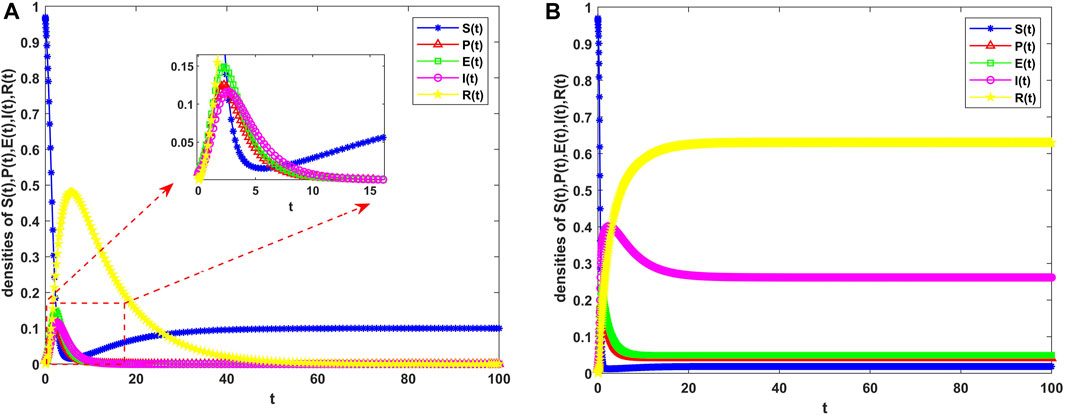
In this section, MATLAB R2021a simulation software is used, and the
In
When
Figures 3A–D depict the effects of different parameters in the model on the population density of congestion warning information disseminators. Figure 3A illustrates the trend of the population density of spreaders over time when
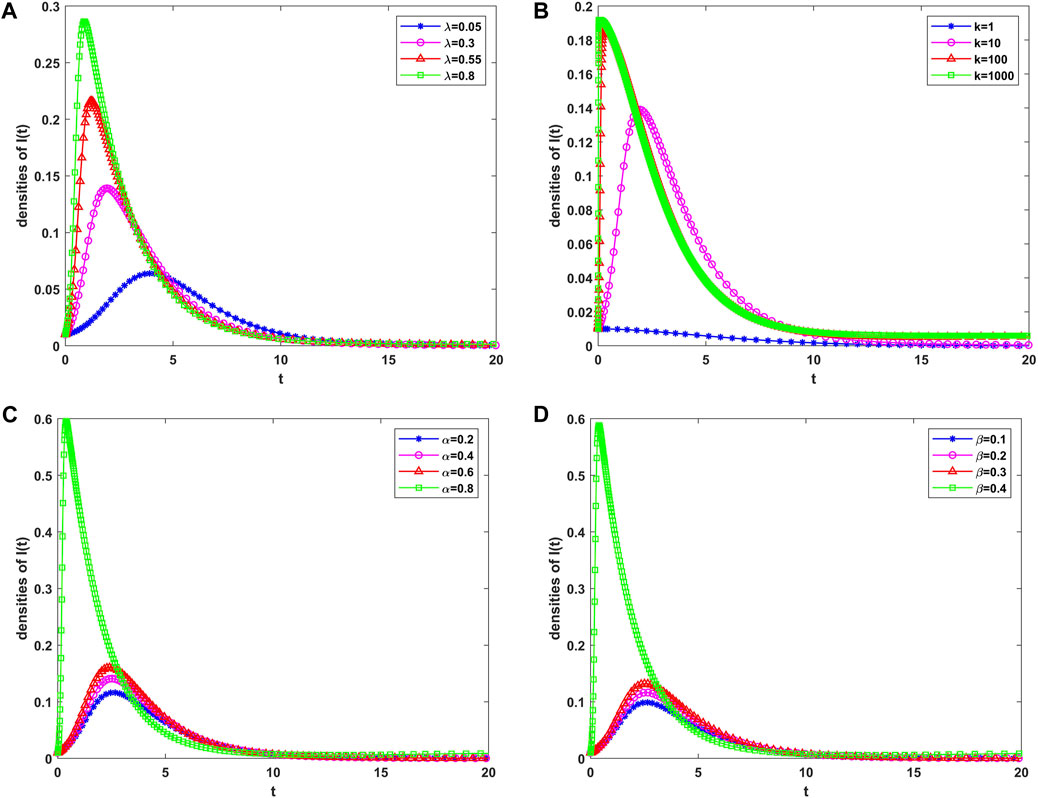
Figure 3. Trend of the density of disseminators over time under (A) different
Figure 3C shows the trend of the population density of spreaders over time when
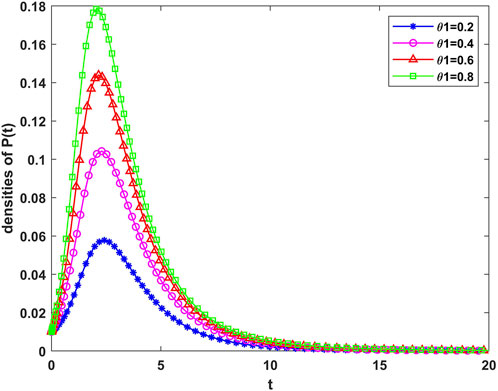
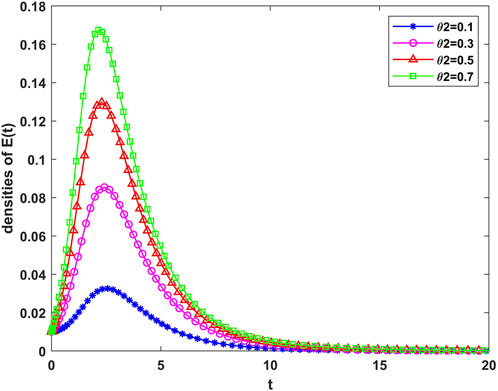
Figure 4 shows the trend of the density of negative individuals over time when
6 Discussion
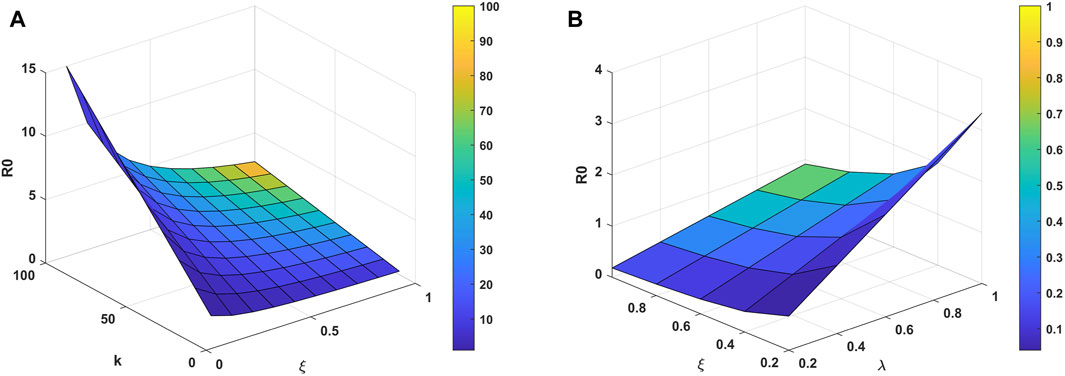
To evaluate the influence of parameters
This means that as
For parameters
This means that the basic regeneration number
7 Optimal control simulation
To analyze the impact of the optimal control
In the uncontrolled strategy, when
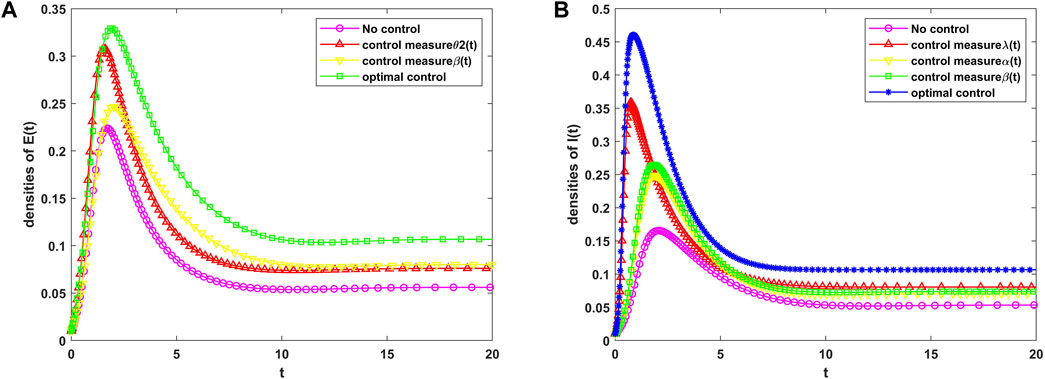
Figure 7. Trend of population density of (A)
When
8 Conclusion
In this paper, a congestion warning information dissemination model is constructed by considering the influence of travelers’ attitudes on the dissemination of congestion warning information. The basic reproduction number is calculated, and the existence and stability of the equilibrium points of no congestion warning information and congestion warning information in the model are analyzed. The existence of the optimal control of the model is verified, and the optimal control strategy of the model is proposed. In addition, the basic theorem of the model and the impact of changes in various parameters in the simulation model on the propagation process of congestion warning information are verified through numerical simulation, and sensitivity analysis and optimization control simulation are carried out. The research conclusions of this article are as follows:
(1) Based on the combination of two attitudes (positive and negative) of travelers toward road congestion, the SPEIR model for both negative and positive individuals is introduced on the basis of the classic infectious disease model. Moreover, the dissemination of congestion warning information is influenced by the topology of social networks. Therefore, the network average is introduced to characterize the tightness of the social network structure, increasing the realism and reasonableness of the model.
(2) Based on the next-generation matrix method, the basic regeneration number is determined, and the existence and stability of the equilibrium points of congestion free warning information and congestion warning information in the model are evaluated. When the basic regeneration number
(3) By utilizing optimal control theory, establishing and discussing optimal control problems, and formulating optimal control strategies that simultaneously increase the population density of both positive and disseminator, important reference opinions are provided for controlling or mitigating traffic congestion.
(4) The sensitivity of travelers to road congestion directly affects the dissemination process of congestion warning information. A negative or more inclined attitude toward road congestion after receiving congestion warning information is not conducive to alleviating traffic congestion pressure; if travelers are more sensitive to road congestion, they are more inclined to choose “fast” modes of transportation and have a stronger willingness to share congestion warning information, which is beneficial for preventing and controlling traffic congestion outbreaks. Therefore, relevant departments have taken timely measures to achieve vehicle diversion and real-time push congestion warning information to improve the sensitivity of traveler information, providing a reference for using congestion warning information dissemination models to suppress practical problems of road congestion.
There are some limitations in this paper. First, the average field method is used to construct a congestion warning information dissemination model, without considering the impact of social network heterogeneity on the process of congestion warning information dissemination. Therefore, in the future, congestion warning information dissemination models for different network structures should be investigated. Second, Only MATLAB was used for numerical simulation of the model, but the real process of congestion warning information dissemination is often more complex.
Therefore, in the future, the effectiveness of the model can be further verified in a real network environment, taking into account various individual psychological and behavioral factors, as well as the dynamic laws of congestion warning information dissemination evolution in a dual-layer coupled online and offline social network.
Data availability statement
The original contributions presented in the study are included in the article/Supplementary Material, further inquiries can be directed to the corresponding author.
Author contributions
HY: Conceptualization, Formal Analysis, Methodology, Writing–original draft, Writing–review and editing. HL: Methodology, Project administration, Supervision, Writing–review and editing. QS: Conceptualization, Formal Analysis, Investigation, Methodology, Supervision, Writing–review and editing. YJ: Formal Analysis, Methodology, Supervision, Writing–review and editing.
Funding
The author(s) declare that financial support was received for the research, authorship, and/or publication of this article. This work was supported by the 2023 Research Outcomes of Basic Scientific Research Projects of Liaoning Provincial Department of Education (JYTZD2023090) and the Liaoning Province Education Science Planning Project (JG20DB070).
Conflict of interest
Author QS was employed by Asset Company.
The remaining authors declare that the research was conducted in the absence of any commercial or financial relationships that could be construed as a potential conflict of interest.
Publisher’s note
All claims expressed in this article are solely those of the authors and do not necessarily represent those of their affiliated organizations, or those of the publisher, the editors and the reviewers. Any product that may be evaluated in this article, or claim that may be made by its manufacturer, is not guaranteed or endorsed by the publisher.
Supplementary Material
The Supplementary Material for this article can be found online at: https://www.frontiersin.org/articles/10.3389/fphy.2024.1490499/full#supplementary-material
References
1. He J, He Z, Fan B, Chen Y. Optimal location of lane-changing warning point in a two-lane road considering different traffic flows. Physica a-Statistical Mech Its Appl (2020) 540:123000. doi:10.1016/j.physa.2019.123000
2. Ahmad M, Chen QC, Khan Z, Ahmad M, Khurshid F. Infrastructure-based vehicular congestion detection scheme for V2i. Int J Commun Syst (2019) 32(3). doi:10.1002/dac.3877
3. Anderson JE, Dais JL, Garrard WL, Kornhauser AL. Personal rapid transit—a collection of papers on a new type of urban transportation. Journal of Dynamic Systems Measurement (1973) 95(4):440. doi:10.1115/1.3426748
4. Snickars F. Convexity and duality properties of a quadratic intraregional location model. Reg Sci Urban Econ (1978) 8(1):5–19. doi:10.1016/0166-0462(78)90009-1
5. Andersson ÅE, Marksjö B. General equilibrium models for allocation in space under interdependency and increasing returns to scale. Reg Urban Econ (1972) 2(2):133–58. doi:10.1016/0034-3331(72)90020-6
6. Smith K, Krishnamoorthy M, Palaniswami M. Neural versus traditional approaches to the location of interacting hub facilities. Location Sci (1996) 4(3):155–71. doi:10.1016/s0966-8349(96)00017-4
7. O'kelly ME. A quadratic integer program for the location of interacting hub facilities. Eur J Oper Res (1987) 32(3):393–404. doi:10.1016/s0377-2217(87)80007-3
8. McDonald GT, Brown A. The land suitability approach to strategic land-use planning in urban fringe areas. Landscape Plann (1984) 11(2):125–50. doi:10.1016/0304-3924(84)90035-2
9. Heffley DR. Decomposition of the koopmans-beckmann problem. Reg Sci Urban Econ (1980) 10(4):571–80. doi:10.1016/0166-0462(80)90018-6
10. Yilmaz Ö, Görgu L, O'Grady MJ, O'Hare GMP. Cloud-assisted mobile crowd sensing for route and congestion monitoring. Ieee Access (2021) 9:157984–96. doi:10.1109/access.2021.3129932
11. Yang YT, Chou LD, Tseng CW, Tseng FH, Liu CC. Blockchain-based traffic event validation and trust verification for vanets. Ieee Access (2019) 7:30868–77. doi:10.1109/access.2019.2903202
12. Shi ZY, Chen YZ, Liu JC, Fan DC, Liang CQ. Physics-informed spatiotemporal learning framework for urban traffic state estimation. J Transportation Eng A-Systems (2023) 149(7). doi:10.1061/jtepbs.Teeng-7545
13. Ning HJ, An YS, Wei YX, Wu NQ, Mu C, Cheng HH, et al. Modeling and analysis of traffic warning message dissemination system in vanets. Vehicular Commun (2023) 39:100566. doi:10.1016/j.vehcom.2022.100566
14. Humayun M, Afsar S, Almufareh MF, Jhanjhi NZ, AlSuwailem M. Smart traffic management system for metropolitan cities of kingdom using cutting edge technologies. J Adv Transportation (2022) 2022:1–13. doi:10.1155/2022/4687319
15. Jiang P, Liu ZK, Zhang LF, Wang JZ. Advanced traffic congestion early warning system based on traffic flow forecasting and extenics evaluation. Appl Soft Comput (2022) 118:108544. doi:10.1016/j.asoc.2022.108544
16. Zhang C, Liu TL, Huang HJ, Chen J. A cumulative prospect theory approach to commuters' day-to-day route-choice modeling with friends' travel information. Transportation Res C-Emerging Tech (2018) 86:527–48. doi:10.1016/j.trc.2017.12.005
17. Chen Y, Frei A, Mahmassani HS. From personal attitudes to public opinion information diffusion in social networks toward sustainable transportation. Transportation Res Rec (2014) 2430(2430):28–37. doi:10.3141/2430-04
18. Yu Y, A XH, Jia B, Jiang R, Gao ZY, Zhang HM. Is providing inaccurate pre-trip information better than providing No information in the morning commute under stochastic bottleneck capacity? - sciencedirect. Transportation Res C: Emerging Tech (2021) 126:103085. doi:10.1016/j.trc.2021.103085
19. Han X, Sun Q, Xing Y, Gao Z-Y, Zhang HM. Reducing strategic uncertainty in transportation networks by personalized routing advice: a route-choice laboratory experiment. Trav Behav Soc (2024) 34:100701. doi:10.1016/j.tbs.2023.100701
20. Khoo HL, Asitha KS. An impact analysis of traffic image information system on driver travel choice. Transportation Res A-Policy Pract (2016) 88:175–94. doi:10.1016/j.tra.2016.03.014
21. Huang JH, Sun MG, Cheng Q. Congestion risk propagation model based on multi-layer time-varying network. Int J Simulation Model (2021) 20(4):730–41. doi:10.2507/ijsimm20-4-585
22. Zhou Y, Li Y, Jiang R, Geng E. Dynamic analysis of interactive transmission of warning information and traffic congestion. J Geo-Information Sci (2017) 19(10):1279–86. doi:10.3724/SP.J.1047.2017.01279
23. Huang J, Sun M. Multi-network congestion risk propagation model considering driver behavior. J Transporation Syst Eng and Inf Tech (2021) 21(1):8–15. doi:10.2507/ijsimm20-4-585
24. Yang YR, Sun GX, Bin S. A two-tier network traffic congestion propagation model considering multiple warning messages complex systems and. Complexity Sci (2023) 1–9. doi:10.13306/j.1672-3813
25. Saberi M, Hamedmoghadam H, Ashfaq M, Hosseini SA, Gu Z, Shafiei S, et al. A simple contagion process describes spreading of traffic jams in urban networks. Nat Commun (2020) 11(1):1616. doi:10.1038/s41467-020-15353-2
26. Jia C, Zheng SY, Qian HQ, Cao BX, Zhang KT. Analysis of crowded propagation on the metro network. Sustainability (2022) 14(16):9829. doi:10.3390/su14169829
27. Chen YT, Yan QP, Mao JN, Huang H, Liu L. Urban traffic congestion propagation model based on SIS propagation theory. J Chongqing Jiaotong University(Natural Science) (2023) 42(06):103–10.
28. Ma WC, Zhang P, Zhao X, Xue LY. The coupled dynamics of information dissemination and seir-based epidemic spreading in multiplex networks. Physica a-Statistical Mech Its Appl (2022) 588:126558. doi:10.1016/j.physa.2021.126558
29. She BK, Liu J, Sundaram S, Paré PE. On a networked sis epidemic model with cooperative and antagonistic opinion dynamics. Ieee Trans Control Netw Syst (2022) 9(3):1154–65. doi:10.1109/tcns.2022.3145748
30. Nian FZ, Guo X, Li JZ. A new spreading model in the environment of epidemic-related online rumors. Mod Phys Lett B (2022) 36(04). doi:10.1142/s0217984921505692
31. Ojha RP, Srivastava PK, Awasthi S, Srivastava V, Pandey PS, Dwivedi RS, et al. Controlling of fake information dissemination in online social networks: an epidemiological approach. Ieee Access (2023) 11:32229–40. doi:10.1109/access.2023.3262737
Keywords: congestion warning information, social networks, communication dynamics, traveler attitude, optimum control
Citation: Yan H, Li H, Sun Q and Jiang Y (2024) Communication dynamics of congestion warning information considering the attitudes of travelers. Front. Phys. 12:1490499. doi: 10.3389/fphy.2024.1490499
Received: 03 September 2024; Accepted: 01 October 2024;
Published: 16 October 2024.
Edited by:
Ningbo Zhang, Beijing University of Posts and Telecommunications (BUPT), ChinaCopyright © 2024 Yan, Li, Sun and Jiang. This is an open-access article distributed under the terms of the Creative Commons Attribution License (CC BY). The use, distribution or reproduction in other forums is permitted, provided the original author(s) and the copyright owner(s) are credited and that the original publication in this journal is cited, in accordance with accepted academic practice. No use, distribution or reproduction is permitted which does not comply with these terms.
*Correspondence: Hua Li, bGgxQHVzdGwuZWR1LmNu
 Huining Yan1
 Hua Li