- 1College of Architecture and Civil Engineering, Xinyang Normal University, Xinyang, China
- 2Henan New Environmentally-Friendly Civil Engineering Materials Engineering Research Center, Xinyang Normal University, Xinyang, China
- 3School of Water Conservancy and Civil Engineering, Zhengzhou University, Zhengzhou, China
More than 60% of energy losses occur through the building envelope. Exterior wall insulation technology is widely used for wall insulation, but it is prone to cracking, falling off, and causing fires. Self-insulation concrete compound blocks (SIB) have attracted considerable attention in recent years for meeting building energy efficiency standards without the need for external insulation treatment. In this study, the shale ceramsite concrete (SCC) was prepared as the base material for the blocks through the orthogonal test and range analysis. In accordance with the insulation requirements of residential building walls, 12 types of self-insulation concrete compound blocks (SIB) were designed. The heat transfer process of these blocks was simulated and analyzed using Ansys Workbench, enabling a comparison of the thermal conductivity effects resulting from different hole distribution schemes in the insulation blocks. The simulated values were compared with the theoretical calculations, and the simulated results were in good agreement with the theoretical calculations. The results showed that TZ-12 exhibited the optimal hole configuration with a heat transfer coefficient of 0.5 W/(m2·K), which was 38.3% lower than that of the external insulation block TZ-9. Additionally, TZ-12 demonstrated the average compressive strength of 8.28 MPa and the minimum compressive strength of 7.45 MPa, meeting the requirements for MU7.5 strength grade and also satisfying the requirement of not less than MU5.0 when self-insulation blocks were used for external walls. The simulated heat flux rate of the self-insulation concrete compound block wall (SIBW) was 15.4 W, and its heat transfer coefficient was 0.56 W/(m2·K), which was 29.1% lower than that of the external thermal insulation wall (ETIW), meeting the design standard for achieving the 65% energy saving in residential buildings situated in regions with hot summers and cold winters.
1 Introduction
The building sector was responsible for 45.5% of China’s overall energy consumption in 2020, with more than 60% of energy loss occurring through the building envelope [1, 2]. Therefore, the energy consumption in buildings can be effectively reduced by focusing on enhancing the thermal insulation and energy-saving capabilities of the outer wall [3, 4]. External insulation technology is widely used for wall insulation but has two inevitable defects: firstly, the lifespan of building insulation materials differs from that of the structure, making them prone to cracking and falling off; secondly, fire hazards cannot be avoided [5, 6]. Self-insulation concrete compound blocks (SIB) have garnered significant attention due to their unique composition of concrete and thermal insulation materials [7]. This construction material eliminates the need for external insulation treatments while still meeting building energy conservation standards [8, 9].
The mechanical properties requirements can still be met by incorporating insulation material, thereby optimizing the thermal conductivity of the blocks [10, 11]. Jiao et al. [12] conducted a study on the optimal combination and resultant characteristics of hollow blocks made from alkali-activated slag ceramsite concrete, which exhibited a compressive strength of up to MU15. The study conducted by Osman et al. [13] demonstrated that the recently developed ceramist concrete blocks effectively meet the criteria for insulation blocks in extremely cold areas, contributing to energy conservation efforts. Xie et al. [14] reported that the thermal resistance coefficient of the recycled concrete hollow block containing Sludge ceramsite was measured to be 0.884 (m2·K)/W. Al-Tarbi et al. [15] investigated the compliance of the recently developed blocks (composed of perlite, vermiculite, scoria, and polystyrene) with the non-load-bearing compressive strength requirement specified in ASTMC129. Al-Tamimi et al. [16] incorporated perlite into a recently developed concrete block at a proportion of 30% to enhance its thermal efficiency. The addition of perlite resulted in a significant reduction in the thermal conductivity of the block, with a value of 0.309 W/(m·K), indicating a substantial decrease by 33% compared to the control block that lacked any insulating materials.
Topcu and Iskdag [17] utilized perlite as a means to manufacture clay blocks with enhanced resistance to heat. The introduction of 30% perlite replacement resulted in a significant reduction of approximately 52% in thermal conductivity, compared to the control block. Liu et al. [18] conducted a comprehensive experimental analysis on the insulation performance of recycled concrete blocks made from construction and demolition waste. According to Jaafar et al. [19], the utilization of broken bricks and concrete slurry waste in partition walls made of concrete blocks could potentially enhance their ability to withstand high temperatures, thereby offering an added value application. According to the study conducted by Zhao et al. [20], it was observed that concrete blocks manufactured using 100% recycled concrete aggregates exhibited a compressive strength of 11.1 MPa after a curing period of 28 days. Al-Awsh et al. [21] studied utilizing volcanic scoria as the primary material for constructing walls can significantly enhance thermal resistance, resulting in an impressive increase of approximately 279% compared to traditional concrete blocks.
By integrating holes optimization into numerical simulation techniques, it is possible to further improve the thermal conductivity of the bricks [22–24]. Al-Tamimi et al. [25] employed the ABAQUS software to ascertain the most favorable hole configuration for concrete bricks, aiming to enhance wall thermal resistance and subsequently decrease electricity consumption. Al-Awsh et al. [26] utilized rectangular cavities arranged in three rows to minimize the effective thermal conductivity. They also verified their findings by employing a three-dimensional model developed through the ANSYS-Fluent software program. According to the study conducted by Cuce et al. [27], it was found that the 5-row hollow design demonstrated superior thermal resistance and lightness compared to the 3-row and 4-row configurations. Shuai et al. [28] found that H-shaped interlocking insulation blocks exhibited superior thermal performance compared to crossed-shaped ones. Notably, the most significant enhancement in block’s thermal performance was achieved through a reduction in the thermal conductivity of concrete materials.
According to the study conducted by Ouakarrouch et al. [29], it was observed that an augmentation in both the width and quantity of cavities results in a notable reduction in heat dissipation and an elevation in thermal insulation. Blanco et al. [30] demonstrated that numerical analysis provides a reliable estimation of the thermal performance of walls, which aligns well with experimental results obtained using a guarded hot-box apparatus. Li et al. [31] investigated the impact of various combinations and configurations of holes on thermal conductivity, revealing a complex relationship between hole quantity, arrangement, and thermal conductivity. Bi-chao et al. [32] studied that enhancing the thermal insulation characteristic of the block can be achieved by increasing the number of hole rows in the air layer, while maintaining a certain hole rate. Sutcu et al. [33] demonstrated the effective application of DOE-SM techniques in conjunction with finite element modeling for optimizing the overall heat transfer coefficient.
In the context of the current building energy-saving goal, developing higher-performance SIB to meet the standards for energy-saving design and market demand has become a significant challenge in the industry. This paper designed a new type of SIB specifically for residential buildings located in areas with hot summers and cold winters. The heat transfer process of blocks was simulated and analyzed using Ansys Workbench, enabling a comparison of the thermal conductivity effects resulting from different hole distribution schemes in the insulation blocks. Finally, an optimal design scheme was obtained to meet the 65% energy saving standard in hot summer and cold winter regions, providing theoretical guidance for the development of high-performance SIB and promoting its popularization and application.
2 Preparation for shale ceramsite concrete
Compared to conventional concrete, ceramic lightweight aggregate concrete possesses characteristics such as low bulk density, thermal insulation, and heat preservation [34, 35]. These properties enable a reduction in the dead weight of building structural elements by approximately 20%–25%. However, the utilization rate of lightweight aggregate concrete in building structure engineering remains low due to challenges in achieving sufficient structural strength and harsh construction conditions. The shale ceramite exhibits exceptional strength, making it an ideal material for the production of lightweight aggregate concrete [36]. Consequently, this study undertook the design and preparation of shale ceramsite concrete (SCC) to ensure both the desired lightweight characteristics of prefabricated building components and their structural performance.
2.1 Materials
The test utilized Tongli brand PO42.5 common Portland cement as the primary binder. Natural river sand, with an accumulation density of 1,450 kg/m3 and an apparent density of 2,710 kg/m3, was employed as the lightweight aggregate. Grade 800 shale ceramsite, characterized by its main parameters outlined in Table 1, served as the coarse aggregate material. Class I fly ash, having a density of 2,100 kg/m3, was incorporated for this experimental study. A polycarboxylic acid water reducer was employed in this investigation with a water reduction efficiency of approximately 32%. For thermal insulation purposes, hydrophobic perlite insulation board exhibiting a thermal conductivity value of 0.051 W/m·K was implemented.
2.2 Mix proportion design
A comprehensive experiment is one in which all possible combinations of factor levels are tested. This experimental design offers the advantage of providing extensive information, but it also has the drawback of requiring a large number of experiments and consuming significant resources. The orthogonal test employed in this study is a design method used to investigate multiple factors and levels. It selects representative points from the comprehensive test based on orthogonality, making it an efficient, rapid, and cost-effective experimental design method [37].
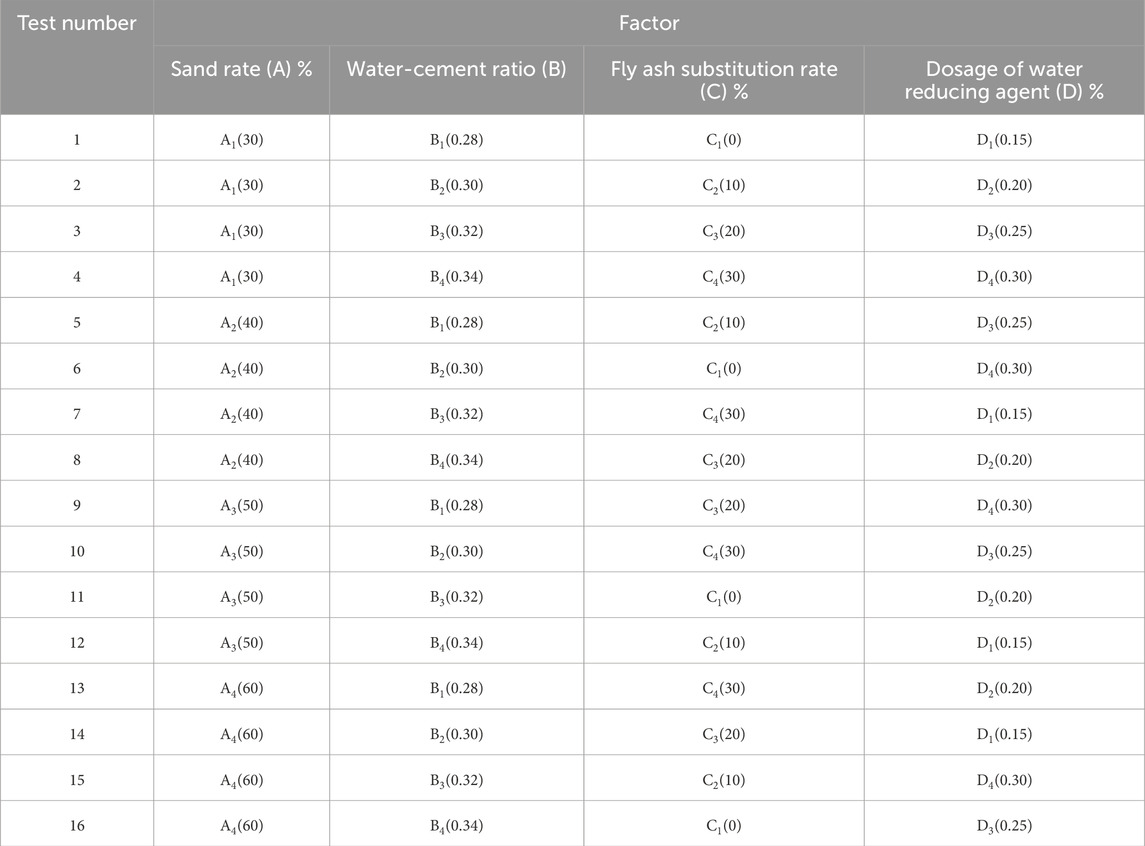
The fundamental tool for designing orthogonal experiments is the orthogonal table, a mathematical table based on the principles of equilibrium distribution and combinatorial mathematics. By utilizing the orthogonal table, experiments can be designed to possess balanced dispersion characteristics. According to JGJ/T12-2019 [38], shale ceramsite concrete (SCC) with LC30 strength was designed using the loose volume method. Sixteen orthogonal tests were conducted based on four factors and four levels, as shown in Table 2. Test factor A represents the sand rate, test factor B represents the water-cement ratio, test factor C represents the fly ash substitution rate, and test factor D represents the dosage of water reducing agent.
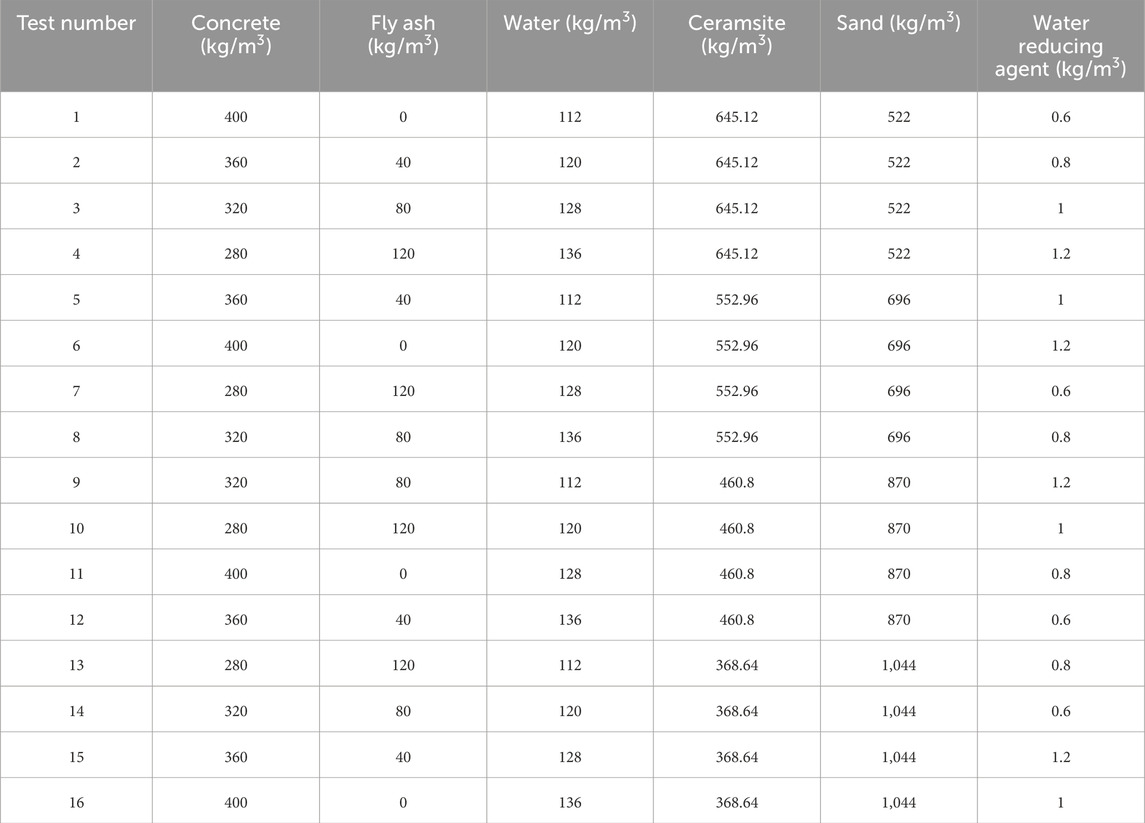
In this research, the compressive strength and flexural tensile strength were chosen as control factors to primarily examine their impact on the compressive strength and flexural tensile strength of concrete samples. The experimental design is presented in Table 3. The evaluation of compressive strength and flexural tensile strength for the test blocks was conducted following GB/T50081-2019 [39]. The dimensions of the test blocks utilized for evaluating compressive strength were 100 mm × 100 mm × 100 mm, while for evaluating flexural tensile strength, they were 100 mm × 100 mm × 400 mm in size. The compressive strength and flexural strength of the specimens were tested using WAW-3000 universal testing machine. The test process is shown in Supplementary Figure S1 (supplementary figure at the end of the article).
The compressive strength of the test blocks shall be calculated according to the following formula 1:
Where:
The flexural tensile strength of the test blocks should be calculated according to the following formula 2:
Where:
2.3 Range analysis
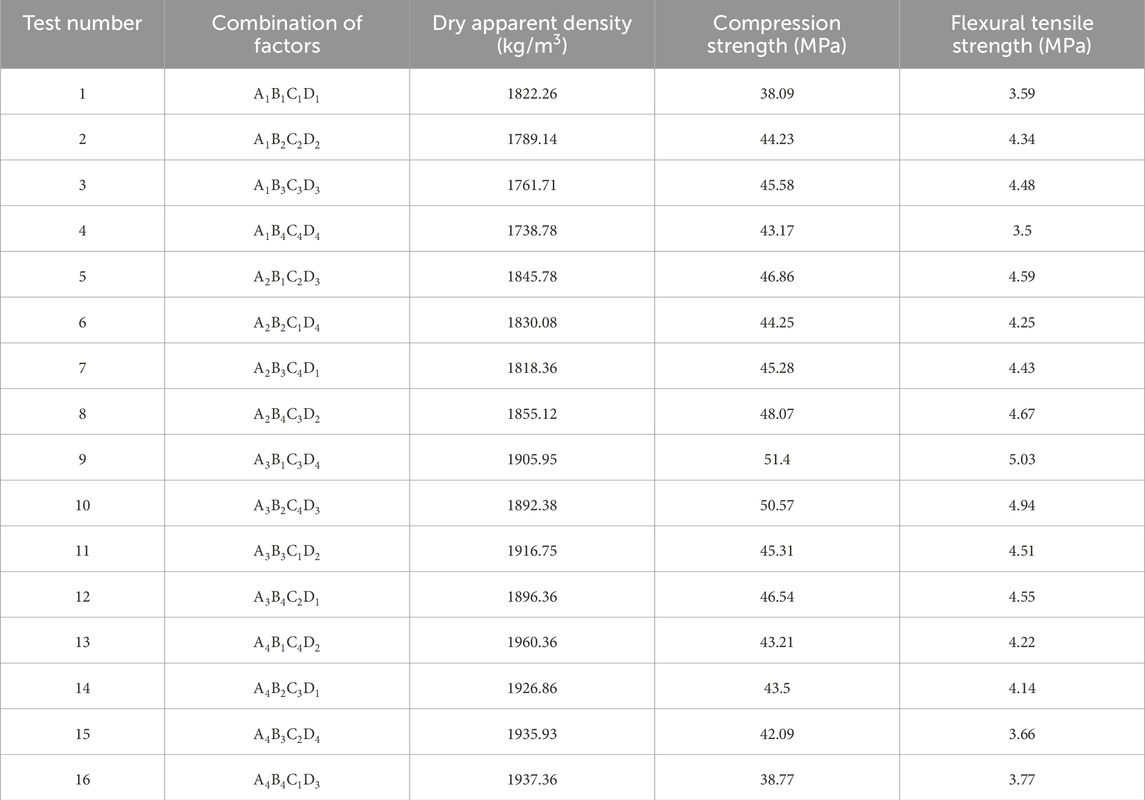
The outcomes of the orthogonal experiment conducted on SCC are presented in Table 4 following testing and data processing.
The range analysis, also referred to as intuitive analysis, is an intuitive and widely employed analytical method in the examination of results from orthogonal test design.
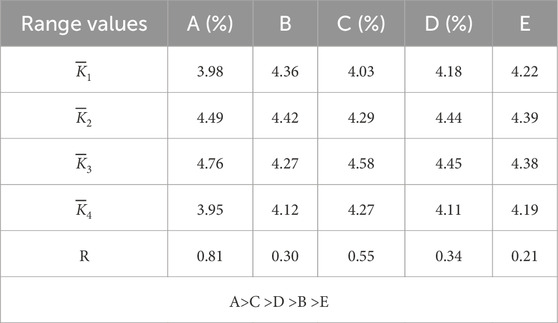
The compressive strength test data of the SCC was subjected to range analysis. The results in Table 5 demonstrated that the range values (R) for the four test factors A, B, C, and D were higher than those of the control group (E), indicating compliance with orthogonal test error requirements. By comparing primary and secondary factors, it was evident that sand rate exerted the most significant influence on compressive strength of the SCC, followed by fly ash substitution rate, dosage of water-reducing agent, and water-cement ratio. Notably, both sand rate and fly ash substitution rate exhibited a substantial impact on compressive strength of the SCC. The optimal levels determined were as follows: sand rate at 50%, water-cement ratio at 0.3, fly ash substitution rate at 20%, and dosage of water-reducing agent at 0.25%. In other words, A3B2C3D3 represented the optimal combination for achieving maximum compressive strength.
It could be seen from Table 5 that with the increase of sand rate (A), the compressive strength of SCC first increased and then decreased. When the sand rate was 50%, the compressive strength of SCC reached the maximum, which was 48.46 MPa. The reason was that the strength of shale ceramite was lower than that of cement stone, and it was prone to failure first under loading and compression conditions. The smaller the content of shale pottery was, the larger the sand rate was, and the higher the strength of the concrete was. However, when the sand rate exceeded the reasonable sand rate, the gradability of SCC became worse, which easily led to poor compactness and low compressive strength.
The proper replacement of cement with fly ash (C) was beneficial to improve the compressive performance of SCC. In the later curing stage, fly ash could react with cement twice to produce hydrated calcium silicate gel. Moreover, the particle size of fly ash was much smaller than the particle size of cement in the pores of shale ceramite. The pores between cement could be filled with fly ash particles, which improved the overall compacting degree of concrete and its strength. However, if the replacement rate of fly ash was too large, the strength of concrete would also be insufficient due to too little cement content. Therefore, with the increase of the replacement rate of fly ash, the compressive strength of SCC would increase first and then decrease. When the replacement rate of fly ash was 20%, the compressive strength of SCC reached the maximum of 47.14 MPa. It was about 13.29% higher than that when the substitution rate of fly ash was 0.
The compressive strength of SCC increased with the increase of the dosage of water reducing agent (D), and the fluctuation of compressive strength was not obvious when the dosage of water reducing agent increased from 0.2% to 0.3%. This was because the water reducing agent could play a certain dispersion effect. With the increase of the dosage of water reducing agent, the concrete could maintain good flow performance under low water consumption. Thus, the compressive strength of shale concrete could be improved. The characteristics of ceramsite in SCC were different from the stones of ordinary concrete. The ceramsite was pre-wet for 1 h before use, so that the ceramsite reached the saturation state, and the water curing concrete would be released in the later period, so the water-cement ratio (C) changed within a certain range, and the impact on concrete was not very large.
The flexural tensile strength test data of the SCC was subjected to range analysis. The results in Table 6 demonstrated that the range values (R) for the four test factors A, B, C, and D were higher than those of the control group (E), indicating compliance with orthogonal test error requirements. By comparing primary and secondary factors, it was concluded that sand rate exerted the most significant influence on the flexural tensile strength of SCC, followed by fly ash substitution rate, water-reducing agent mixing amount, and water-cement ratio. The optimal levels determined were as follows: sand rate at 50%, water-cement ratio at 0.3, fly ash substitution rate at 20%, and dosage of water-reducing agent at 0.25%. Therefore, based on these findings, A3B2C3D3 represented the optimal combination for achieving maximum flexural tensile strength. Table 6 showed that the flexural strength variation pattern was almost consistent with the compressive strength variation pattern.
The optimal combination for compressive strength, as determined by range analysis, was A3B2C3D3. Similarly, the optimal combination for flexural tensile strength also corresponded to A3B2C3D3. However, since this ideal combination was not included in the orthogonal table, we conducted a separate test on A3B2C3D3 and measured its thermal conductivity for further investigation. Several 300 mm × 300 mm × 50 mm specimens were prepared, and the thermal conductivity of SCC was tested using DR-3030 double plate thermal conductivity tester. The test process is shown in Supplementary Figure S2 (supplementary figure at the end of the article). The results of this test are presented in Table 7. The compressive strength of the optimal combination (A3B2C3D3) was 52.03 MPa, which was 1.2% higher than that of the optimal blocks in the other 16 groups. The flexural tensile strength of the optimal combination (A3B2C3D3) was 5.13 MPa, which was 1.9% higher than that of the optimal blocks in the other 16 groups. It was verified that A3B2C3D3 is the combination with the optimal mechanical properties. The thermal conductivity of SCC (A3B2C3D3) was 0.8314 W/(m·K). It was prepared as the base material of the blocks.
3 Optimization design and thermal performance analysis of holes
3.1 Evaluation index
The heat transfer coefficient pertains to the rate at which heat is transferred per unit area within a given time, under steady-state conditions, when there is a temperature difference of one unit between the air on either side of the building envelope. The magnitude of the heat transfer coefficient serves as an indicator for evaluating the thermal insulation performance of the wall, which is inversely proportional to building energy consumption. In this paper, numerical simulation methods are used to simulate the average surface temperature of the block under steady-state heat transfer conditions. Subsequently, the block’s heat flux density is calculated using Formula 3.
Where:
Then the heat transfer coefficient of the block is calculated based on Formula 4:
Where:
The heat transfer resistance is a physical quantity that measures the thermal impedance of the building envelope, which is the reciprocal of the heat transfer coefficient. According to GB50176-2016 [40], the thermal resistance, heat transfer resistance, and heat transfer coefficient of the blocks are calculated theoretically.
The calculation formula for the heat resistance of a single material layer is shown in (5):
Where:
The calculation formula for the thermal resistance of the multi-layer building envelope is shown in (6):
Where:
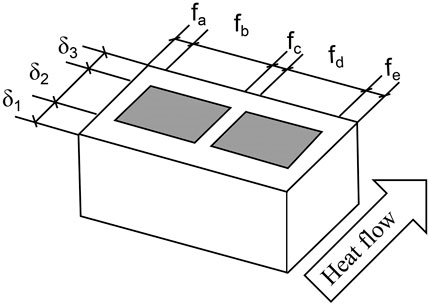
The schematic of the average thermal resistance calculation is shown in Figure 1. The calculation of the thermal resistance for the composite envelope can be determined using the formula provided below:
Where:
The calculation of the heat transfer resistance for the flat wall of the envelope shall be based on Formula 11:
Where:
The heat transfer coefficient of the flat wall of the envelope shall be calculated according to Formula 12:
Where:
3.2 Calibration parameters
According to the specifications outlined in JG/T407-2013 [41] regarding blocks dimensions, the length of the SIB is either 390 mm or 290 mm, with a width of 190 mm, 240 mm, or 280 mm, and a height of 190 mm. Other specifications and sizes are subject to mutual agreement between suppliers and consumers. To meet energy-saving requirements in regions characterized by hot summers and cold winters while considering existing research findings, the final block specification had been determined as 390 mm × 240 mm × 190 mm.
The concrete substrate and insulation material were assumed to be homogeneous, isotropic media with constant thermal properties. The thermal conductivity of the SCC was 0.8314 W/(m·K), while that of the perlite insulation board was 0.051 W/(m·K). Due to the difficulty in determining the thermal conductivity of air, this study converted the corresponding thermal resistance of an air layer’s thickness into its equivalent thermal conductivity value for analysis purposes. For vertical air interlayers thicker than 40 mm, their thermal conductivity was considered as 0.222 W/(m·K) [42].
Since the geometric models were relatively regular, hexahedral elements were used for meshing. The element was made from“Solid 279”, a 20-node element model. The element was suitable for thermal analysis of various materials and structures, including metals, plastics, composites, etc. Its flexibility made it the preferred element type in steady-state thermal analysis [43, 44].
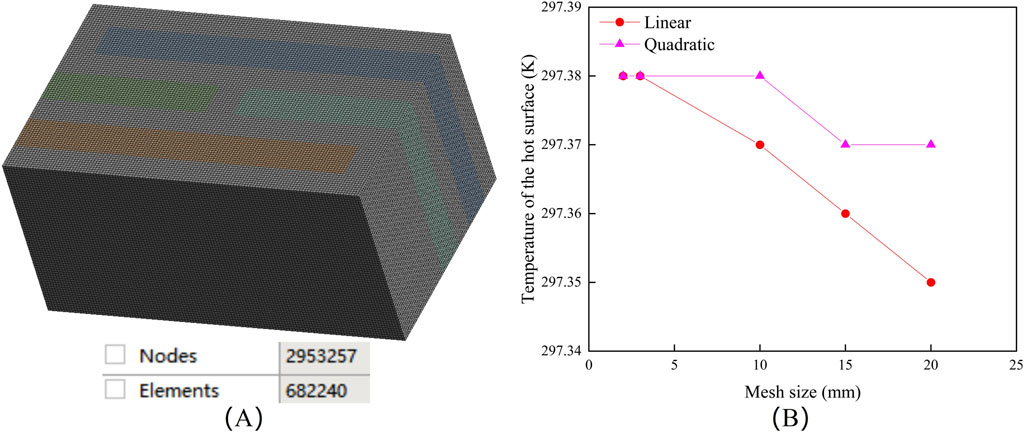
The entire analysis relied on the grid-type approach used in this paper. The convergence criterion used a combination of H-type and P-type methods, focusing on the investigation of element size and element order [45, 46]. In the preliminary simulation, the finite element results differed greatly due to the different model geometries, so the mesh-independent simulation was carried out for the most complex hollow block (TZ-12), and the results are shown in Table 8. Both H-type and P-type methods met the convergence conditions in the model, as shown in Figure 2. In order to save time and reduce errors, the optimal mesh size of 3 mm was selected for simulation. The Element Order was set to Quadratic. The second-order element provided higher spatial resolution and enabled more accurate simulation of temperature gradients and heat flow distributions. The entire model had 682,240 elements and 2,953,257 nodes, as shown in Figure 2 [47, 48].
There were three common types of boundary conditions for steady-state heat transfer: (1) Constant boundary temperature; (2) Constant heat flux density at the boundary; (3) Known surface heat transfer coefficient on an object’s boundary with known fluid temperature surrounding it.
The heat transfer problem in engineering could be simplified to a one-dimensional scenario due to the significantly smaller thickness compared to the length and width perpendicular to the direction of heat transfer. It was assumed that the thermal conductivity of air and concrete, used in simulations, remains constant within a specific temperature range. Furthermore, it was considered that both ambient temperatures at the low and high ends of the block remain unchanged.
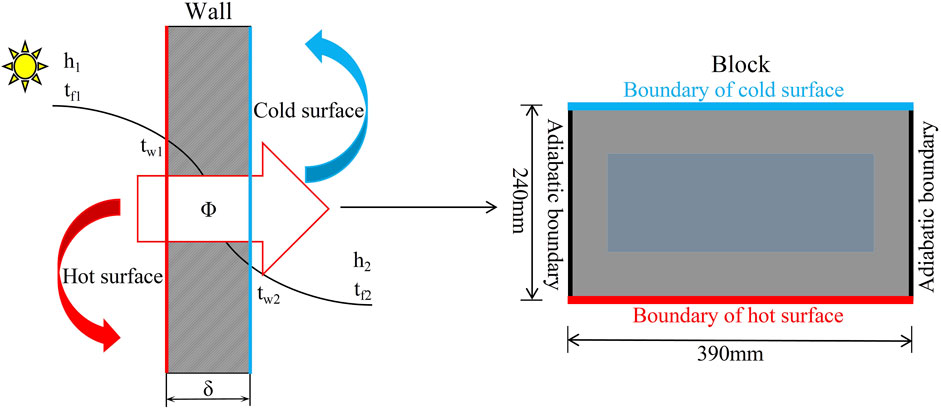
The heat transfer process between the two fluids is depicted in Figure 3. In this study, we adopted the third type of boundary condition for steady-state heat transfer, designating the hot surface and cold surface as the outer surfaces in the vertical direction of heat transfer. Following GB50176-2016 guidelines, convection conditions were applied on both sides, with a hot convection heat transfer coefficient (h1) set to 8.7 W/(m2·K) at an ambient temperature of 299.15 K (26°C); and a cold convection heat transfer coefficient (h2) set to 23.0 W/(m2·K) at an ambient temperature of 268.42 K (−4.73°C). (The values were obtained by referring to the average indoor temperature in summer and the average outdoor temperature in winter in Xinyang City, China.)The block boundary conditions are illustrated in Figure 3, where convective loads were imposed on two surfaces along the thickness direction of the block model while four walls along its height and width directions were designated as adiabatic conditions. The ambient temperature and convective heat transfer coefficients on both sides of the block remained unchanged to ensure a steady-state heat transfer process.
3.3 Basic hole types
The design incorporated four basic hole types, namely, rectangular, rhombus, square, and circular holes. Figure 4 illustrates the design of the basic hole for the block. To eliminated interference from other factors, a single hole with the hole rate of 13% was employed. The 3D model is created using the DesignModeler module, as depicted in Figure 4.
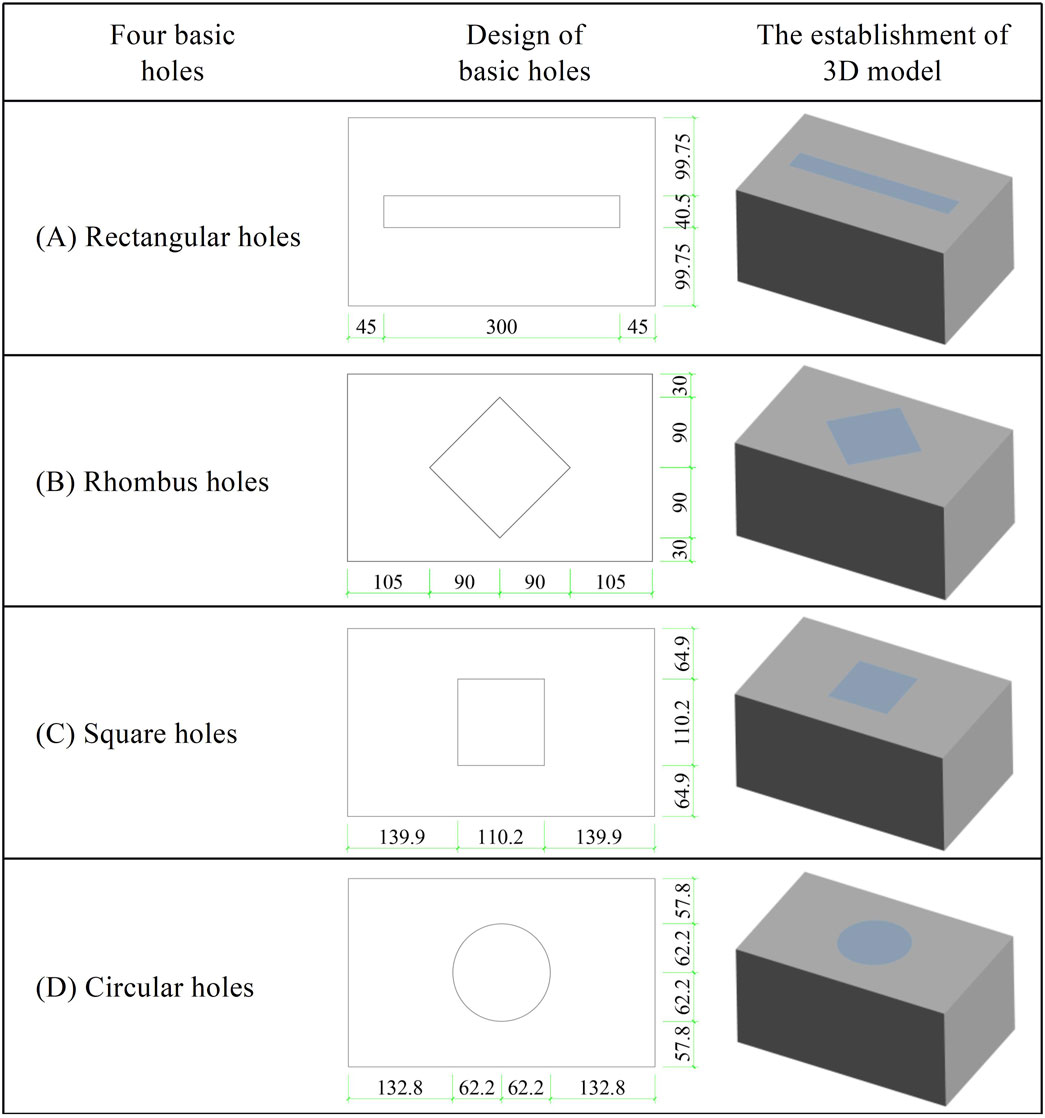
Figure 4. The design of the basic hole for the block and establishment of 3D model. (Unit: mm). (A) Rectangular holes, (B) Rhombus holes, (C) Square holes, (D) Circular holes.
The cloud map in Figure 5 showed the temperature distribution for the basic hole block, where TZ referred to the block with a perlite insulation board filled inside, and TK referred to the block with an air interlayer inside. From the temperature cloud maps of the four TZ blocks, it was evident that TZ-J had the most effective heat flow blocking capability. Similarly, based on the temperature cloud maps of the 4 TK blocks, it was apparent that TK-J exhibits superior heat flow blocking performance. Notably, TZ-J demonstrated a significantly better heat flow blocking effect compared to TK-J. Therefore, rectangular holes exhibited the highest level of effectiveness in blocking heat flow, and blocks filled with perlite insulation boards provided better insulation than air interlayer blocks. The order of insulation effectiveness for the blocks was as follows: rectangular holes < rhombus holes < square holes < circular holes.
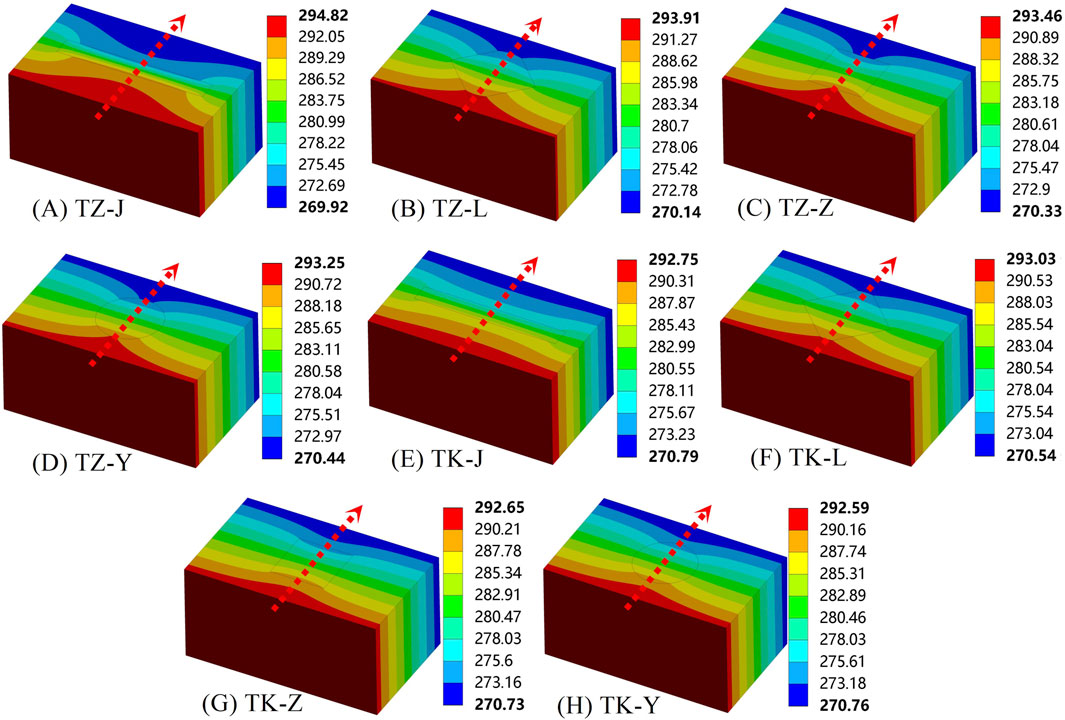
Figure 5. The cloud map of the temperature distribution for the basic hole block. (Unit: K). (A) TZ-J, (B) TZ-L, (C) TZ-Z, (D) TZ-Y, (E) TK-J, (F) TK-L, (G) TK-Z, (H) TK-Y.
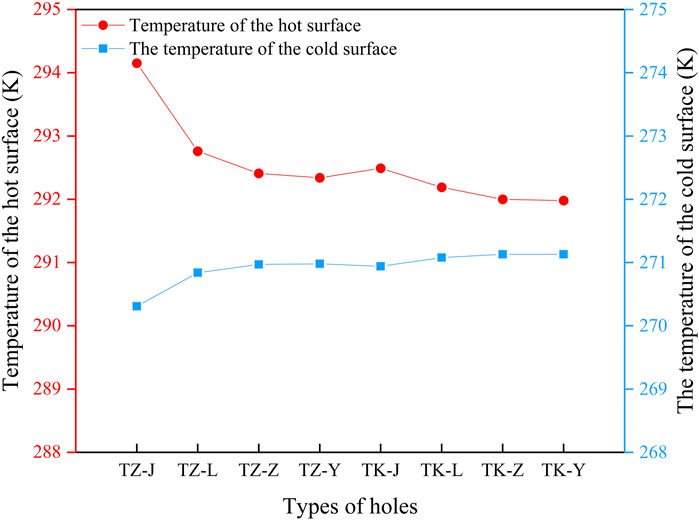
Based on the numerical simulation results obtained from ANSYS Workbench, the hot surface temperature and cold surface temperature of the block were determined. The simulated surface temperature of the basic hole block was illustrated in Figure 6. Heat flux within the block was transferred from the hot surface to the cold surface. A higher temperature on the hot surface or a lower temperature on the cold surface indicated a more effective insulation performance of the block. As depicted in Figure 6, it could be observed that for basic hole blocks, TZ-J exhibited superior insulation effect compared to TZ-L, TZ-Z, and TZ-Y; similarly, TK-J demonstrated better insulation effect than TK-L, TK-Z, and TK-Y. Specifically, TZ-J had a 0.57% higher temperature than that of TK-J’s hot surface while being 0.23% cooler than that of TK-J’s hot surface; thus confirming that rectangular holes filled with perlite insulation board contribute to enhanced insulation effectiveness.
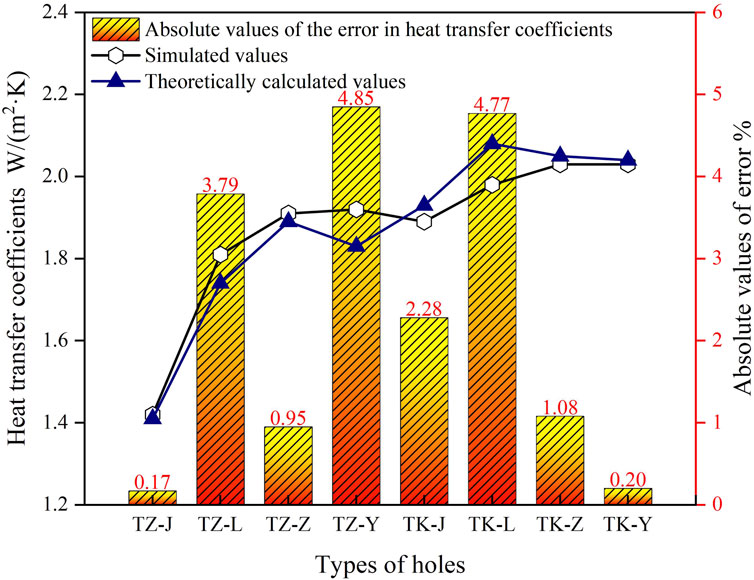
The error analysis of the heat transfer coefficient for the basic hole block is shown in Figure 7. To ensure the credibility of the simulation, theoretical calculations were conducted to determine the heat transfer coefficient of four different types of basic hole blocks, as per Equations 5–12. By comparing the theoretical calculations with the simulated values, it was found that the error between the two values of different hole blocks was less than 5%, which confirmed the high accuracy of the numerical simulation method adopted in this study.
3.4 Design of holes and analysis of thermal performance
In conclusion, eight hole-schemes for perlite blocks using rectangular holes had been designed with the hole rate of 38.5%. The design of the perlite block holes is illustrated in Figure 8.
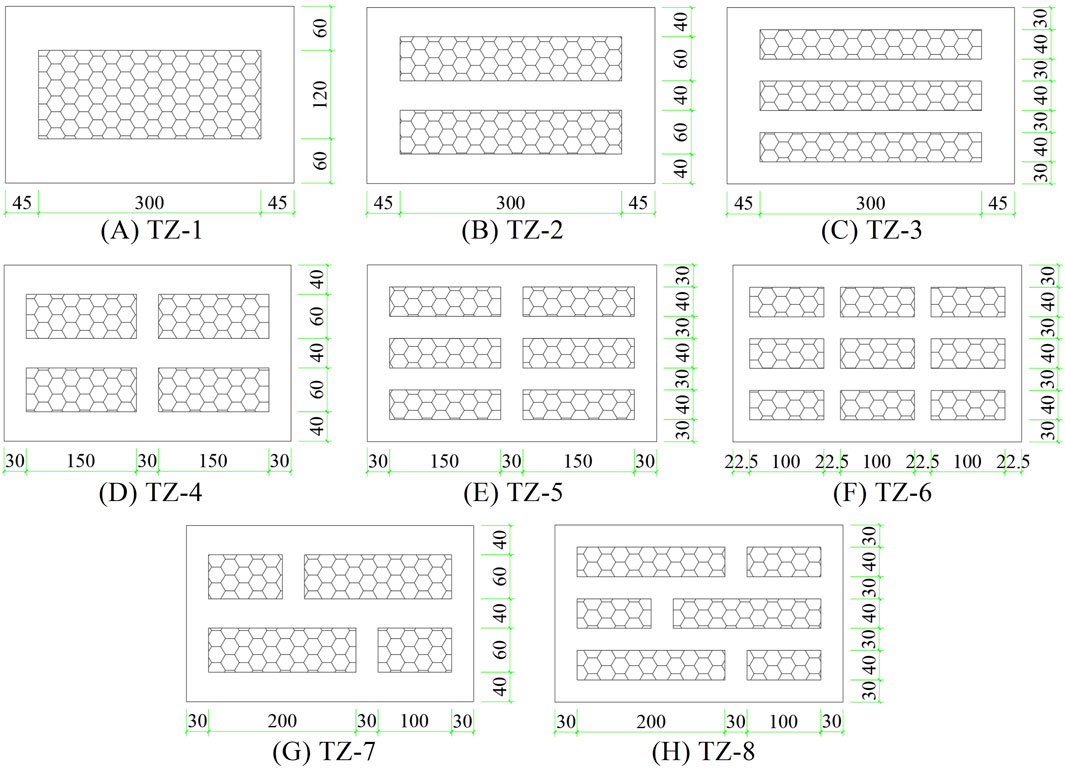
Figure 8. Design of the perlite block holes. (Unit: mm). (A) TZ-1, (B) TZ-2, (C) TZ-3, (D) TZ-4, (E) TZ-1, (F) TZ-6, (G) TZ-7, (H) TZ-8.
The distribution of heat flux density for the perlite block is visually represented in Figure 9. It can be observed from Figure 9 that the SCC displayed a comparatively elevated heat flux, while the perlite insulation board exhibited a relatively reduced heat flux. This was because of the high thermal conductivity of SCC, which allowed most of the heat flux to be transferred through the concrete. Additionally, there were direct transfers of heat flux from the hot side to cold side on both left and right sides of the block, forming a heat bridge and resulting in high heat flux density for all eight types of perlite blocks.
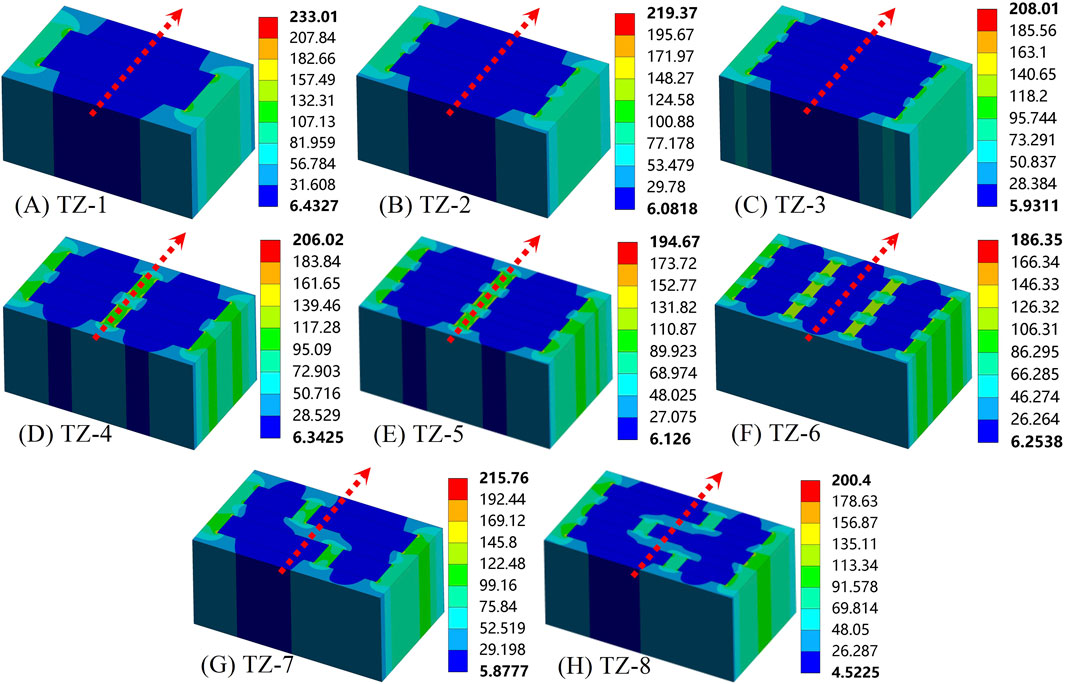
Figure 9. The cloud map of the heat flux density distribution for the perlite block. (Unit: W/m2). (A) TZ-1, (B) TZ-2, (C) TZ-3, (D) TZ-4, (E) TZ-1, (F) TZ-6, (G) TZ-7, (H) TZ-8.
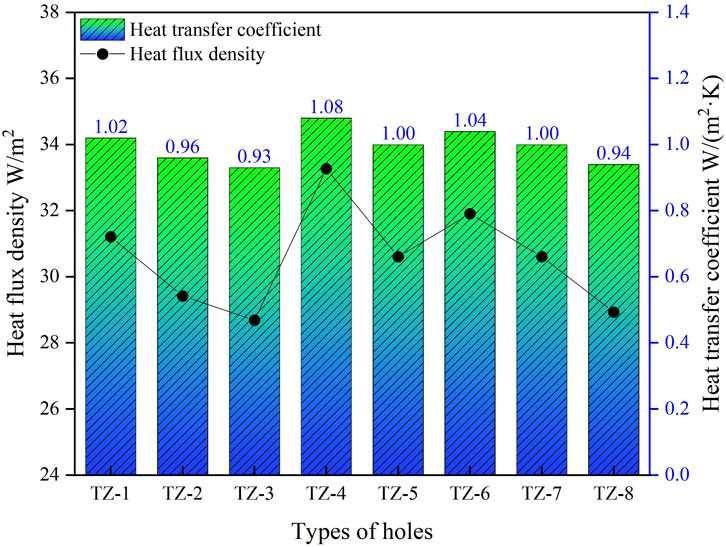
The simulated results of the heat flux density and heat transfer coefficient for the perlite block are shown in Figure 10. The study found that: Compared with the simulated results of TZ-1, TZ-2, and TZ-3, it was observed that the heat flux and heat transfer coefficient of the block gradually decreased with an increase in the number of rows of holes. Furthermore, when comparing the simulated results of TZ-3, TZ-5, and TZ-6, it was discovered that as the number of columns of holes increased, there was a greater number of direct heat transfer channels from the hot side to the cold side. Consequently, both the heat flux and heat transfer coefficient of the blocks increased gradually. Additionally, by comparing the simulated results between TZ-4 and TZ-7 as well as between TZ-5 and TZ-8 respectively, it was determined that staggered holes could enhance insulation performance.
3.5 Optimal design
In summary, the row of holes, the column of holes, and the staggered arrangement could improve the heat transfer performance of the block. It was necessary to further optimize the hole design because there was still a certain gap with the energy-saving target of 65% due to direct heat transfer from the hot side to the cold side at the left and right sides of the block, forming a thermal bridge. The optimized hole design is shown in Figure 11. For subsequent comparative analysis, TZ-14 was a simulated block with a 40 mm thick perlite external insulation board. From Figure 11 of heat flux cloud map for the optimized block, it could be observed that these optimized holes effectively prevented edge heat bridges and extend the path for heat flux.
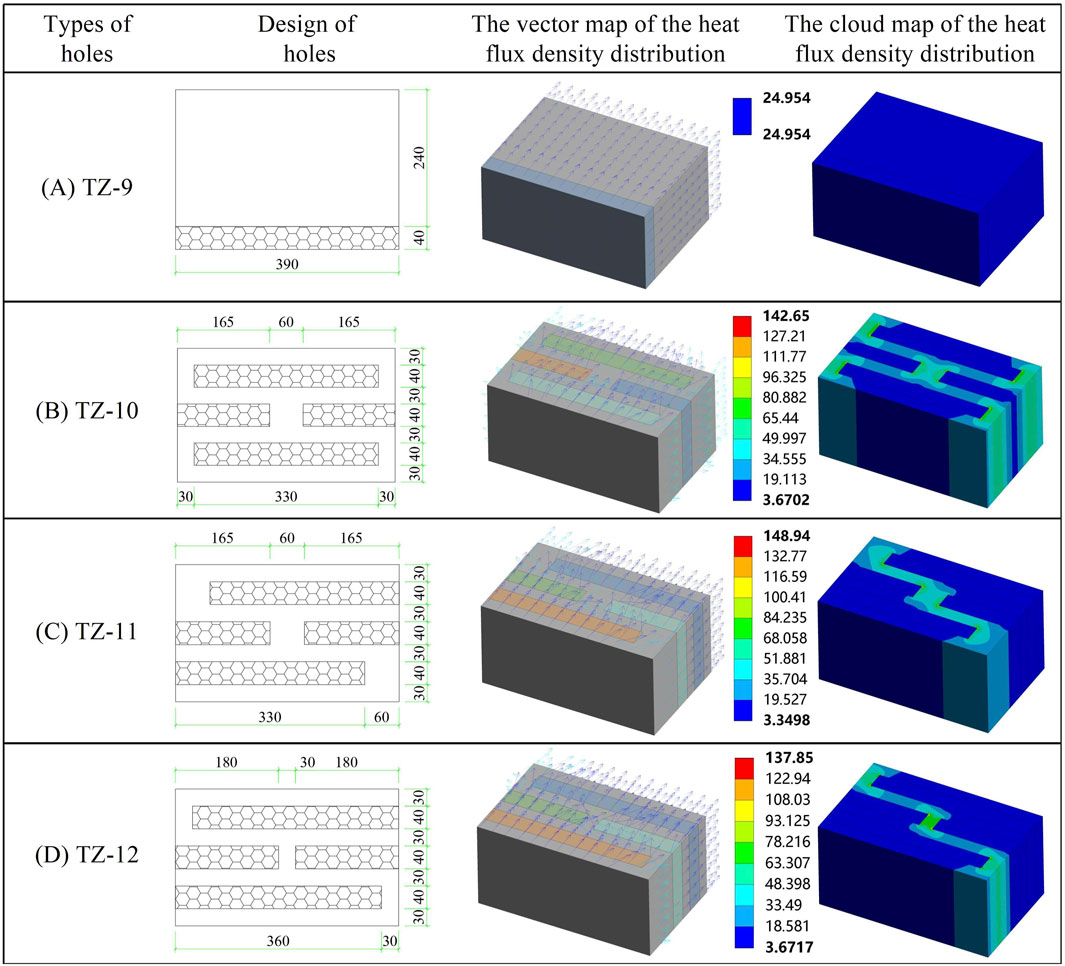
Figure 11. Optimal design of holes and simulated result (Unit: mm and W/m2). (A) TZ-9, (B) TZ-10, (C) TZ-11, (D) TZ-12.
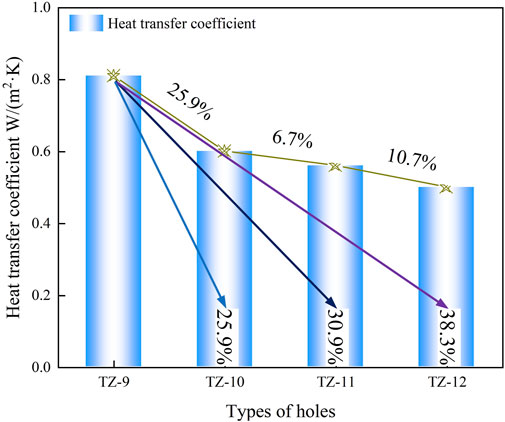
The simulated results of heat transfer coefficient for the block are shown in Figure 12. The study found that: (1) According to the simulated results, the heat transfer coefficients of optimized TZ-10, TZ-11, and TZ-12 were better than those of TZ-9. The optimal hole among them was TZ-12, with a heat transfer coefficient of 0.5 W/(m2·K), which was 38.3% lower than that of the external insulation block TZ-9. (2) The hole rate of TZ-10 and TZ-11 was 42.31%, and the total width of the middle and external heat transfer channels was 60 mm. By comparing the simulated results of TZ-10 and TZ-11, it could be observed that the heat transfer coefficient of the blocks decreased as the number of external heat transfer channels reduced. (3) Comparing the simulated results of TZ-11 and TZ-12, it could be seen that the heat transfer coefficient of the blocks decreased as the width of the heat transfer channel decreased.
3.6 Error analysis
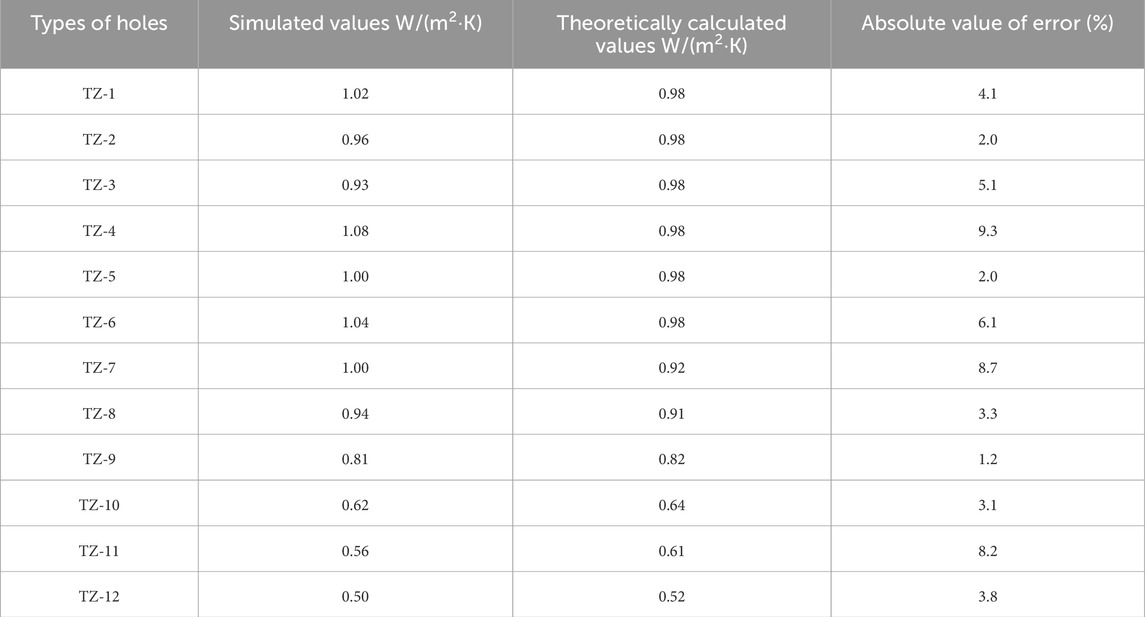
The error analysis of the heat transfer coefficient for the blocks is presented in Table 9. In order to ensure the credibility of the simulation, theoretical calculations were performed to determine the heat transfer coefficient of twelve different types of blocks using Equations 5–12. By comparing these theoretical calculations with the simulated values, it was observed that the discrepancy between the two values for different hole blocks was less than 10%, thus confirming the high accuracy of the numerical simulation method employed in this study [49].
3.7 Compressive strength test
The wooden molds required for the test were fabricated in this study, according to the detailed dimensions of the TZ-12 shown in Figure 11. The mold produced is shown in Figures 13A. The pouring was done using the optimal mix ratio of SCC from Table 7, and the results are shown in Figures 13B, with 5 blocks prepared for each group. Following the relevant provisions of GB/T4111-2013 [50], the compressive strength test of blocks was carried out using the YAW-2000 pressure testing machine, as depicted in Figures 13C.

Figure 13. Experimental procedure of compressive strength for blocks: (A) The mold making. (B) Pouring of blocks. (C) Test of compressive strength.
The compressive strength (
Where:
The proportion of perlite insulation board in TZ-12 was 46.15%. The average compressive strength of TZ-12 was 8.28 MPa, and the minimum compressive strength was 7.45 MPa. Its strength grade met the requirements of MU7.5, and also satisfied the requirement of not less than MU5.0 when self-insulation blocks were used for external walls.
4 Thermal performance analysis of self-insulation wall
4.1 Model building
The structural entity made of SIB with masonry mortar is called the self-insulation concrete compound block masonry (SIBM), and the structural entity made of the SIBM with plaster mortar is called the self-insulation concrete compound block wall (SIBW). JGJ/T323-2014 [51] provides relevant requirements for masonry mortar and ash joints: for the masonry of SIB, when thermal performance is required, the thermal conductivity of special masonry mortar shall not be greater than 0.2 W/(m·K); plastering should be layered, and the total thickness should be 15–20 mm; the horizontal ash joint thickness and vertical ash joint width of SIBW should be 8–12 mm.
The physical model of SIBW was established based on the aforementioned standard regulations. Figures 14A illustrates the physical model of SIBW, with dimensions of 1.6 m × 1.6 m × 0.28 m. The substrate had a thickness of 240 mm, while the masonry ash joints and internal/external plastering had thicknesses of 10 mm and 20 mm respectively. The primary structure for SIBW consisted of TZ-17, while inorganic insulation mortar (with a thermal conductivity of 0.18 W/(m·K)) was utilized for masonry mortar and ordinary cement mortar (with a thermal conductivity of 0.93 W/(m·K)) was employed for plastering purposes.
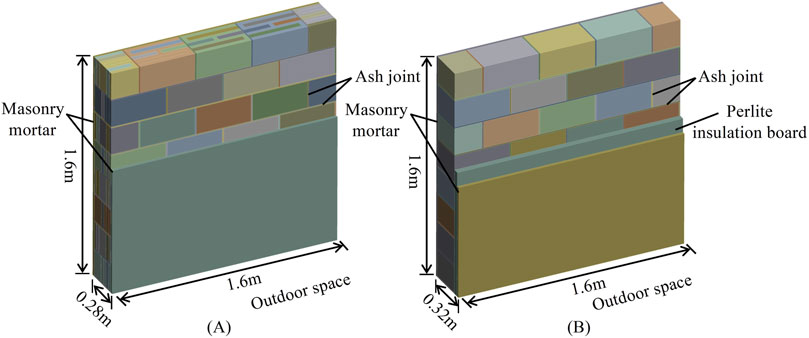
Figure 14. The physical model of wall: (A) The physical model of the SIBW. (B) The Physical model of the ETIW. (The Masonry mortar and Perlite insulation board in this diagram are shown in cross-section).
The external thermal insulation wall (ETIW) consists of the substrate and the external thermal insulation composite system. The external thermal insulation composite system generally includes an insulation layer, a protective layer, and fixing materials, which collectively refer to non-load-bearing insulation structures fixed on the exterior surface of the outer wall.
In order to compare the thermal performance of the SIBW and the common the ETIW, the thermal performance of the ordinary the ETIW with the same material was also simulated. The physical model of the ordinary the ETIW is shown in Figures 14B. The simplified model had dimensions of 1.6 m × 1.6 m × 0.32 m, with a substrate thickness of 240 mm, insulation layer thickness of 40 mm, masonry ash joint thickness of 10 mm, and internal and external plastering thicknesses of 20 mm. The substrate consisted of shale ceramsite concrete solid masonry blocks (with a thermal conductivity of 0.8314 W/(m·K)); the external insulation material used perlite insulation boards (with a thermal conductivity of 0.051 W/(m·K)); both masonry mortar and plaster mortar were made from ordinary cement mortar (with a thermal conductivity of 0.93 W/(m·K)).
4.2 Thermal performance
The indoor ambient temperature was set to 299.15 K (26°C) according to GB50176-2016, with a convection heat transfer coefficient (h1) of the heat surface set at 8.7 W/(m2·K). The outdoor ambient temperature was set to 268.42 K (−4.73°C), and the convection heat transfer coefficient (h2) of the cold surface was set at 23.0 W/(m2·K). (The values were obtained by referring to the average indoor temperature in summer and the average outdoor temperature in winter in Xinyang City, China.)
The numerical simulation of the steady-state heat transfer for the SIBW was conducted. Figures 15A shows the cloud map of the 3D heat flux density distribution of the SIBW, and Figures 15C shows the cloud map of the heat flux density distribution on the top surface of the SIBW. According to Figures 15A, C, the heat flux density at the concrete substrate was highest, while it was lowest at the insulation material. Due to using inorganic thermal insulation mortar with low thermal conductivity for masonry mortar, there was no significant thermal bridge effect in masonry ash joints. The simulated heat flux rate on the wall surface was 15.4 W, and its heat transfer coefficient was 0.56 W/(m2·K), which meets the design standard for achieving a 65% energy saving in residential buildings situated in regions with hot summers and cold winters.
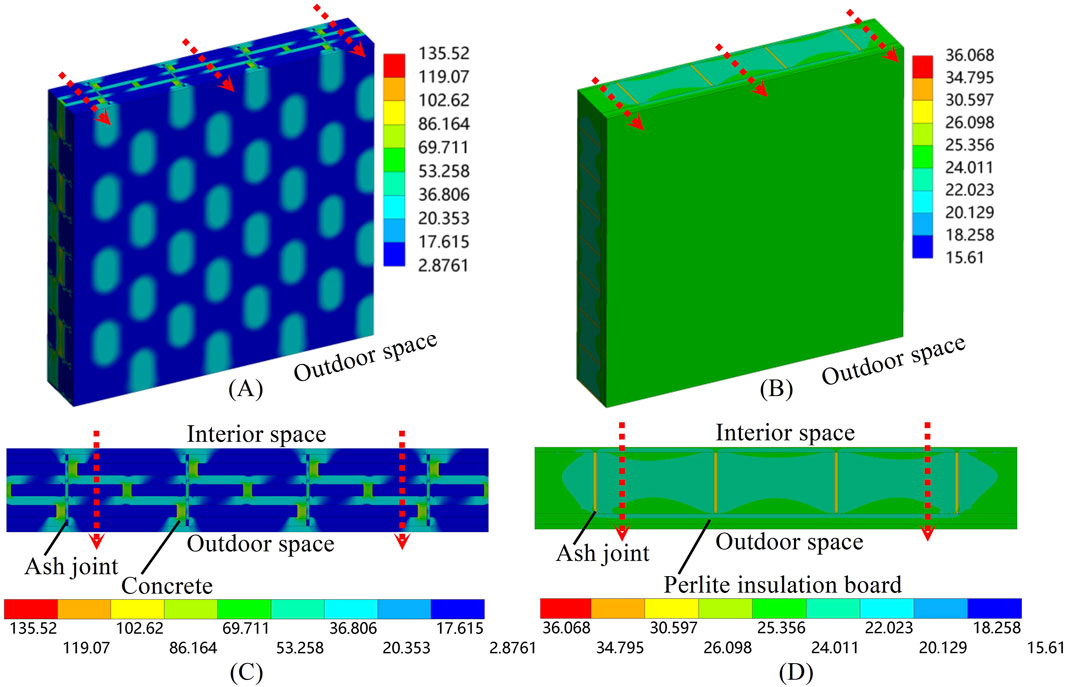
Figure 15. The heat flux density of the wall: (A) The cloud map of the heat flux density distribution for the SIBW. (B) The cloud map of the heat flux density distribution of the ETIW. (C) The cloud map of the heat flux density distribution on the top surface for the SIBW. (D) The cloud map of the heat flux density distribution on the top surface for the ETIW. (The direction of the arrow is the direction of the heat flow. Unit: W/m2).
The numerical simulation of the steady-state heat transfer for the ETIW was conducted. Figures 15B shows the cloud map of the 3D heat flux density distribution of the ETIW, and Figures 15D shows the cloud map of the heat flux density distribution on the top surface of the ETIW. According to Figures 15B–D, the heat flux density at the masonry mortar was the largest and the solid ceramsite concrete blocks was minimal. The simulation showed that the heat flux rate on the wall surface was 24.12 W, and its heat transfer coefficient was 0.79 W/(m2·K). When the heat was transferred to the perlite insulation board on the outside of the wall, the heat flux density was evenly distributed, indicating that the external insulation system can better block the heat bridge effect produced at the ash joints. However, it did not meet the design standard of 65% energy saving in residential buildings situated in regions with hot summers and cold winters.
To sum up, it could be observed that under the same substrate thickness and insulation material for both walls, the heat transfer coefficient of the SIBW was lower, being 29.1% lower than that of the ETIW. This was because the SIBW was the insulation material filled in the hole of the SIB, which could use the insulation material with high thermal resistance to the greatest extent without increasing the thickness of the wall. The thickness of the insulation material for the ETIW often determined the heat transfer coefficient of the wall, which not only reduced the economy of the external insulation system but also increased construction difficulty.
5 Conclusion
In this study, the shale ceramsite concrete (SCC) was prepared as the base material for the blocks through the orthogonal test and range analysis. Subsequently, the influence of different hole type distribution schemes on the thermal performance of self-insulation blocks (SIB) was studied using the Steady-State module of Ansys Workbench. The following conclusions could be drawn:
(1) The orthogonal test employed in this study was a design method used to investigate multiple factors and levels. It selected representative points from the comprehensive test based on orthogonality, making it an efficient, rapid, and cost-effective experimental design method. Through orthogonal test and range analysis, the results showed that:
• i. The compressive strength of the optimal combination (A3B2C3D3) was 52.03 MPa, which was 1.2% higher than that of the optimal blocks in the other 16 groups. The flexural tensile strength of the optimal combination (A3B2C3D3) was 5.13 MPa, which was 1.9% higher than that of the optimal blocks in the other 16 groups. It was verified that A3B2C3D3 is the combination with the optimal mechanical properties.
• ii. The thermal conductivity of SCC (A3B2C3D3) was 0.8314 W/(m·K). It was prepared as the base material of the blocks.
(2) The influence of different hole type distribution schemes on the thermal performance of self-insulation blocks (SIB) was studied using the Steady-State module of Ansys Workbench. The results showed that:
• i. The heat transfer coefficient of blocks gradually decreased with an increase in the number of rows of holes, while the heat transfer coefficient of blocks gradually increased with an increase in the number of columns of holes.
• ii. The staggered holes could improve insulation performance.
• iii. The heat transfer coefficient of the blocks decreased with a reduction in the number of external heat transfer channels and a decrease in the width of the heat transfer channel.
(3) By comparing these theoretical calculations with the simulated values, it was observed that the discrepancy between the two values for different hole blocks was less than 10%, thus confirming the high accuracy of the numerical simulation method employed in this study. According to the simulated results of heat transfer coefficient for the block, it was determined that:
• i. TZ-12 exhibited the optimal hole configuration with a heat transfer coefficient of 0.5 W/(m2·K), which was 38.3% lower than that of the external insulation block TZ-9.
• ii. Additionally, TZ-12 demonstrated the average compressive strength of 8.28 MPa and the minimum compressive strength of 7.45 MPa, meeting the requirements for MU7.5 strength grade and also satisfying the requirement of not less than MU5.0 when self-insulation blocks were used for external walls.
• iii. The simulated heat flux rate of the SIBW was 15.4 W, and its heat transfer coefficient was 0.56 W/(m2·K), which was 29.1% lower than that of the ETIW, meeting the design standard for achieving the 65% energy saving in residential buildings situated in regions with hot summers and cold winters.
Data availability statement
The raw data supporting the conclusions of this article will be made available by the authors, without undue reservation.
Author contributions
QX: Conceptualization, Data curation, Formal Analysis, Funding acquisition, Investigation, Methodology, Project administration, Resources, Software, Supervision, Validation, Visualization, Writing–original draft, Writing–review and editing. HD: Conceptualization, Data curation, Formal Analysis, Funding acquisition, Investigation, Methodology, Project administration, Resources, Writing–original draft, Writing–review and editing. BG: Data curation, Formal Analysis, Funding acquisition, Methodology, Project administration, Resources, Writing–original draft. JZ: Investigation, Methodology, Resources, Software, Supervision, Validation, Visualization, Writing–review and editing.
Funding
The author(s) declare that financial support was received for the research, authorship, and/or publication of this article. This research was sponsored by the Training Scheme for Young Backbone Teachers in Colleges and Universities in Henan Province, No. 2019-163; the Excellent Teaching Case Project of Professional Degree Postgraduates in Henan Province (2022-115); the Scientific Research Foundation of Graduate School of Xinyang Normal University (2024KYJJ107); Special Projects of Key R and D and Promotion in Xinyang City (20220055); and Key Scientific and Technological Projects in Henan Province (232102320196).
Conflict of interest
The authors declare that the research was conducted in the absence of any commercial or financial relationships that could be construed as a potential conflict of interest.
Publisher’s note
All claims expressed in this article are solely those of the authors and do not necessarily represent those of their affiliated organizations, or those of the publisher, the editors and the reviewers. Any product that may be evaluated in this article, or claim that may be made by its manufacturer, is not guaranteed or endorsed by the publisher.
Supplementary material
The Supplementary Material for this article can be found online at: https://www.frontiersin.org/articles/10.3389/fphy.2024.1490012/full#supplementary-material
SUPPLEMENTARY FIGURE S1Test blocks: (A) Test blocks making. (B) Test of compressive strength. (C) Test of flexural tensile strength.
SUPPLEMENTARY FIGURE S2The thermal conductivity of shale ceramsite concrete: (A) Test blocks making. (B) Test of thermal conductivity. (C) DR-3030 double plate thermal conductivity tester.
References
1. Li H, Li Y, Wang Z, Shao S, Deng G, Xue H, et al. Integrated building envelope performance evaluation method towards nearly zero energy buildings based on operation data. Energy and Buildings (2022) 268:112219. doi:10.1016/j.enbuild.2022.112219
2. Guo Y-Y. Revisiting the building energy consumption in China: insights from a large-scale national survey. Energy Sustainable Development (2022) 68:76–93. doi:10.1016/j.esd.2022.03.005
3. Dai J, Wang J, Bart D, Gao W. The impact of building enclosure type and building orientation on indoor thermal comfort ---A case study of Kashgar in China. Case Stud Therm Eng (2023) 49:103291. doi:10.1016/j.csite.2023.103291
4. Hu S, Zhang Y, Yang Z, Yan D, Jiang Y. Challenges and opportunities for carbon neutrality in China’s building sector—modelling and data. Building Simulation (2022) 15:1899–921. doi:10.1007/s12273-022-0912-1
5. Kumar D, Alam M, Zou PXW, Sanjayan JG, Memon RA. Comparative analysis of building insulation material properties and performance. Renew Sustainable Energy Rev (2020) 131:110038. doi:10.1016/j.rser.2020.110038
6. Yang Y, Chen S. Thermal insulation solutions for opaque envelope of low-energy buildings: a systematic review of methods and applications. Renew Sustainable Energy Rev (2022) 167:112738. doi:10.1016/j.rser.2022.112738
7. Lin H, Feng X, Zhang P, Han Y. Technical and economic analysis on self-insulation schemes of 65 percent energy efficiency for residential buildings in hot summer and cold winter zone. Appl Mech Mater (2012) 178–181:209–12. doi:10.4028/www.scientific.net/AMM.178-181.209
8. Ding X, Liu F, Yuan X, Hao J. Experimental study on the shear performance of recycled concrete self-insulating block walls. J Mater Civil Eng (2021) 33:04020456. doi:10.1061/(ASCE)MT.19435533.0003554
9. Abdelmoneim Elamin Mohamad A-B, Chen Z. Experimental and numerical analysis of the compressive and shear behavior for a new type of self-Insulating concrete masonry system. Appl Sci (2016) 6:245. doi:10.3390/app6090245
10. Sassine E, Cherif Y, Dgheim J, Antczak E. Experimental and numerical thermal assessment of Lebanese traditional hollow blocks. Int J Thermophys (2020) 41:47. doi:10.1007/s10765-020-02626-7
11. Zukowski M, Haese G. Experimental and numerical investigation of a hollow brick filled with perlite insulation. Energy and Buildings (2010) 42:1402–8. doi:10.1016/j.enbuild.2010.03.009
12. Jiao Z, Wang Y, Zheng W, Huang W, Zhou X. Use of industrial waste slag in alkali-activated slag ceramsite concrete hollow blocks. Appl Sci (2018) 8:2358. doi:10.3390/app8122358
13. Osman BH, Chen Z, Carroll A, Abuserriya A. Optimisation and design of new energy-saving concrete self-insulation block. Gradevinar (2024) 76:119–37. doi:10.14256/JCE.3821.2023
14. Xie J, Zhao J, Wang J, Huang P, Liu J. Investigation of the high-temperature resistance of sludge ceramsite concrete with recycled fine aggregates and GGBS and its application in hollow blocks. J Building Eng (2021) 34:101954. doi:10.1016/j.jobe.2020.101954
15. Al-Tarbi SM, Baghabra Al-Amoudi OS, Al-Osta MA, Al-Awsh WA, Shameem M, Sharif Zami M. Development of energy-efficient hollow concrete blocks using perlite, vermiculite, volcanic scoria, and expanded polystyrene. Construction Building Mater (2023) 371:130723. doi:10.1016/j.conbuildmat.2023.130723
16. Al-Tamimi AS, Baghabra Al-Amoudi OS, Al-Osta MA, Ali MR, Ahmad A. Effect of insulation materials and cavity layout on heat transfer of concrete masonry hollow blocks. Construction Building Mater (2020) 254:119300. doi:10.1016/j.conbuildmat.2020.119300
17. Topcu IB, Iskdag B. Manufacture of high heat conductivity resistant clay bricks containing perlite. Building Environ (2007) 42:3540–6. doi:10.1016/j.buildenv.2006.10.016
18. Liu D, Qiao L, Li G. Experimental performance measures of recycled insulation concrete blocks from construction and demolition waste. J Renew Mater (2022) 10:1675–91. doi:10.32604/jrm.2022.018397
19. Jaafar AS, Abbas ZK, Allawi AA. Studying sustainable concrete block efficiency production: a review. J Eng (2023) 29:134–49. doi:10.31026/j.eng.2023.09.10
20. Zhao Z, Courard L, Groslambert S, Jehin T, Leonard A, Xiao J. Use of recycled concrete aggregates from precast block for the production of new building blocks: an industrial scale study. Resour Conservation and Recycling (2020) 157:104786. doi:10.1016/j.resconrec.2020.104786
21. Al-Awsh WA, Baghabra Al-Amoudi OS, Al-Osta MA, Ahmad A, Saleh TA. Experimental assessment of the thermal and mechanical performance of insulated concrete blocks. J Clean Prod (2021) 283:124624. doi:10.1016/j.jclepro.2020.124624
22. Chen L, Wang Z, Lian H, Ma Y, Meng Z, Li P, et al. Reduced order isogeometric boundary element methods for CAD-integrated shape optimization in electromagnetic scattering. Computer Methods Appl Mech Eng (2024) 419:116654. doi:10.1016/j.cma.2023.116654
23. Martinez M, Huygen N, Sanders J, Atamturktur S. Thermo-fluid dynamic analysis of concrete masonry units via experimental testing and numerical modeling. J Building Eng (2018) 19:80–90. doi:10.1016/j.jobe.2018.04.029
24. Cao G, Yu B, Chen L, Yao W. Isogeometric dual reciprocity BEM for solving non-Fourier transient heat transfer problems in FGMs with uncertainty analysis. Int J Heat Mass Transfer (2023) 203:123783. doi:10.1016/j.ijheatmasstransfer.2022.123783
25. Al-Tamimi AS, Al-Osta MA, Al-Amoudi OSB, Ben-Mansour R. Effect of geometry of holes on heat transfer of concrete masonry bricks using numerical analysis. Arabian J Sci Eng (2017) 42:3733–49. doi:10.1007/s13369-017-2482-6
26. Al-Awsh WA, Qasem NAA, Baghabra Al-Amoudi OS, Al-Osta MA. Experimental and numerical investigation on innovative masonry walls for industrial and residential buildings. Appl Energy (2020) 276:115496. doi:10.1016/j.apenergy.2020.115496
27. Cuce E, Cuce PM, Besir AB. Improving thermal resistance of lightweight concrete hollow bricks: a numerical optimisation research for a typical masonry unit. J Energy Syst (2020) 4:121–44. doi:10.30521/jes.775961
28. Shuai L, Zhang J, Song J, Chi D, Chen Z. Numerical thermal assessment and theoretical analysis of horizontal-hole interlock composite insulation blocks. Heliyon (2024) 10:e26490. doi:10.1016/j.heliyon.2024.e26490
29. Ouakarrouch M, Laaroussi N, Garoum M, Hajji A. Thermal performances assessment and improvement of hollow concrete blocks commonly used in Morocco: experimental and numerical approach. J Therm Sci Eng Appl (2022) 14:101005. doi:10.1115/1.4054077
30. Blanco JM, Frometa YG, Madrid M, Cuadrado J. Thermal performance assessment of walls made of three types of sustainable concrete blocks by means of FEM and validated through an extensive measurement campaign. Sustainability (2021) 13:386. doi:10.3390/su13010386
31. Li LP, Wu ZG, Li ZY, He YL, Tao WQ. Numerical thermal optimization of the configuration of multi-holed clay bricks used for constructing building walls by the finite volume method. Int J Heat Mass Transfer (2008) 51:3669–82. doi:10.1016/j.ijheatmasstransfer.2007.06.008
32. Bi-chao Y, Zhou H. Thermal performance analysis of concrete small hollow block. Mater Sci Eng (2019) 556:012041. doi:10.1088/1757-899X/556/1/012041
33. Sutcu M, Coz Diaz JJdel, Alvarez Rabanal FP, Gencel O, Akkurt S. Thermal performance optimization of hollow clay bricks made up of paper waste. Energy and Buildings (2014) 75:96–108. doi:10.1016/j.enbuild.2014.02.006
34. Fan L, Zhang Z, Yu Y, Li P, Cosgrove T. Effect of elevated curing temperature on ceramsite concrete performance. Construction Building Mater (2017) 153:423–9. doi:10.1016/j.conbuildmat.2017.07.050
35. Wu X, Wang S, Yang J, Zhu S, Kodama J. Mechanical properties and dynamic constitutive relation of lightweight shale ceramsite concrete. Eur J Environ Civil Eng (2020) 26:2898–912. doi:10.1080/19648189.2020.1782772
36. Wu X, Wang S, Yang J, Zhao J, Chang X. Damage characteristics and constitutive model of lightweight shale ceramsite concrete under static-dynamic loading. Eng Fracture Mech (2022) 259:108137. doi:10.1016/j.engfracmech.2021.108137
37. Xu C, Deng X. Study on preparation of ceramsite from shale slag and its application. Mater Sci Eng (2020) 744:012026. doi:10.1088/1757-899X/744/1/012026
38. JGJ/T12-2019: technical standard for application of lightweight aggregate concrete. Architecture and Building Press Beijing, China. (2019).
39. GB/T50081-2019:Standard for test methods of concrete physical and mechanical properties. Architecture and Building Press Beijing, China. (2019).
40. GB50176-2016:Code for thermal design of civil buildings. Architecture and Building Press Beijing, China. (2016).
41. JG/T407-2013: self-insulation concrete compound blocks. Architecture and Building Press Beijing, China. (2013).
42. GB55015-2021:General code for energy efficiency and renewable energy application in buildings. (2021).
43. Yavagal PS, Kulkarni PA, Patil NM, Salimath NS, Patil AY, Savadi RS, et al. Cleaner production of edible straw as replacement for thermoset plastic. Mater Today (2020) 32:492–7. doi:10.1016/j.matpr.2020.02.667
44. Patil AY, Banapurmath NR, Yaradoddi JS, Kotturshettar BB, Shettar AS, Basavaraj GD, et al. Experimental and simulation studies on waste vegetable peels as bio-composite fillers for light duty applications. Arabian J Sci Eng (2019) 44:7895–907. doi:10.1007/s13369-019-03951-2
45. Patil AY, Hegde C, Savanur G, Kanakmood SM, Contractor AM, Shirashyad VB, et al. Biomimicking nature-inspired design structures—an experimental and simulation approach using additive manufacturing. Biomimetics (2022) 7:186. doi:10.3390/biomimetics7040186
46. Mysore THM, Patil AY, Raju GU, Banapurmath NR, Bhovi PM, Afzal A, et al. Investigation of mechanical and physical properties of big sheep horn as an alternative biomaterial for structural applications. Materials (2021) 14:4039. doi:10.3390/ma14144039
47. Patil VS, Banoo F, Kurahatti RV, Patil AY, Raju GU, Afzal A, et al. A study of sound pressure level (SPL) inside the truck cabin for new acoustic materials: an experimental and FEA approach. Alexandria Eng J (2021) 60:5949–76. doi:10.1016/j.aej.2021.03.074
48. Dhaduti SC, Sarganachari SG, Patil AY, Khan TMY. Prediction of injection molding parameters for symmetric spur gear. J Mol Model (2020) 26:302. doi:10.1007/s00894-020-04560-9
49. Nimbagal V, Banapurmath NR, Sajjan AM, Patil AY, Ganachari SV. Studies on hybrid bio-nanocomposites for structural applications. J Mater Eng Perform (2021) 30:6461–80. doi:10.1007/s11665-021-05843-9
50. GBT4111-2013: test method for concrete block and brick. Architecture and Building Press Beijing, China. (2013).
Keywords: self-insulation concrete compound blocks, ANSYS workbench, heat transfer coefficient, optimization design, energy saving
Citation: Xiao Q, Deng H, Gao B and Zhao J (2024) Design and thermal performance analysis of self-insulation concrete compound blocks. Front. Phys. 12:1490012. doi: 10.3389/fphy.2024.1490012
Received: 02 September 2024; Accepted: 15 November 2024;
Published: 04 December 2024.
Edited by:
Leilei Chen, Huanghuai University, ChinaReviewed by:
Arun Y. Patil, Manipal Institute of Technology Bengaluru, IndiaAng Zhao, Shanghai Civil Aviation College, China
Copyright © 2024 Xiao, Deng, Gao and Zhao. This is an open-access article distributed under the terms of the Creative Commons Attribution License (CC BY). The use, distribution or reproduction in other forums is permitted, provided the original author(s) and the copyright owner(s) are credited and that the original publication in this journal is cited, in accordance with accepted academic practice. No use, distribution or reproduction is permitted which does not comply with these terms.
*Correspondence: Qidan Xiao, eGlhb3FpZGFuMjUzQDE2My5jb20=
 Qidan Xiao
 Hui Deng1,2
