ORIGINAL RESEARCH article

Front. Phys., 13 December 2024
Sec. Condensed Matter Physics
This article is part of the Research Topic Current Research On Spin Glasses View all 11 articles

Investigation of experimental signatures of spin glass transition temperature

Sahil Pradhan
Sahil Pradhan1*David HarrisonDavid Harrison2Gregory KenningGregory Kenning3Deborah L. SchlagelDeborah L. Schlagel4Samaresh GuchhaitSamaresh Guchhait1
  • 1Department of Physics and Astronomy, Howard University, Washington, DC, United States
  • 2School of Physics and Astronomy, The University of Minnesota, Minneapolis, MN, United States
  • 3Department of Physics, Indiana University of Pennsylvania, Indiana, PA, United States
  • 4Division of Materials Science and Engineering, Ames Laboratory, Ames, IA, United States

We present a series of temperature and field-dependent magnetization studies of large single-crystal spin glass samples, focusing on both field-cooled (FC) and zero-field-cooled (ZFC) magnetization studies, as well as ac susceptibility measurements. Using the above experimental techniques we aim to understand the nature of spin glass transition in presence of a field, a key factor in understanding the properties of these systems. Building on previous studies that have explored magnetic signatures indicative of spin glass transitions, our research employs a systematic approach to refine the identification of this transition temperature. Through static and dynamic measurements, we aim to shed light on the open issues regarding the key markers of spin glass transitions, enhancing our understanding of these complex systems.

1 Introduction

Over the years experimentalists have used a series of techniques to “determine” the spin glass phase transition temperature Tg. This value is then often used (usually as an energy scale) in theoretical explanations of various effects within the spin glass phase, such as aging. If these techniques actually determined the phase transition temperature Tc, then one might expect the measured Tg to be the same for all of these techniques and the values to have similar behavior, for example, as a function of magnetic field. This manuscript provides the first comparative analysis of these techniques.

AC and DC magnetic susceptibility measurements under varying conditions are important for understanding the properties of spin glasses. Early seminal work by Cannella and Mydosh [1] highlighted the critical importance of ac susceptibility studies in exploring the magnetic properties of gold-iron alloys, particularly noting the presence of a susceptibility cusp indicative of a possible phase transition in this system. With further exploration, it was found that this characteristic curve exhibited a time-dependent behavior, adding a dynamic complexity to the magnetic response of such materials [2]. Moreover, the “static” magnetization measurements, specifically field-cooled (FC) and zero-field-cooled (ZFC) magnetization studies, have been important in characterizing spin glass behavior. These methods, discussed extensively by Kenning et al. [3, 4], serve as fundamental techniques to determine the onset of spin glass ordering. The FC and ZFC magnetization measurements were first performed by T. Mizoguchi et al. [5] and later adopted by other researchers working on other spin glasses, such as Cu:Mn [6] and Au:Fe [7, 8]. Subtracting the ZFC magnetization from the FC magnetization shows the onset of irreversible behavior. This is an indication of non-equilibrium state of the spin glass phase. The bifurcation temperature of the FC and ZFC magnetization curves is magnetic field dependent, and pinpoints the temperature at which the magnetic irreversibility begins. In this manuscript, we’ll call this temperature Tgirr(H).

Lévy [9] found, in a Ag:Mn spin glass, that at low frequencies ( 0.1 Hz) the peak is not time-dependent. They interpreted this as a finite size effect caused by the critical correlation length reaching the sample size. They measured the non-linear susceptibility, revealing critical behavior and extrapolated singularities at the spin glass phase transition temperature Tc. This work reveals how higher-order non-linear susceptibilities, like χ3, χ5, and χ7, diverge at Tc when approached from the high temperature side. Further research by Levy and Ogielski [10] provides strong experimental evidence of phase transition in Ag:Mn, characterizing the power-law divergences of nonlinear susceptibilities, and their critical scaling in the vicinity of Tc. However, the relationship between this divergence at Tc, the well-documented susceptibility cusp, and the various other transition temperatures identified through FC and ZFC measurements remains poorly explored and understood. More recently, measurements on the same single crystal sample discussed in this paper, report critical scaling, with a transition temperature Tc=32.4 K [4]. In this paper, we consider Tc as the actual phase transition temperature.

Experimentally, both ac and “static” or dc measurement techniques (i.e., FC and ZFC magnetizations), have been used as a rough estimate of the transition temperature. Kenning et al. [11], working on a poly-crystalline Cu0.94 Mn0.06 sample, defined the onset of irreversibility as the difference between field-cooled and zero-field-cooled magnetization. For this sample, they determined Tgirr(H0)=31.5 K. Coincidentally the single crystal Cu0.94 Mn0.06 sample used in this study was also found to have Tgirr(H0)31.5 K, so we can directly compare these samples with each other. Other researchers have taken the peak of the ZFC magnetization [12] or the peak in the FC magnetization [13] as the spin glass transition temperature [12]. We label this transition temperature as TgZFC and TgFC, respectively. The peak in the ac susceptibility has also been used as a transition temperature [1]. We’ll call this temperature Tgac.

In this paper, we conduct a systematic examination of these techniques. We’ll evaluate the relationship of these transition temperatures with each other, and their relationship to the critical transition temperature Tc. We assess whether these different indicators of transition temperature are consistent with each other or they differ. Previous studies used poly-crystalline samples for these experiments. Due to the long timescales associated with the spin glass phase, all measurement techniques below the spin glass phase transition temperature measure non-equilibrium phenomena. In this study, we use a single crystal Cu0.94 Mn0.06 sample, and a comparative study will allow us to explore the role of finite size effects in determining the transition temperature [1416].

One issue with comparing metallic spin glasses is that the transition temperature is strongly sensitive to the concentration of the magnetic constituent. For example, Vier et al. found that in Cu:Mn the transition temperature (determined by the peak in the DC FC-magnetization) increases by 4–5 K for every % increase in Mn [13]. Therefore comparisons are difficult unless one is working on the same sample. In this study, we are comparing the results of different techniques used to measure the glass transition temperature. If all of these techniques actually define the glass transition temperature then we might expect that all of these measurements would imply the same transition temperatures and this transition temperature would have similar properties as a function of magnetic field. In this study, we chose a Cu:Mn (6%) single crystal sample for our measurements. Cu:Mn is the most studied spin glass and often termed the canonical spin glass. We expect the results found in this paper to not only extend to other concentrations of Cu:Mn but also to hold for other metallic spin glasses such as Ag:Mn and Au:Fe. While further experiments will test this hypothesis, this comparison is a starting point for analysis.

2 Experimental methods

All samples used in this study are cut from a single crystal Cu0.94 Mn0.06 boule, grown by the Bridgman method at the Materials Preparation Center (MPC) of Ames Laboratory [17]. Measurements performed at the University of Minnesota (UM) used a Quantum Design MPMS-5S DC SQUID magnetometer. In performing both the FC and ZFC measurements, the MPMS-5S took sequential temperature points every 110 s. This is similar to measurements of the polycrystalline Cu0.94 Mn0.06 spin glass taken on the SHE model 90 RF SQUID magnetometer in Ref. [11]. Howard University (HU) measurements were taken with a Quantum Design 9 T PPMS Dynacool vibrating sample magnetometer (VSM). The sample at Howard University had a weight of 134.68 mg and approximate dimensions of 2 mm × 2 mm × 3 mm. The PPMS experimental procedure began by cooling the sample down to 2 K in the absence of any external magnetic field from a temperature well above the glass transition temperature. Subsequently, a magnetic field (H) is applied, and sample magnetization at different temperature is measured while temperature is incrementally increased by 0.2 K, reaching a maximum of 50 K. These measurements define the zero-field cooled magnetization (MZFC). Following this, the temperature is lowered down to 2 K while maintaining the same magnetic field, and measurements are taken at the same temperatures. These measurements are defined as the field-cooled magnetization (MFC). For both the described processes, the temperature was gradually adjusted at a rate of 0.5 K/min using a no-overshoot approach. At each measurement point, the system was allowed to stabilize for 20 s before recording data for 10 s. The same procedure was repeated for different fields between 3 and 20,000 Oe. For the University of Minnesota experiments, the sample was initially cooled to 20 K in absence of any magnetic field. After temperature stabilization, a magnetic field was applied. The temperature was then increased in stages. First, it was raised to 28 K with 2 K increments. Following this, the temperature increment is reduced to 0.2 K per step, continuing until it reached 33 K. Finally, from 34 K onwards, the temperature was again increased in 2 K increments up to 50 K. Only low fields (1, 2, 5, 10, 20, and 30 Oe) measurements were made with the MPMS-5S SQUID magnetometer at the University of Minnesota.

3 Results

Figure 1 shows FC and ZFC magnetization curves of Cu0.94 Mn0.06 single crystal sample for various fields between 3 and 96 Oe. We note that the temperatures associated with the peak in the ZFC curves, do not change with the magnetic field. In Figure 1, it is clear that all the ZFC curve peaks align with the vertical straight line, which is positioned at 28.8 K. This observation suggests that the ZFC peak is independent of the external magnetic field. However, the onset of irreversibility, which is defined as the bifurcation point between MFC and MZFC curves, changes with the applied field. Figures 2A–F displays low-field FC and ZFC magnetization curves measured at the University of Minnesota using a MPMS-5S SQUID magnetometer. The two important features that we observed in Figure 1 can also be seen in the University of Minnesota data, i.e., (a) the peak of the ZFC remains constant and (b) as the magnetic field increases, the irreversibility onset temperature decreases. For the sample measured at Howard University, the peak of the ZFC curve occurs at a slightly lower temperature, 28.8 K than the peak of the ZFC curve of the sample measured at the University of Minnesota which occurs at approximately 30.7 K. We believe this difference may be due to differences in the temperature control systems of the two different magnetometers used to measure the data. Because of this, the data obtained at Howard University is re-scaled so that it’s consistent with the University of Minnesota studies and the studies of Kenning et al. [4]. Figure 3 shows the temperature dependent FC and ZFC plots in higher magnetic fields. We observe that the cusp in the MZFC becomes less pronounced and levels off as the magnetic field increases. With increasing magnetic field we observe that the onset of irreversibilty moves towards the lower temperature side consistent with observations reported earlier [11].
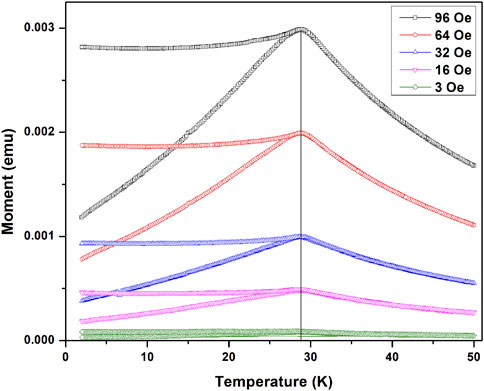
Figure 1
www.frontiersin.org

Figure 1. Temperature dependent FC and ZFC magnetization curves of a single crystal Cu0.94 Mn0.06 sample for different constant DC magnetic fields between 3 and 96 Oe. This data show the peak temperature (vertical line) of ZFC magnetization does not change with applied field, but the onset of irreversibility temperature changes. These measurements are performed at Howard University.
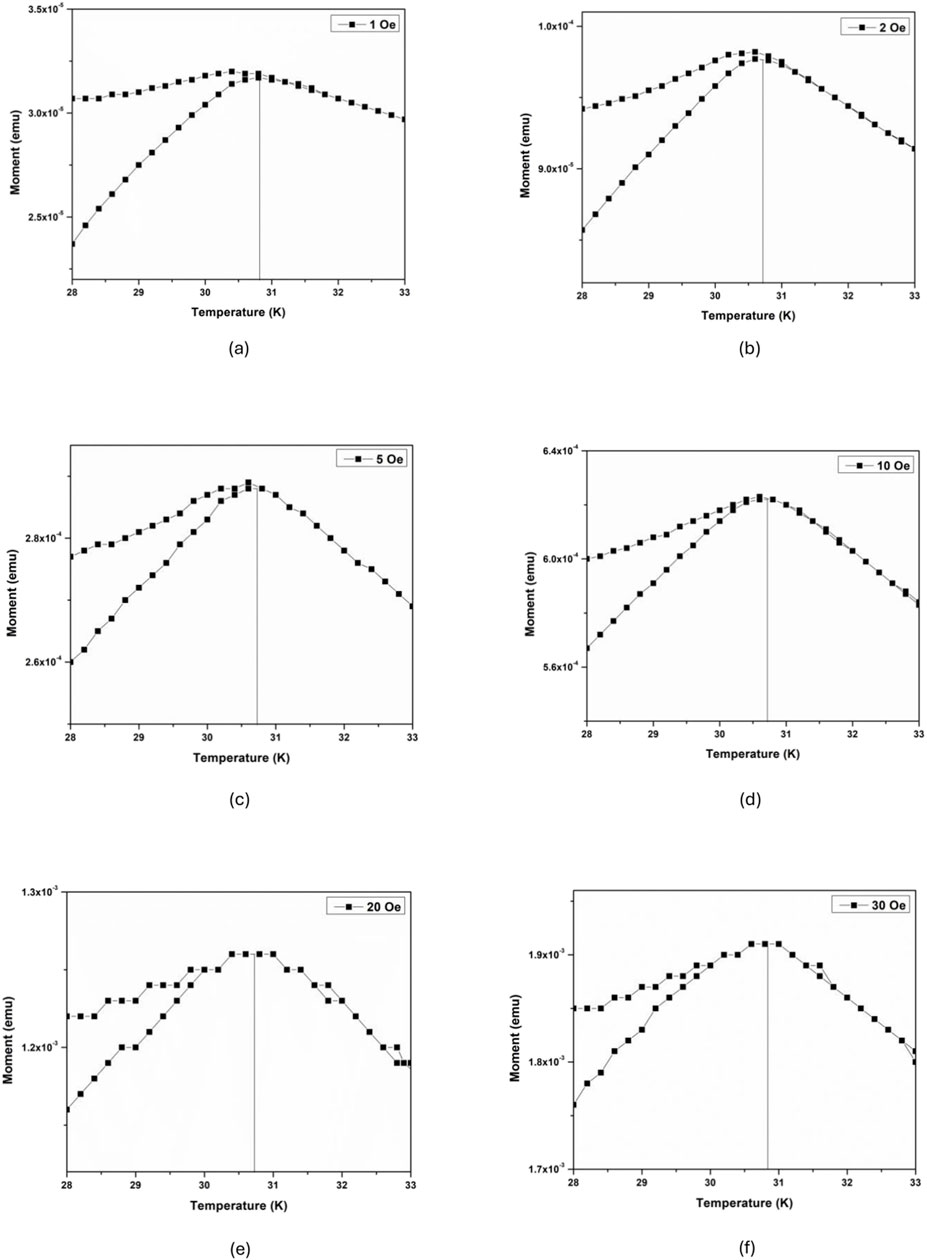
Figure 2
www.frontiersin.org

Figure 2. Field-cooled and zero-field-cooled magnetization plots vs. temperature for different fields: (A) 1, (B) 2, (C) 5, (D) 10, (E) 20, and (F) 30 Oe. This data indicate that the ZFC magnetization peak temperature does not shift with applied magnetic field, but the irreversibility onset temperature lowers with increasing field. The data was taken using a MPMS-5S SQUID Magnetometer at the University of Minnesota.
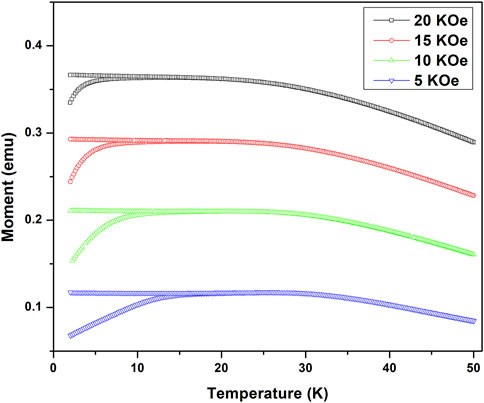
Figure 3
www.frontiersin.org

Figure 3. The field-cooled (FC) and zero-field-cooled (ZFC) curves as a function of temperature for higher fields (5, 10, 15, and 20 kOe). These measurements were performed at Howard University.

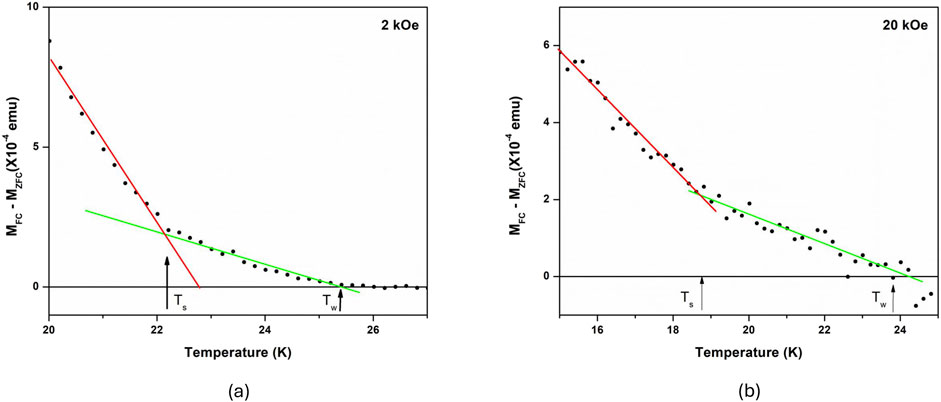
The difference between field-cooled magnetization and zero-field-cooled magnetization defines the irreversible magnetization (Mirr=MFCMZFC). The irreversibility onset temperature has been used as the spin glass transition temperature [11]. In contrast to the behavior of the peak in the ZFC curve, this irreversibility onset temperature shows a downward shift with increasing magnetic field strength. This phenomenon has been interpreted as the de Almeida-Thouless (AT) line. The Mean Field Theory predicts a magnetic field dependent phase transition that scales with the magnetic field as Tc(0)Tc(H)H23, the de Almeida-Thouless (AT) line [11, 18]. Figures 4A–F and Figures 5A, B shows the MFCMZFC vs. temperature plots for different fields. A closer inspection of Figure 4 shows that for low magnetic fields there are two distinct regions: 1) a high temperatures paramagnetic region without any irreversibility, and 2) a low temperature region with irreversibility. This suggests that at low fields (<100Oe) the system behaves like an Ising-like spin glass just below the transition temperature where it exhibits only one single transition [19], which is an indication of longitudinal freezing [20].
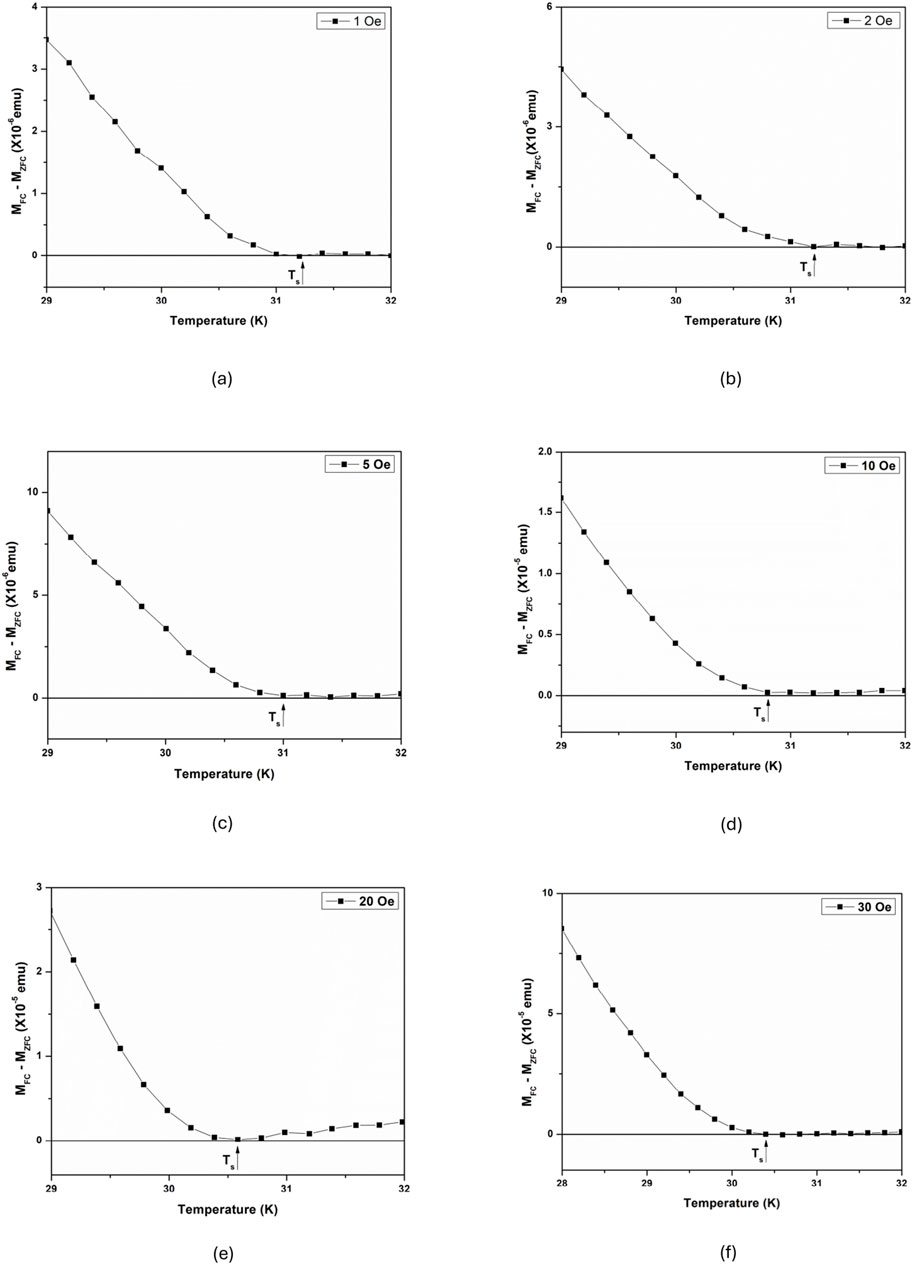
Figure 4
www.frontiersin.org

Figure 4. Plot of MFCMZFC vs. temperature for a dc field of (A) 1 Oe, (B) 2 Oe, (C) 5 Oe, (D) 10 Oe, (E) 20 Oe, and (F) 30 Oe.

Figure 5
www.frontiersin.org

Figure 5. (A) A plot of MFCMZFC vs. temperature for an external field of (A) 2 kOe measured at a temperature increment of 0.2 K, and (B) 20 kOe measured at a temperature increment of 0.2 K. These data show presence of two transitions below the paramagnetic phase. These measurements are performed at Howard University.

Figure 5 shows the same study for high magnetic fields (> 500 Oe). There are three distinct regions in temperature-dependent irreversible magnetization plots: 1) a high temperatures paramagnetic region with no irreversibility, 2) the onset of a low-temperature weak irreversibility just below the transition, and 3) the onset of a stronger irreversibility at even lower temperature. The existence of these three regions have been reported before in Ref. [11]. The onset temperature of weak irreversibility, Tw, is determined by fitting a straight line to the weak irreversible magnetization right below the transition temperature. Subsequently, the temperature at which the irreversible magnetization first departed from weak irreversibility as temperature decreased further from Tw was recognized as the onset of strong irreversibility, denoted as Ts. These two transitions are shown in Figures 4, 5, although Figures 4A–F show only weak irreversibility transition. The onset temperature of the weak irreversibility transition in high field has been associated with the Gabay-Toulouse transition for Heisenberg spin glass [20, 21], where the transverse components of the spin freeze out [22]. Moreover, the onset temperature of the strong irreversibility has been associated with the de Almeida-Thouless transition [18] where the longitudinal components of the spin also freeze out. However, for the low fields, we only observe a single transition, consistent with the previous report [11].

The temperature and field-dependent ac magnetic susceptibility (χ) studies conducted on the Cu0.94 Mn0.06 crystal provide further insights into the material’s spin glass properties. Figures 6A, B illustrate the real part of ac magnetic susceptibility plotted against temperature across a range of frequencies from 80 to 10,000 Hz. The shape of χ mirrors the ZFC (DC) magnetization presented in Figure 1 (which is considered a low frequency measurement). This equivalence arises because the frequency of the ac measurement corresponds to the inverse of the duration spent at each temperature step during the ZFC heating process [23]. One prominent observation from these figures is the shifting of the cusp of the real part of susceptibility towards lower temperatures as the frequency decreases. Also, there is a corresponding reduction in the intensity of the peaks. This drop in χ amplitude with increasing frequency is likely due to the skin depth effects [24] which will be explored further.
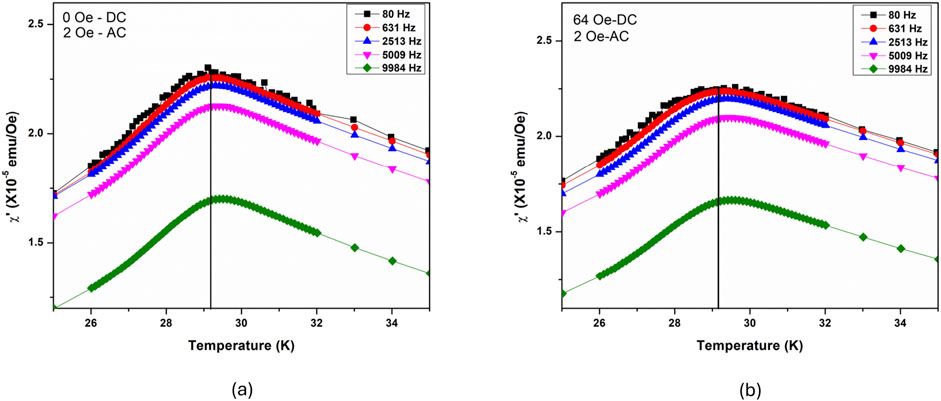
Figure 6
www.frontiersin.org

Figure 6. Real part of susceptibility (χ) vs. temperature for different frequencies at constant (A) 0 Oe DC field, and (B) 64 Oe DC field.

To further explore the spin glass behavior of the Cu0.94Mn0.06 sample, ac magnetic susceptibility measurements were made in a constant magnetic field, with magnetic fields ranging from 0 to 64 Oe. Figure 7 shows the corresponding plots obtained from these experiments. Remarkably, despite the variation in static magnetic field strength, the peak of the susceptibility curve remains unchanged. Extrapolating the time dependence of the ac susceptibility, we find that the peak temperature of the ac susceptibility crosses the peak temperature of both the FC and ZFC peaks between 0.16 and 1 Hz (shaded region in Figure 7). This is very near the frequency region where Lévy [9] observe that the ac susceptibility peak no longer shifts (or shifts much more slowly) as a function of decreasing frequency. This observation aligns with the behavior observed in the ZFC and FC magnetization, where the peak position remains constant irrespective of the applied magnetic field (for low fields).
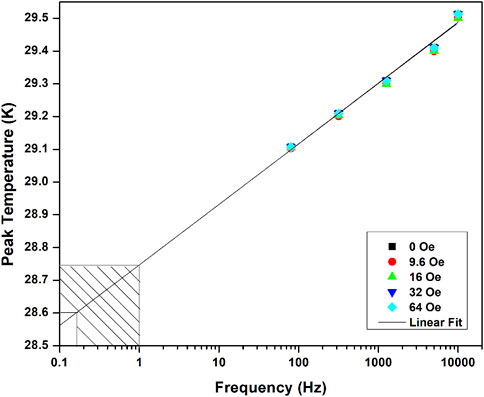
Figure 7
www.frontiersin.org

Figure 7. Peak temperature of ac susceptibility (χ) curves for different frequencies and fields. The shaded region indicates the range where the peak temperature of χ intersects the peak temperatures of both the FC and ZFC curves.

Figure 8 is a plot of the magnetic field (H) vs. various transition temperatures for several different types of experimental studies. For a better comparison of all these studies, we have plotted these transition temperatures: TgFC, TgZFC, Tgac, and Tgirr, as a function of the reduced temperature (defined as T/TgZFC), where TgZFC is the peak temperature of respective ZFC magnetization. All the data has been plotted with respect to the reduced temperature. This temperature normalization is important because now we can compare all the results obtained from different experiments. The results are quite interesting. Except the irreversibility onset temperature, all other transition temperatures in Figure 8 are magnetic field independent.
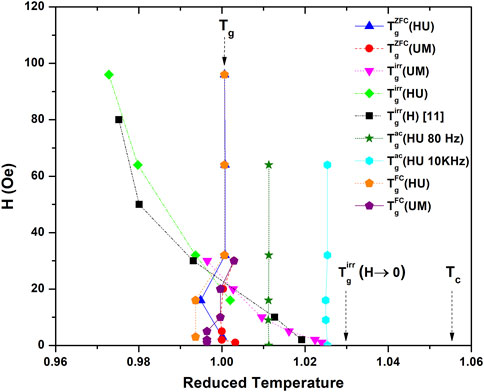
Figure 8
www.frontiersin.org

Figure 8. A comparison of different datasets plotted against the reduced temperature. TgZFC (HU), TgFC (HU) corresponds to the peak of the ZFC curves and FC curves and Tgirr (HU) corresponds to the onset of irreversibility in Figure 1. TgZFC (UM), TgFC (UM) [from Figure 2] and Tgirr (UM) [from Figure 4] correspond to the peak temperature of ZFC, FC, and the onset temperature of irreversibility, respectively. Tgac (HU 80 Hz) and Tgac (HU 10 KHz) [from Figures 6A, B] is the peak of the χ curve. Tgirr(H) refers to the onset temperature of irreversibility in Ref. [11]. Here, the reduced temperature = T/TgZFC, where T is the measurement temperature and TgZFC is the peak of the respective ZFC magnetization curve [12].

4 Discussion

The comparison of different techniques for determining Tg depicts some interesting results in Figure 8. First, the peaks in the FC magnetization and peaks in the ZFC magnetization (within error limits) occur at the same temperature. Second, they (and the ac susceptibility) are magnetic field independent in the measurement range between 1 and 100 Oe. Third, the time dependence of the peak in the ac susceptibility extrapolates to the “static” Tg determined by the FC and ZFC peaks. All three of these methods suggest a single magnetic field independent temperature which we will call Tg.

The question remains, “Is the Tg as defined above, the critical phase transition temperature Tc”? Probably the strongest evidence for Tg=Tc is the previously described study of the non-linear susceptibility by Lévy [9]. While the spin glass phase transition temperature may occur at the above defined Tg, there are some issues which argue for a slightly higher value of Tc.

First, in low magnetic fields, the onset of irreversibility (the difference between the FC and ZFC magnetizations) begins at a temperature above Tg and then as the magnetic field is increased, the onset of irreversibility shifts through Tg to lower temperatures (Figure 8). This effect is highly reproducible with three examples in this paper (including single crystal and polycrystalline samples), and has been observed in other types of spin glasses such as the chromium thiospinel compound CdCr1.7 In0.3 S4 [25]. In higher magnetic fields (i.e., H>10 Oe) the peaks in the FC and ZFC magnetizations overlap looking effectively reversible. Reversibility in spin glasses is generally observed above the phase transition temperature in the paramagnetic state. While it is possible that the irreversibility above Tg (low magnetic fields) is due to the growth of spin glass correlations in the paramagnetic phase, as a function of magnetic field, the onset of irreversibility seamlessly transitions through Tg. If Tg is the phase transition temperature, a discontinuity or change in the irreversible magnetization might be expected at that temperature.

A second issue with the above definition of Tg is following. The Mean Field theory predicts an AT line which shows that the transition temperature is dependent on the magnetic field. The peaks in the FC and ZFC are independent of the magnetic field whereas the onset of irreversibility decreases as the magnetic field increases in a manner consistent with an AT line [11]. It is however unclear in the theory how large this shift should be, over the magnetic field range that we are exploring. It is possible that this is a very small shift and unobservable in the range we are exploring leading to no observation of a field dependence.

Finally, on the same samples, Ref. [4] observes a continuous decrease in the timescale tweff associated with aging in the spin glass phase, right up to and at, the above defined temperature Tg. Aging is observed in the spin glass remnant magnetization and is associated with the spin glass phase. Above Tg, both the magnetization signal and tweff move outside the window of their experimental resolution and time scale. The continuous decease in both the magnetization and tweff implies that aging will continue above Tg. In Ref. [11] an argument is made for a phase transition temperature of Tc=1.055Tg.

5 Summary

In summary, we conducted a thorough investigation involving static measurements, (FC and ZFC) magnetization measurements, and dynamic measurements, (ac susceptibility) on a single crystal Cu0.94 Mn0.06 sample. We observe that the peak of the FC and ZFC magnetizations remains constant as a function of magnetic field at least for the low fields, while the onset of irreversibility moves down to lower temperatures with increasing magnetic field and intersects the position of the ZFC peak. We also note that the peak of the χ (80 Hz) remains constant as a function of fields at 0.963Tc, which corroborates the stability of the ZFC curve’s peak.

Data availability statement

The raw data supporting the conclusions of this article will be made available by the authors, without undue reservation.

Author contributions

SP: Data curation, Formal Analysis, Investigation, Methodology, Writing–original draft, Writing–review and editing. DH: Methodology, Writing–review and editing. GK: Funding acquisition, Investigation, Methodology, Project administration, Supervision, Writing–review and editing, Conceptualization, Writing–original draft. DS: Methodology, Writing–review and editing. SG: Conceptualization, Funding acquisition, Investigation, Supervision, Writing–review and editing, Writing–original draft.

Funding

The author(s) declare that financial support was received for the research, authorship, and/or publication of this article. This work is supported by the NSF Award No. DMR-2018579. This work was supported in part by the U.S. Department of Energy, Office of Science, Office of Basic Energy Sciences, Division of Materials Science and Engineering, under Award No. DE-SC0013599. Part of the research was performed at the Ames National Laboratory, which is operated for the U.S. DOE by Iowa State University under Contract No. DE-AC02-07CH11358. Part of this work was performed at the Institute for Rock Magnetism (IRM) at the University of Minnesota. The IRM is a US National Multi-user Facility supported through the Instrumentation and Facilities program of the National Science Foundation, Earth Sciences Division, award NSF-EAR 2153786, and by funding from the University of Minnesota.

Acknowledgments

We sincerely thank Raymond L. Orbach and E. Dan Dahlberg for their insightful conversations, which greatly contributed to this work.

Conflict of interest

The authors declare that the research was conducted in the absence of any commercial or financial relationships that could be construed as a potential conflict of interest.

Publisher’s note

All claims expressed in this article are solely those of the authors and do not necessarily represent those of their affiliated organizations, or those of the publisher, the editors and the reviewers. Any product that may be evaluated in this article, or claim that may be made by its manufacturer, is not guaranteed or endorsed by the publisher.

References

1. Cannella V, Mydosh JA. Magnetic ordering in gold-iron alloys. Phys Rev B (1972) 6:4220–37. doi:10.1103/physrevb.6.4220

CrossRef Full Text | Google Scholar

2. Mulder C, Van Duyneveldt A, Mydosh J. Susceptibility of the cu mn spin-glass: frequency and field dependences. Phys Rev B (1981) 23:1384–96. doi:10.1103/physrevb.23.1384

CrossRef Full Text | Google Scholar

3. Kenning G, Chu D, Alavi B, Hammann J, Orbach R. Magnetic-field dependence of tg in bulk cu: Mn and cu: Mn/cu multilayer systems. J Appl Phys (1991) 69:5240–2. doi:10.1063/1.348091

CrossRef Full Text | Google Scholar

4. Kenning GG, Brandt M, Brake R, Hepler M, Tennant D. Observation of critical scaling in spin glasses below tc using thermoremanent magnetization. Front Phys (2024) 12:1443298. doi:10.3389/fphy.2024.1443298

CrossRef Full Text | Google Scholar

5. Mizoguchi T, McGuire T, Kirkpatrick S, Gambino R. Measurement of the spin-glass order parameter in amorphous gd0.37al0.63. Phys Rev Lett (1977) 38:89–92. doi:10.1103/physrevlett.38.89

CrossRef Full Text | Google Scholar

6. Nagata S, Keesom P, Harrison H. Low-dc-field susceptibility of cu mn spin glass. Phys Rev B (1979) 19:1633–8. doi:10.1103/physrevb.19.1633

CrossRef Full Text | Google Scholar

7. Kinzel W. Remanent magnetization in spin-glasses. Phys Rev B (1979) 19:4595–607. doi:10.1103/physrevb.19.4595

CrossRef Full Text | Google Scholar

8. Senoussi S, Elkhatouri D. Field and temperature behaviour of the zero field cooled and the field cooled magnetization of au22fe18. J Magnetism Magn Mater (1986) 54:153–4. doi:10.1016/0304-8853(86)90528-7

CrossRef Full Text | Google Scholar

9. Lévy LP. Critical dynamics of metallic spin glasses. Phys Rev B (1988) 38:4963–73. doi:10.1103/physrevb.38.4963

CrossRef Full Text | Google Scholar

10. Levy LP, Ogielski AT. Nonlinear dynamic susceptibilities at the spin-glass transition of ag: Mn. Phys Rev Lett (1986) 57:3288–91. doi:10.1103/physrevlett.57.3288

PubMed Abstract | CrossRef Full Text | Google Scholar

11. Kenning G, Chu D, Orbach R. Irreversibility crossover in a cu: Mn spin glass in high magnetic fields: evidence for the gabay-toulouse transition. Phys Rev Lett (1991) 66:2923–6. doi:10.1103/physrevlett.66.2923

PubMed Abstract | CrossRef Full Text | Google Scholar

12. Sandlund L, Granberg P, Lundgren L, Nordblad P, Svedlindh P, Cowen J, et al. Dynamics of cu-mn spin-glass films. Phys Rev B (1989) 40:869–72. doi:10.1103/physrevb.40.869

PubMed Abstract | CrossRef Full Text | Google Scholar

13. Vier D, Schultz S. Evidence for multiple mechanisms contributing to the transition temperature in metallic spin-glasses. Phys Rev Lett (1985) 54:150–3. doi:10.1103/physrevlett.54.150

PubMed Abstract | CrossRef Full Text | Google Scholar

14. Guchhait S, Kenning GG, Orbach RL, Rodriguez GF. Spin glass dynamics at the mesoscale. Phys Rev B (2015) 91:014434. doi:10.1103/physrevb.91.014434

CrossRef Full Text | Google Scholar

15. Zhai Q, Harrison DC, Tennant D, Dahlberg ED, Kenning GG, Orbach RL. Glassy dynamics in cumn thin-film multilayers. Phys Rev B (2017) 95:054304. doi:10.1103/physrevb.95.054304

CrossRef Full Text | Google Scholar

16. Kenning GG, Tennant DM, Rost CM, da Silva FG, Walters BJ, Zhai Q, et al. End of aging as a probe of finite-size effects near the spin-glass transition temperature. Phys Rev B (2018) 98:104436. doi:10.1103/physrevb.98.104436

CrossRef Full Text | Google Scholar

17. Zhai Q, Martin-Mayor V, Schlagel DL, Kenning GG, Orbach RL. Slowing down of spin glass correlation length growth: simulations meet experiments. Phys Rev B (2019) 100:094202. doi:10.1103/physrevb.100.094202

CrossRef Full Text | Google Scholar

18. de Almeida JR, Thouless DJ. Stability of the sherrington-kirkpatrick solution of a spin glass model. J Phys A: Math Gen (1978) 11:983–90. doi:10.1088/0305-4470/11/5/028

CrossRef Full Text | Google Scholar

19. Kotliar G, Sompolinsky H. Phase transition in a dzyaloshinsky-moriya spin-glass. Phys Rev Lett (1984) 53:1751–4. doi:10.1103/physrevlett.53.1751

CrossRef Full Text | Google Scholar

20. Gabay M, Toulouse G. Coexistence of spin-glass and ferromagnetic orderings. Phys Rev Lett (1981) 47:201–4. doi:10.1103/physrevlett.47.201

CrossRef Full Text | Google Scholar

21. Cragg DM, Sherrington D, Gabay M. Instabilities of an m-vector spin-glass in a field. Phys Rev Lett (1982) 49:158–61. doi:10.1103/physrevlett.49.158

CrossRef Full Text | Google Scholar

22. Petit DCI, Fruchter L, Campbell IA. Ordering in heisenberg spin glasses. Phys Rev Lett (2002) 88:207206. doi:10.1103/physrevlett.88.207206

PubMed Abstract | CrossRef Full Text | Google Scholar

23. Vincent E. Spin glass experiments. In: T Chakraborty, editor. Encyclopedia of condensed matter physics. 2nd edn. Oxford: Academic Press (2024). p. 371–87.

CrossRef Full Text | Google Scholar

24. Jackson JD. Classical electrodynamics. 3rd edn. New York: Wiley (1998).

Google Scholar

25. Lefloch F, Hammann J, Ocio M, Vincent E. Spin glasses in a magnetic field: phase diagram and dynamics. Physica B: Condensed Matter (1994) 203:63–74. doi:10.1016/0921-4526(94)90278-x

CrossRef Full Text | Google Scholar

Keywords: disorder magnetic systems, complex systems, spin glass transition, glass transition temperature, field-cooled magnetization, zero-field-cooled magnetization, AC susceptibility

Citation: Pradhan S, Harrison D, Kenning G, Schlagel DL and Guchhait S (2024) Investigation of experimental signatures of spin glass transition temperature. Front. Phys. 12:1482907. doi: 10.3389/fphy.2024.1482907

Received: 19 August 2024; Accepted: 30 October 2024;
Published: 13 December 2024.

Edited by:

Stefan Boettcher, Emory University, United States

Reviewed by:

Clodoaldo Irineu Levartoski de Araujo, Universidade Federal de Viçosa, Brazil
Daniel Barci, Rio de Janeiro State University, Brazil

Copyright © 2024 Pradhan, Harrison, Kenning, Schlagel and Guchhait. This is an open-access article distributed under the terms of the Creative Commons Attribution License (CC BY). The use, distribution or reproduction in other forums is permitted, provided the original author(s) and the copyright owner(s) are credited and that the original publication in this journal is cited, in accordance with accepted academic practice. No use, distribution or reproduction is permitted which does not comply with these terms.

*Correspondence: Sahil Pradhan, c2FoaWwucHJhZGhhbkBiaXNvbi5ob3dhcmQuZWR1

Disclaimer: All claims expressed in this article are solely those of the authors and do not necessarily represent those of their affiliated organizations, or those of the publisher, the editors and the reviewers. Any product that may be evaluated in this article or claim that may be made by its manufacturer is not guaranteed or endorsed by the publisher.