- Department of Physics and Institute for Soft Matter Synthesis and Metrology, Georgetown University, Washington, DC, United States
We introduce a method for precise and accurate measurements of particle speeds in dense suspensions flowing at high rates and demonstrate the utility of the approach for revealing complex flow fluctuations during shearing in a setup that combines imaging with a confocal microscope and shearing with a rheometer. We scan the focal point in one dimension, aligned with direction of flow, producing absolute measurements of speed that are independent of suspension structure and particle shape. We compare this flow-direction line scanning approach with a complementary method we introduced previously, measuring speed using line scanning in the vorticity direction. By comparing results in various flow conditions, including shear-thinning and thickening regimes, we demonstrate the efficacy of our new approach. We find that both approaches exhibit qualitatively similar flow profiles, but a comparative analysis reveals a 15%–25% overestimation in speed measurement using vorticity line scanning, with discrepancies generated by anisotropic suspension microstructure under flow. Moreover, in the thickening regime where complex flow fields are present, both approaches capture local speed fluctuations. However, line scanning in the flow direction reveals and precisely captures stagnation and backflows, a capability not achievable with vorticity line scanning. The approach introduced here not only provides a refined technique for speed measurement in fast-flowing suspensions but also emphasizes the significance of accurate measurement techniques in advancing our understanding of flow behavior in dense suspensions, particularly in contexts where strong non-affine flows are prevalent.
1 Introduction
Characterizing and understanding the behavior of flowing suspensions is an important challenge in materials science and engineering, with significant implications across various industrial sectors [1, 2]. Suspensions exhibit diverse flow behaviors that profoundly influence their properties and applications. Understanding and controlling flow phenomena in suspensions is crucial for optimizing processes and enhancing product performance in industries ranging from pharmaceuticals to cosmetics, from food processing to petroleum extraction [2]. The flow behavior of suspensions is intricately linked to their rheological properties, including shear-thinning and thickening. Shear-thinning, characterized by a decrease in viscosity under increasing shear rates, is commonly observed in many suspensions and plays a vital role in processes such as pumping, painting, inkjet printing and mixing. Conversely, shear thickening, where viscosity increases with shear rate, is important in applications such as body armor and damping systems [3].
Shear thickening typically occurs at relatively large Péclet number,
2 Approach
2.1 Speed measurement by line scanning in the flow direction
Particle tracking is a widely employed method for measuring the velocity of particles in flowing suspensions. This technique involves tracing the trajectories of individual particles as they move within the fluid medium, allowing for the determination of their velocity over time [4]. For accurate particle tracking, the displacement of a particle between consecutive frames should be smaller than the interparticle spacing. Consequently, given the frame rate
Here, we introduce a different approach that facilitates measurements of speeds in fast-flowing systems. In this method, instead of employing the relatively slow 2D laser scanning technique, the laser scans back and forth exclusively along the flow direction, designated as the x-axis (see Figure 1A). In the ideal scenario where the center of the particle lies within the focal volume of the scanned line, the magnitude of the particle velocity in the flow direction can be determined as follows:
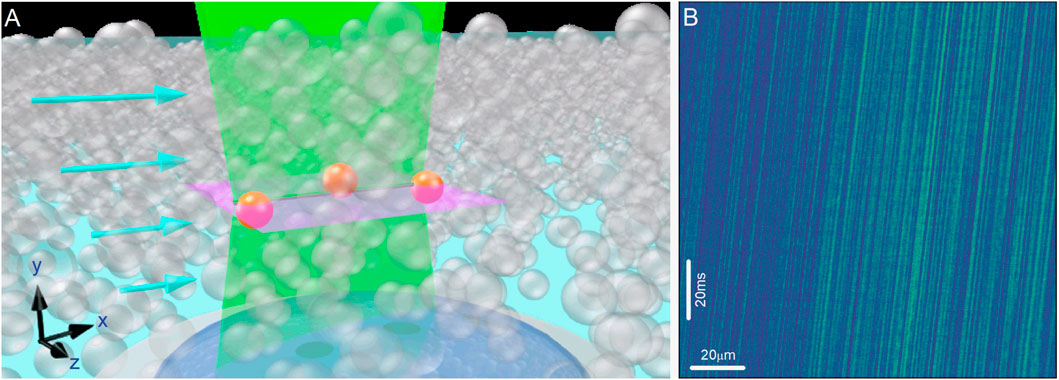
Figure 1. (A) Schematic of line scanning along the flow direction for a sheared dense suspension: The laser scans back and forth along the flow direction,
In the results presented below, we image non-fluorescent particles dispersed in a fluorescent background, so particles generate local intensity minima, which move along the scan line with each successive scan. Plotting the intensity along the scanned line on subsequent scans (creating a kymograph), we visualize the passage of particles along the flow direction. Figure 1B shows an example image generated from a sheared suspension of 1.5
In principle, the slope of each line could be utilized to measure the speed of individual particles. In practice, discerning individual particles poses a challenge, in part due to the variability in the particle position relative to the scan line in the directions perpendicular to the line. Therefore, we opt to derive speeds from characteristic lengths obtained through correlation analyses. This approach is similar to fiuorescence correlation spectroscopy (FCS), which has been used to measure flow speeds in situations where the volume fraction of the fiuorescent species is low [1, 5–10]. To extract the speed from the line scan intensity data,
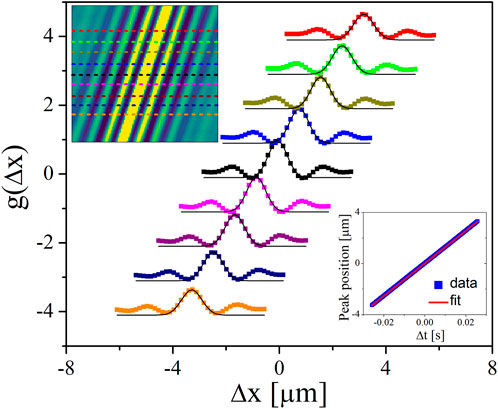
Figure 2. Top left inset:
2.2 Speed measurement by line scanning in the vorticity direction
The speed of particles in the flow direction can also be determined through line scanning in the vorticity direction. One advantage of this method is that it provides information on the local structure in the flow-vorticity plane. While we briefly touch upon this method here, a more comprehensive analysis has been presented in our previous study [1]. Similar to line scanning in the flow direction, when a line is scanned in the vorticity direction, a non-fluorescent particle in a fluorescent background within the scanned line produces a local intensity minimum, facilitating the determination of its position along the vorticity direction. Plotting the intensity along the scanned line at various scanned times (kymograph) reveals the local structure in the flow-vorticity plane. Figure 3A depicts an example image produced by 1.5
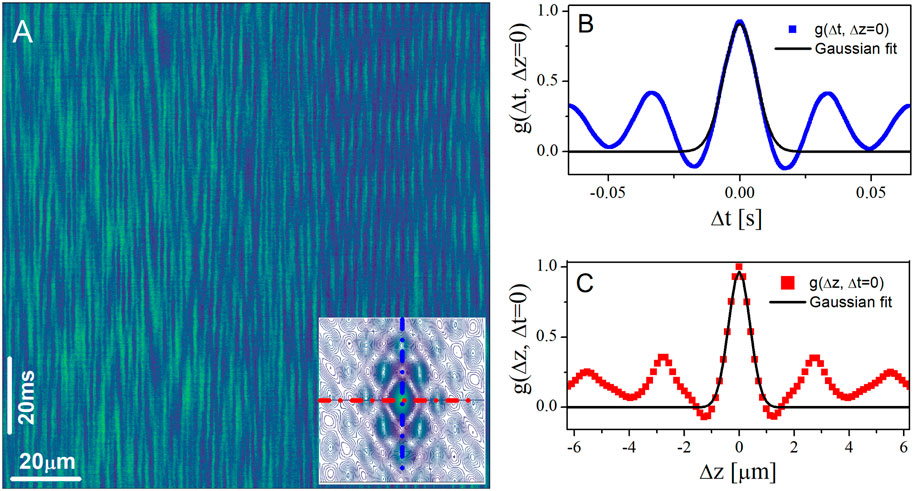
Figure 3. (A) Representative space-time kymographs generated from line scans in the vorticity direction (horizontal) stacked vertically taken in a sheared dense suspension of silica particles of diameter
3 Results and discussion
Dense suspensions at shear rates below shear-thickening: We first compare the values of speeds in the flow direction
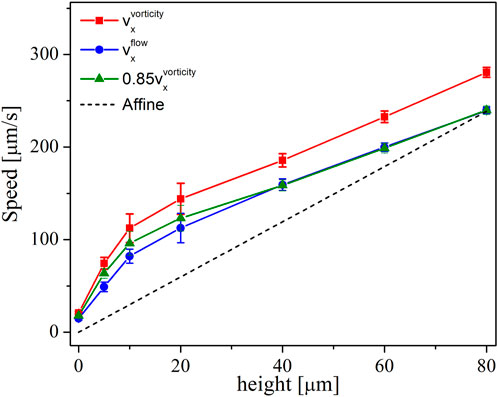
Figure 4. Profiles of average speed as a function of height from rheometer’s bottom plate for a constant shear rate of
Dense suspensions in the shear-thickening regime: Next, we compare the average velocity values measured by line scanning in the flow and vorticity directions in the shear-thickening regime where a more complex flow field with faster particle speeds is anticipated [1, 17]. Here, we show the results at the bottom layer for the same silica suspension (
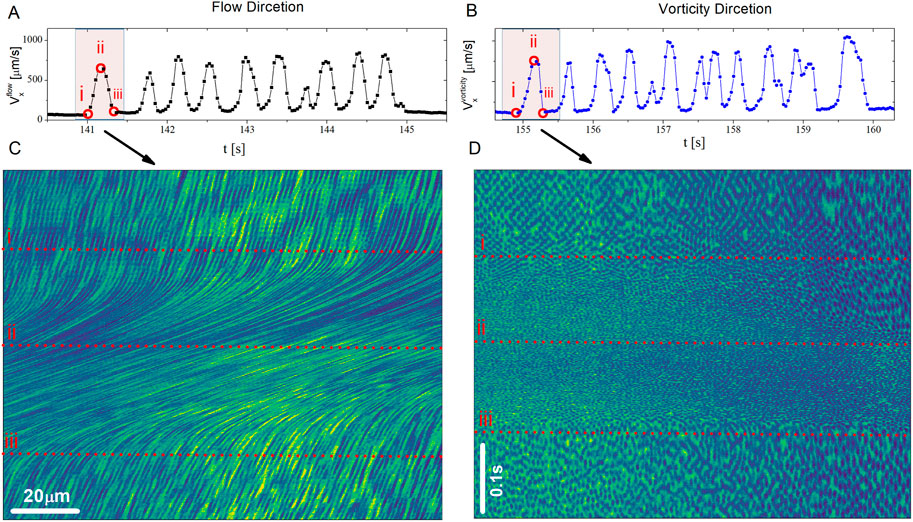
Figure 5. The averaged velocity in the flow direction measured from line scanning in the (A) flow and (B) vorticity directions for the suspension particles at the bottom boundary. (C) and (D) are the corresponding kymographs for the highlighted regions shown in (A) and (B), respectively. The horizontal dashed lines show the specific time points marked by open red squares on the plot of the average
In Figures 5C, D, we show the corresponding kymographs for line scanning in the flow and vorticity directions, respectively, during one spike (highlighted regions in Figures 5A, B). In the case of line scanning in the flow direction (Figure 5C), variations in speed are discernible by changes in the slope of dark lines in the kymograph, representing of particles over time along the direction of flow. In Figure 5C, for
For line scanning in the vorticity direction, the change in speed is manifested by the change in the relative size of dark ovals (particles) in the flow direction. A longer oval corresponds to a slower flow, and vice versa. Additionally, as previously mentioned, line scanning in the vorticity direction provides information on the local structure of the suspension in the vorticity-flow plane. As shown in the kymograph of Figure 5D, for
Very dense suspensions in the shear-thickening regime: Next, we investigate the flow in a very dense silica suspension (
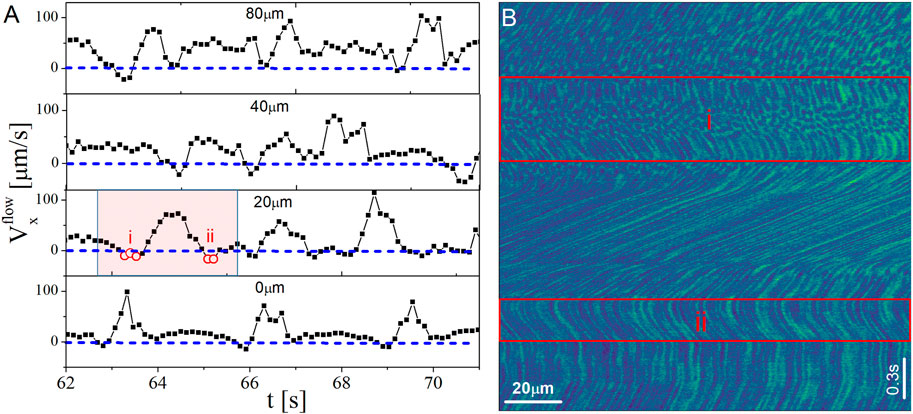
Figure 6. (A) The averaged velocity in the flow direction measured from line scanning in the flow direction at different heights from the bottom plate. (B) The kymograph for the highlighted region shown in (A). The dashed blue lines in (A) highlight zero speeds. The rectangular regions in (B) show the specific time points (negative speeds) marked by open red circles in (A). Results are for the suspension of silica particles (
An additional feature evident in the kymograph is that for times before the sharp increase in speed (times before and within region
4 Conclusion
In conclusion, we have introduced a novel approach for precisely measuring particle speeds in fast-flowing suspensions. This approach involves scanning the laser focal point back and forth along the flow direction, effectively tracking the movement of individual particles and enabling the precise determination of their velocities over time. The rapid line scanning process facilitates the measurement of speeds far exceeding those achievable with conventional techniques such as particle tracking or PIV. We have validated our approach under various flow conditions and compared it with measurements from line scanning in the vorticity direction. Although vorticity direction scanning provides information on the local structure in the flow-vorticity plane, it approximates the values of speed since it requires assumptions about the relative interparticle spacings in the vorticity and flow directions. We first compared values of speed obtained by line scanning in the flow and vorticity directions well below the shear-thickening regime where the suspension is expected to experience a simpler flow field. Our direct comparison showed similar flow profiles obtained by both methods. However, line scanning in the vorticity direction was found to overestimate flow speeds. The exact values of the discrepancy between the two methods depends on the structure of the suspension under flow. Near the bottom boundary of the suspension, where there is layering and ordering of particles, this discrepancy was approximately 25%, whereas farther from the bottom plate where the structure becomes largely disordered the difference was smaller (about 15%). In the thickening regime, both methods showed speed fluctuations during the course of shear with quantitative differences ranging from 50% (away from fluctuations) to about 10%–20% (in the middle of the fluctuations). These fluctuations are linked to a loss of order near the bottom boundary. Linescan measurements in the flow direction detected a more complex flow field for very dense suspension of silica particles in the shear-thickening regime, which includes backflow and presence of orthogonal flows, highlighting the intricate nature of the flow behavior in such systems. Our findings underscore the importance of precise speed measurements in understanding suspension dynamics, particularly in contexts where suspensions experience strong nonaffine flows.
5 Materials and methods
Experiments were performed on the suspensions of silica particles with the size of 1.5
Data availability statement
The original contributions presented in the study are included in the article/Supplementary Material, further inquiries can be directed to the corresponding author.
Author contributions
EM: Conceptualization, Investigation, Writing–original draft, Writing–review and editing. DB: Conceptualization, Funding acquisition, Supervision, Writing–review and editing. JU: Conceptualization, Funding acquisition, Supervision, Writing–review and editing.
Funding
The author(s) declare that financial support was received for the research, authorship, and/or publication of this article. This work was supported by the National Science Foundation (NSF) under Grants 1907705 and 2226486.
Acknowledgments
We thank Vikram Rathee and Joia Miller for their initial assistance with the experiments. We also thank Emanuela Del Gado and Peter Olmsted for their insightful discussions.
Conflict of interest
The authors declare that the research was conducted in the absence of any commercial or financial relationships that could be construed as a potential conflict of interest.
Publisher’s note
All claims expressed in this article are solely those of the authors and do not necessarily represent those of their affiliated organizations, or those of the publisher, the editors and the reviewers. Any product that may be evaluated in this article, or claim that may be made by its manufacturer, is not guaranteed or endorsed by the publisher.
Supplementary material
The Supplementary Material for this article can be found online at: https://www.frontiersin.org/articles/10.3389/fphy.2024.1480376/full#supplementary-material
References
1. Miller JM, Blair DL, Urbach JS. Order and density fluctuations near the boundary in sheared dense suspensions. Front Phys (2022) 10. doi:10.3389/fphy.2022.991540
2. Mewis J, Wagner NJ. Colloidal suspension rheology. Cambridge, United Kingdom: Cambridge University Press (2012).
3. Morris JF. Shear thickening of concentrated suspensions: recent developments and relation to other phenomena. Annu Rev Fluid Mech (2020) 52:121–44. doi:10.1146/annurev-fluid-010816-060128
4. Besseling R, Isa L, Weeks ER, Poon WC. Quantitative imaging of colloidal flows. Adv Colloid Interf Sci (2009) 146:1–17. doi:10.1016/j.cis.2008.09.008
5. Koynov K, Butt HJ. Fluorescence correlation spectroscopy in colloid and interface science. Curr Opin Colloid and Interf Sci (2012) 17:377–87. doi:10.1016/j.cocis.2012.09.003
6. Dong C, Ren J. Coupling of fluorescence correlation spectroscopy with capillary and microchannel analytical systems and its applications. Electrophoresis (2014) 35:2267–78. doi:10.1002/elps.201300648
7. Kunst BH, Schots A, Visser AJ. Detection of flowing fluorescent particles in a microcapillary using fluorescence correlation spectroscopy. Anal Chem (2002) 74:5350–7. doi:10.1021/ac0256742
8. Gösch M, Blom H, Holm J, Heino T, Rigler R. Hydrodynamic flow profiling in microchannel structures by single molecule fluorescence correlation spectroscopy. Anal Chem (2000) 72:3260–5. doi:10.1021/ac991448p
9. Pan X, Yu H, Shi X, Korzh V, Wohland T. Characterization of flow direction in microchannels and zebrafish blood vessels by scanning fluorescence correlation spectroscopy. J Biomed Opt (2007) 12:014034. doi:10.1117/1.2435173
10. Pan X, Shi X, Korzh V, Yu H, Wohland T. Line scan fluorescence correlation spectroscopy for three-dimensional microfluidic flow velocity measurements. J Biomed Opt (2009) 14:024049. doi:10.1117/1.3094947
12. Chen LB, Zukoski CF, Ackerson BJ, Hanley HJM, Straty GC, Barker J, et al. Structural changes and orientaional order in a sheared colloidal suspension. Phys Rev Lett (1992) 69:688–91. doi:10.1103/physrevlett.69.688
13. Holmqvist P, Lettinga MP, Buitenhuis J, Dhont JKG. Crystallization kinetics of colloidal spheres under stationary shear flow. Langmuir (2005) 21:10976–82. doi:10.1021/la051490h
14. Wu YL, Derks D, van Blaaderen A, Imhof A. Melting and crystallization of colloidal hard-sphere suspensions under shear. Proc Natl Acad Sci (2009) 106:10564–9. doi:10.1073/pnas.0812519106
15. Derks D, Wu YL, van Blaaderen A, Imhof A. Dynamics of colloidal crystals in shear flow. Soft Matter (2009) 5:1060. doi:10.1039/b816026k
16. Richard D, Speck T. The role of shear in crystallization kinetics: from suppression to enhancement. Scientific Rep (2015) 5:14610. doi:10.1038/srep14610
17. Rathee V, Miller J, Blair DL, Urbach JS. Structure of propagating high-stress fronts in a shear-thickening suspension. Proc Natl Acad Sci (2022) 119. doi:10.1073/pnas.2203795119
18. Boersma WH, Baets PJM, Laven J, Stein HN. Time-dependent behavior and wall slip in concentrated shear thickening dispersions. J Rheology (1991) 35:1093–120. doi:10.1122/1.550167
19. Rathee V, Blair DL, Urbach JS. Localized transient jamming in discontinuous shear thickening. J Rheology (2020) 64:299–308. doi:10.1122/1.5145111
20. Rathee V, Blair DL, Urbach JS. Dynamics and memory of boundary stresses in discontinuous shear thickening suspensions during oscillatory shear. Soft Matter (2021) 17:1337–45. doi:10.1039/d0sm01917h
21. Rathee V, Blair DL, Urbach JS. Localized stress fluctuations drive shear thickening in dense suspensions. Proc Natl Acad Sci (2017) 114:8740–5. doi:10.1073/pnas.1703871114
22. Moghimi E, Urbach JS, Blair DL. Stress and flow inhomogeneity in shear-thickening suspensions. J Colloid Interf Sci (2024) 678:218–25. doi:10.1016/j.jcis.2024.08.099
Keywords: speed measurements, fast flows, rheology, shear thickening, suspensions
Citation: Moghimi E, Blair DL and Urbach JS (2024) Precise and accurate speed measurements in rapidly flowing dense suspensions. Front. Phys. 12:1480376. doi: 10.3389/fphy.2024.1480376
Received: 13 August 2024; Accepted: 14 October 2024;
Published: 23 October 2024.
Edited by:
Francisco Vega Reyes, University of Extremadura, SpainReviewed by:
Jeffrey F. Morris, City College of New York (CUNY), United StatesDaniel Cruz, Federal University of Rio de Janeiro, Brazil
Copyright © 2024 Moghimi, Blair and Urbach. This is an open-access article distributed under the terms of the Creative Commons Attribution License (CC BY). The use, distribution or reproduction in other forums is permitted, provided the original author(s) and the copyright owner(s) are credited and that the original publication in this journal is cited, in accordance with accepted academic practice. No use, distribution or reproduction is permitted which does not comply with these terms.
*Correspondence: Jeffrey S. Urbach, dXJiYWNoakBnZW9yZ2V0b3duLmVkdQ==
 Esmaeel Moghimi
 Daniel L. Blair
 Jeffrey S. Urbach