- 1College of Architecture and Civil Engineering, Xinyang Normal University, Xinyang, China
- 2Henan New Environmentally-Friendly Civil Engineering Materials Engineering Research Center, Xinyang Normal University, Xinyang, China
- 3School of Water Conservancy and Civil Engineering, Zhengzhou University, Zhengzhou, China
Pervious concrete exhibits different freeze–thaw performance compared to conventional concrete owing to its unique porous structure. Therefore, studying its mechanical and durability properties under freeze–thaw conditions has become a pressing issue. A numerical model of pervious concrete was created using the discrete element method based on actual aggregates to evaluate the impact of freeze–thaw cycles (FTCs) on the mechanical properties of pervious concrete. Pore water in the microstructure of pervious concrete was defined using PFC3D software through simulation of the freezing and expansion processes of the pore water, while applying freeze–thaw loading. This study employs the parallel bond model in PFC3D software to account for adhesion between the material particles. The linear ontological relationship of the parallel bond model was modified to a linear curvilinear relationship. The FTCs resulted in strength loss reductions of 0.62%, 2.17%, 4.06%, and 5.87% for corresponding mass losses of 0.66%, 0.89%, 1.21%, and 6.66% compared to the control. The models were monitored for fracture location and uniaxial compressive damage using PFC3D software, and the attenuation constant of the freeze–thaw resistance of pervious concrete was examined with respect to varying porosity and initial uniaxial compressive strength (UCS). The results indicate that the decay constant increases with increasing porosity and modulus of elasticity while decreasing with increasing values of the initial UCS.
1 Introduction
The urban “heat island effect” has intensified in recent years, resulting in the development of the concept of a “sponge city.” A sponge city refers to one that can absorb, store, seep, and purify water when it rains, thereby reducing the need to “release” and consume that water [1]. Pervious pavements are an important part of a sponge city; pervious concrete pavements have high porosity, can effectively alleviate the urban heat island effect, and reduce the risk of urban flooding [2]. Pervious concrete contains very little or no fine-aggregate sand, which endows it with a unique porous structure [3]. The porosity of pervious concrete makes it particularly vulnerable to deterioration from freeze–thaw cycle (FTC) loading, which can shorten its overall lifespan [4, 5]. Therefore, evaluation of the mechanical properties and durability of pervious concrete under a freeze–thaw environment is a key problem that needs to be solved at present.
The primary reason for deterioration of the durability of pervious concrete is the leakage of calcium ions during cement hydration; this phenomenon can be successfully inhibited by metakaolin and silica fume [6]. Furthermore, the inclusion of fly ash (FA), rice husk ash, and granulated blast furnace slag can result in more extensive micropore filling [7–10]. This has an important reinforcing effect on the interfacial transition zone and can effectively improve the freeze–thaw cyclic loading resistance of pervious concrete [11–14]. Anderson and Dewoolkar [15] discovered that FA is an effective filler in pervious concrete, but the short curing period may result in insufficient hydration of FA, making pervious concrete with FA more susceptible to deterioration in early freeze–thaw environments. Chindaprasirt et al. [16] found that 10% rice husk ash was effective in increasing the strength of pervious concrete. Cement alone is not as effective as a polymeric cementitious system comprising cement and mineral admixtures.
Some scholars have investigated the effects of cementitious materials containing air-entraining agents (AEAs) on the resilience of pervious concrete to freeze–thaw cycling. Zhong and Wille [5] investigated the effects of the cementitious material type, pore system characteristics, and fiber-reinforcing materials on the freeze–thaw durability of pervious concrete and demonstrated that ultrahigh-strength cementitious materials can greatly enhance such durability. Santos et al. [17] showed that internal blending of appropriate amounts of silane emulsion in cementitious materials enhanced the ability of the concrete containing recycled aggregates to withstand ion penetration, carbonation, and capillary water absorption. Ebrahimi et al. [18] summarized three methods for enhancing the freeze–thaw resistance of concrete, which involved employing AEAs to mitigate the pore water pressure, incorporating fibers or nanotubes to inhibit crack formation, and preparing monolithic waterproof concrete with internal water-repellent agents to minimize water absorption. Vancura et al. [19] and Chen et al. [20–22] found that AEAs are the most commonly used method of introducing air bubbles to improve freeze–thaw durability in plain concrete and that pervious concrete without entrapped air is more susceptible to freeze–thaw damage in cold regions.
Using the normal test procedures meant for conventional concrete owing to the lack of a defined test technique for the freeze–thaw durability of pervious concrete showed that adding 7% sand to coarse aggregates greatly increased the ability of pervious concrete to withstand FTCs. Lund et al. [23] reported that the effects of AEAs on the frost resistance of pervious concrete are mainly through improvement of the workability of the pervious concrete mixture, making it more compact and thereby enhancing the frost resistance rather than by reducing the pore spacing. Yang et al. [14] concluded that AEAs enhance the frost resistance of pervious concrete primarily by boosting its structural strength.
Ethylene vinyl acetate (EVA) emulsion enhances the interfacial bond strength of pervious concrete, while polypropylene (PP) fibers increase the tensile strength, leading to improved frost resistance compared to laboratory-prepared specimens. Giustozzi [24] conducted experiments on the frost resistance of pervious concrete using four different polymer modifiers: cationic styrene-butadiene rubber (SBR) emulsion, polyvinyl acetate (PVAC) emulsion, EVA powder, and anionic SBR emulsion. Their study revealed that these polymer modifiers substantially improved the performances of pervious concrete, especially enhancing its frost resistance, while maintaining permeability. Among these, the PVAC emulsion had the most pronounced enhancement effect on the performance of pervious concrete.
Salt corrosion caused by the FTCs has a universal and direct negative impact on the longevity of pervious concrete. Extensive use of deicing salts and seawater erosion in the coastal areas often accelerates the deterioration rate of pervious concrete, which seriously restricts its promotion and use in cold areas. Feng et al. [25] studied the effects of three different deicing agents on silicate-cement-based pervious concrete using the saturation and drainage methods to illustrate the extent of damage caused; accordingly, the three agents produced effects in the following order: calcium chloride > sodium chloride > magnesium acetate. Sahdeo et al. [26] demonstrated the methods by which the sulfate corrosion resistance, flexural strength, and compressive strength of pervious concrete can be successfully increased through the addition of a tiny quantity of fine sand. Saboo et al. [12] investigated the use of NaCl solution as a freeze–thaw medium to simulate freeze–thaw tests in a deicing salt environment; after 15 FTCs, the concrete specimens showed more than 5% loss of quality, and after 50 FTCs, the concrete specimens showed more than 40% loss of quality. Tsang et al. [27] studied the FTC test results of pervious concrete using calcium chloride solution, urea solution, NaCl solution, magnesium chloride solution, and water as the freeze–thaw media; they found that for a given concentration, NaCl and calcium chloride solutions produced the most serious freeze–thaw damages to pervious concrete. After 50 FTCs, there was a 5% loss of specimen mass, which increased to more than 20% loss of mass after 100 FTCs. Nassiri et al. [28] studied the method by which cured carbon-fiber composite material (CCFCM) affected pervious concrete and discovered that CCFCM greatly increases the ability of pervious concrete to withstand frost. Zou et al. [29] discovered that the use of silanized recycled aggregates would be both environment- and user-friendly; this material creates a hydrophobic silica film on the aggregate surface to inhibit water accumulation, resulting in a compact structure at the aggregate interface through increased C-S-H gel formation and thereby enhancing the frost resistance.
Very few studies are available on the long-term (56 d, 90 d, etc.) performances of modified pervious concretes, and most of these studies concentrate on the early (usually 28 d) performance of the material. Meanwhile, very few studies have been conducted on the fine-scale cracking of pervious concrete following FTCs; indoor tests have only been used to examine the mechanical characteristics and freeze–thaw mechanism, which are insufficient to fully account for the fine-scale structure of pervious concrete following freeze–thaw cycling [30, 31]. In particular, water in the internal pores and micropores of the concrete condenses into ice as the temperature decreases below freezing, expands by roughly 8%, and creates shear strain between the aggregate particles. However, the high permeability of pervious concrete prevents saturation with water so that some of the water pressure is relieved following FTCs. Even when the pervious concrete is not saturated with water, mechanical degradation has been shown to occur [32, 33].
Numerical simulations can be used to explore the mechanical properties of pervious concrete and analyze its behaviors from a fine-scale perspective. By considering pervious concrete as a granular cemented material, we can accurately represent it using the particle flow method, which is a discrete element technique mostly utilized to examine the fine-grained mechanical characteristics of bulk media [34]. Ng and Dai [35] examined the effects of freeze–thaw damage of water ice pressure on the internal microstructure of a cement material and replicated the expansion of cracks in the cement material under a freeze–thaw environment. Zhao et al. [36] simulated the FTC of pervious concrete using discrete parts, created an elastic–plastic parallel-bonded contact model, and analyzed how varying porosity and the initial uniaxial compressive strength (UCS) affect the freeze–thaw decay constants. Xiang et al. [37] used the discrete element method (DEM) to model pervious concrete and accurately simulate the changes in its compression modulus and strength during FTCs. Wu et al. [38] applied a new loading method to obtain the freezing force during FTCs; accordingly, a near-field kinetic model was introduced to compare the damage patterns of experimentally captured cement paste samples.
By taking into account the porosity of the concrete, a randomly distributed predamage was added to imitate the freeze–thaw damage in real macroscopic concrete. To examine the damage of pervious concrete under uniaxial compression, Xie et al. [33] used the DEM and found that the simulation results closely matched the actual data. Xu et al. [39] examined the impacts of aggregate reinforcement on paste migration and pore structure modification by creating a three-dimensional model of recycled aggregate pervious concrete using DEM. Huang et al. [40] concluded that the plasticity near the pore region expands with increasing pressure during freezing; upon thawing, elastic deformation is recovered, yet significant residual deformation persists, resulting in an elastoplastic theoretical model. AlShareedah and Nassiri [32] predicted the hydraulic characteristics of pervious concrete using pore-scale finite volume modeling with the DEM.
Pervious concrete freeze–thaw tests use both rapid and slow freeze–thaw methods. Moradllo et al. [41] used the slow freeze–thaw method to obtain the relationship between the critical pore spacing coefficient and different cooling rates (2, 4, and 6°C/h); they found that a faster cooling rate resulted in a smaller critical pore spacing coefficient. Hosseinzadeh et al. [42] utilized the slow freeze–thaw method and observed notable distinctions in the performances of paste and mortar, with mortar surpassing pastes. Taheri et al. [43] found that for similar fiber compositions, pervious concrete was able to resist 320–360 cycles when subjected to the rapid freeze–thaw method (Standard ASTMC666-0317); however, it could resist only 50–60 cycles when the slow freeze–thaw test (24 h for each cycle) was applied, indicating that the standard freeze–thaw test has slow deterioration even though the rates of freezing and thawing are higher.
Thus, the present study uses simulations and tests to examine the small damage characteristics and fundamental mechanical properties of pervious concrete under repeated FTCs. Based on the analysis of the compressive, flexural, and permeability coefficient data, the ideal mix ratio of pervious concrete was established, and the FTC test was carried out based on the ideal mix ratio. Using actual aggregates, a numerical model of pervious concrete was established for different FTCs using the discrete element software PFC3D. To determine the changes to the mechanical characteristics of the numerical model of pervious concrete, various fine-scale parameters of the model were calibrated. By comparing and analyzing the results from numerical simulations and tests, the numerical model was validated to ascertain the law governing the fine damage characteristics of pervious concrete.
2 Preparation and tests
2.1 Materials
2.1.1 Gelling material
This study utilized P.O 42.5 ordinary Portland cement (OPC) from Tongli Cement Co., Ltd.; FA produced by Henan Yixiang New Material Co., Ltd.; granulated ground blast furnace slag (GGBFS) from Henan Yixiang New Material Co., Ltd.; dispersible emulsion powder (DEP) from Shijiazhuang Chuansheng Building Materials Technology Co., Ltd.; and water reducing agent (WRA) from Hunan Zhongyan Building Materials Technology Co., Ltd. Table 1 displays the chemical compositions of the DEP, FA, GGBFS, and OPC.
2.1.2 Aggregates
In the tests, the natural coarse aggregate (NCA) was composed of 5–10-mm aggregate particles. The NCA was cleaned with tap water prior to usage to remove any muck and was allowed to dry naturally. Table 2 presents the physical attributes of the aggregates.
2.1.3 Test water
Water supplied by the city of Xinyang was used for the preparation, curing, and post-testing of the pervious concrete samples in this study.
2.2 Orthogonal experimental design
2.2.1 Orthogonal test method
In compliance with the guidelines of the Technical Specification for Pervious Cement Concrete Pavement [44], the water–cement ratio (WCR) was designed as per the volumetric method, and the target porosity was adjusted to 15%. By adopting the orthogonal experimental design, samples from the entire test system can be screened more precisely, swiftly, and economically. This method considers various factors and levels to achieve the best results and reflect the actual conditions more accurately.
2.2.2 Orthogonal test grouping
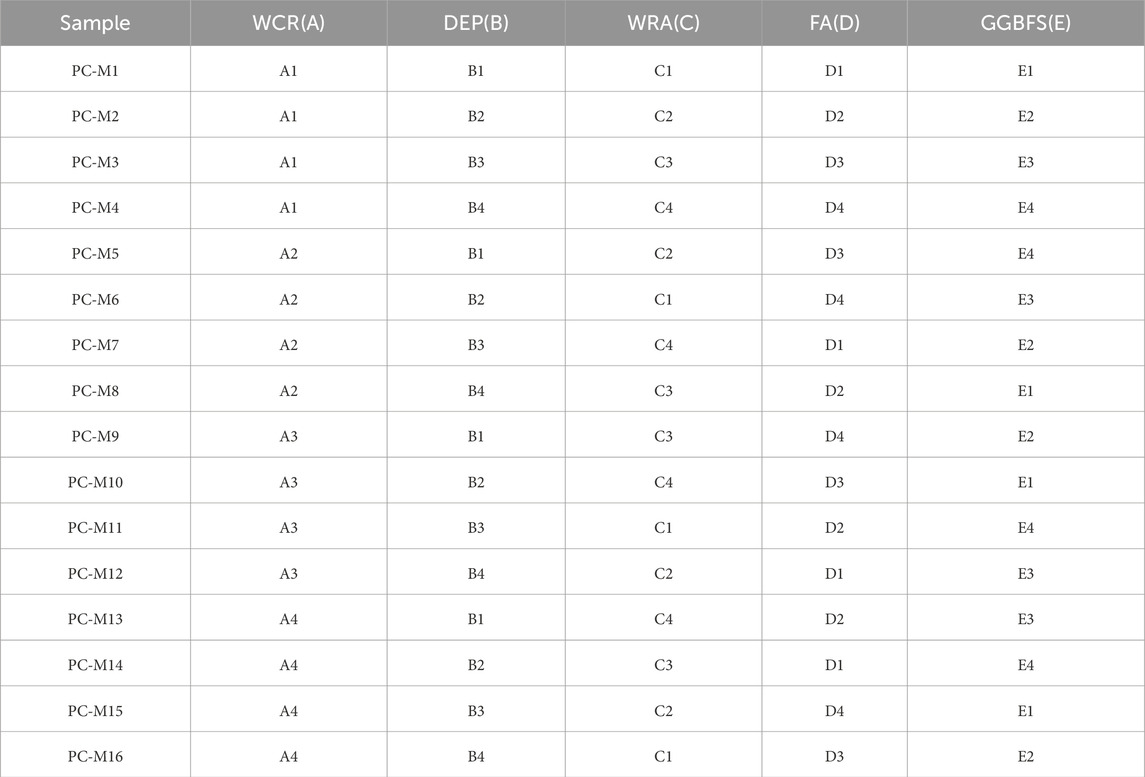
In this study, five different factors were established, including WCR, DEP, WRA, FA, and GGBFS, and four different levels were considered in each group for the orthogonal tests that were then analyzed using analysis of variance to find the optimal fit ratio between the factors. The level factor and orthogonal tables are shown in Tables 3, 4.
2.3 Mixing ratio design
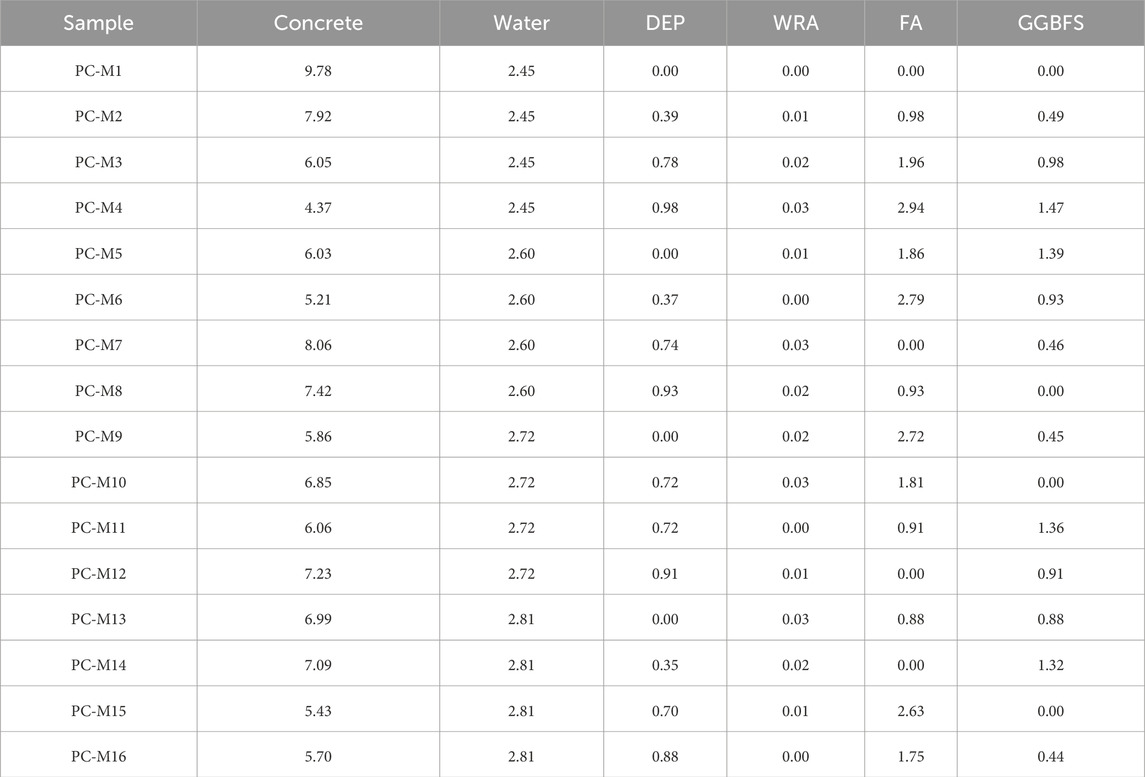
When designing the mix ratio for pervious concrete, the effects of the admixture amount, WCR, and molding technique on water permeability performance should be taken into account. Enhancing the resistance of pervious concrete to frost while preserving its strength is also a crucial consideration. The performance indexes of pervious concrete measured in this test and the specifications of the specimens required are shown in Table 5. Series 1 was prepared according to CJJ/T135-2009 [44], and the quantity of material used in each group is displayed in Table 6.
The optimum compressive strength, effective porosity, and water permeability were determined through the orthogonal test. Series 2 was then prepared according to the optimum ratios. Series 2 is a column specimen with dimensions of 100 mm (length) × 100 mm (width) × 300 mm (height) and is used to analyze the post-freezing and thawing strength losses of pervious concrete along with the change trends in the stress–strain curve. The precise mixing ratio design for the Series 1 test phase is displayed in Table 6. The overall degree of variation for this investigation was determined through 16 sets of orthogonal tests.
2.4 Test methods
2.4.1 Sample preparation and maintenance
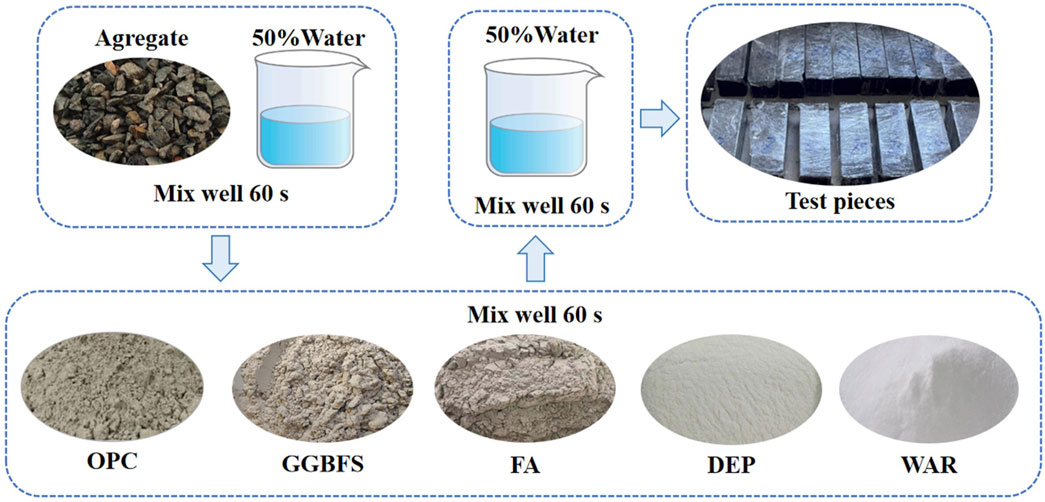
The test employed the cement-packed stone method of mixing. Figure 1 depicts the specimen production process. The precise mixing procedure was as follows: the mixer was filled with coarse aggregate and 50% water for 1 min, followed by the addition of cementitious materials for another minute; lastly, the remaining 50% water was added and mixed for another minute. The pervious concrete was loaded into the mold three times through three layers of manual pile insertion and pounding, followed by compaction and leveling. The initial hydration has a major impact on the improved properties of pervious concrete because its WCR is typically low.
Therefore, the surfaces of the specimens were covered with a film as soon as the pervious concrete was loaded into the molds to maintain the moisture content without affecting the initial hydration. Thereafter, the specimens were maintained in a room for a full day at a temperature of 15°C
2.4.2 Compressive strength test
According to the standard GB/T50081-2019 [45], the samples measuring 100 mm × 100 mm × 100 mm underwent cubic compressive testing, whereas the samples measuring 100 mm × 100 mm × 300 mm were subjected to prismatic uniaxial compressive testing at varying ages.
2.4.3 Flexural strength test
According to the standard GB/T50081-2019 [45], the pervious concrete specimens cured for 28 d were subjected to a prismatic flexural test. The prismatic specimens had dimensions of 100 mm × 100 mm × 400 mm.
2.4.4 Water permeability test
The permeability coefficient was determined based on Darcy’s law in combination with the constant head permeameter method on a cubic specimen of size 100 mm × 100 mm × 100 mm according to the following Equation 1 from [46]:
where
2.4.5 Effective porosity test
The effective porosity was computed using the formula below with a cubic specimen of size 100 mm × 100 mm × 100 mm in accordance with Equation 2 the ASTM standard [47]:
where
2.4.6 Freeze–thaw durability test
The FTC test conforms to the standard GB/T50082-2009 [48]. After 28 d of conventional curing, the specimens were removed from the curing room and immersed in water at 10°C
2.5 Model building
2.5.1 Realistic aggregate specimen modeling
Freeze–thaw modeling was developed using the PFC3D software. The real aggregates used in this study were sieved to determine the shapes. Based on the size of the aggregates used in the test, the aggregate model was set to resemble the shape of the real aggregate. The real aggregates were then classified into three types as angular, flat, and elongated aggregates. Table 7 displays the sieved results for each of these aggregate types.
A mold with a height of 300 mm, length of 100 mm, and width of 100 mm was constructed in PFC3D; then, aggregate and water particles were generated with a total porosity of 15%, the water particles in the total porosity were equal to 15%, and the aggregate particles had radii in the range of 2.5–5 mm. The radii of the water particles are in the range of 1.25–2.5 mm. A 3D laser scanner was used to obtain accurate external profile information from the aggregates, save this information as an STL file, and then import it into PFC3D. The corresponding aggregate model was reconstructed in PFC3D, and the rock particles were finally replaced with the actual external profiles of the aggregates. In this manner, the numerical model of pervious concrete was transformed from the sphere model to clump model, as shown in Figure 2.
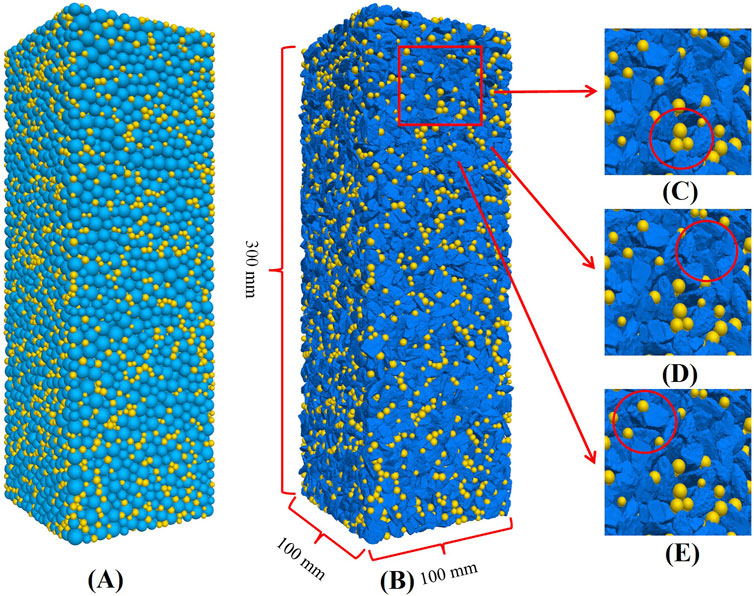
Figure 2. (A) Spherical model (aggregates in blue, water in yellow). (B) Numerical modeling of pervious concrete after conversion of spherical particles to real aggregates. (C) Water in contact with water. (D) Aggregate in contact with aggregate. (E) Aggregate in contact with water.
Because of its high permeability, pervious concrete cannot be saturated with water in practical applications. However, mechanical deterioration occurs under repeated FTCs even if the pervious concrete is not wetted with water. Tests conducted indoors have revealed that during FTCs, the water particles expand along a few internally linked pores. Consequently, the force between the agglomerates is reduced, and the mechanical characteristics are damaged to a greater extent by the closed and microscopic pores than by the connected pores.
2.5.2 Internal contact modeling
This model entails (1) contact between neighboring aggregate particles (aggregate–aggregate contact), (2) contact between water particles, and (3) contact between water and aggregate particles.
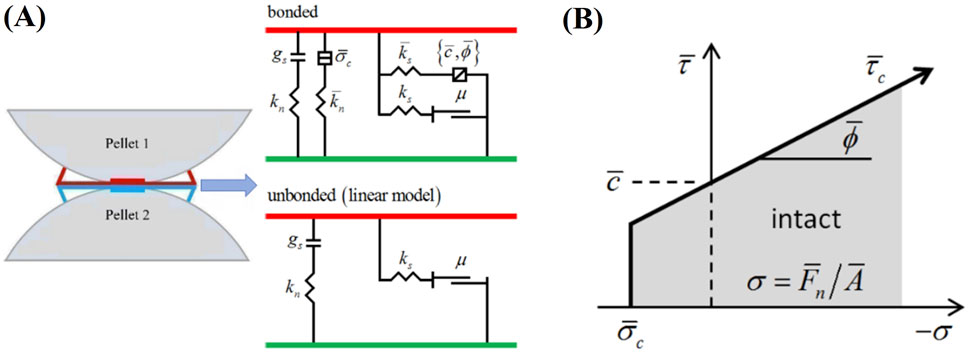
Using the parallel bond model (PBM), the internal contacts in pervious concrete were examined. The schematic representation of the PBM principle is displayed in Figure 3A.
When the particles are bonded, the linear and parallel bond elements cooperate to resist forces and moments. In contrast, when the bond is broken in the non-bonded state, only the linear element is active, which reduces the PBM to a linear model. The strength envelope of the PBM is depicted in Figure 3B, and the stress expressions (Equations 3, 4) as follows [49]:
where:
2.5.3 FTC simulation
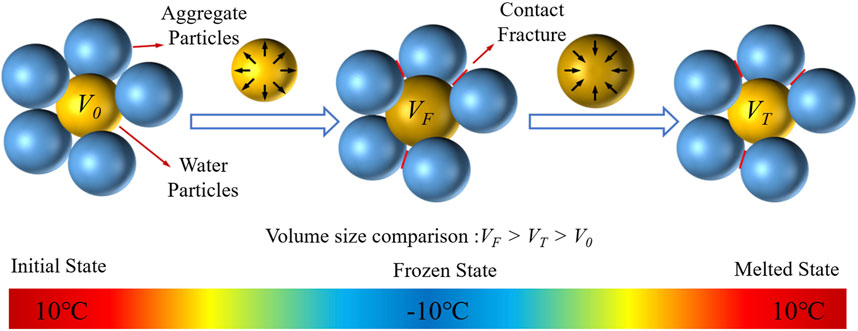
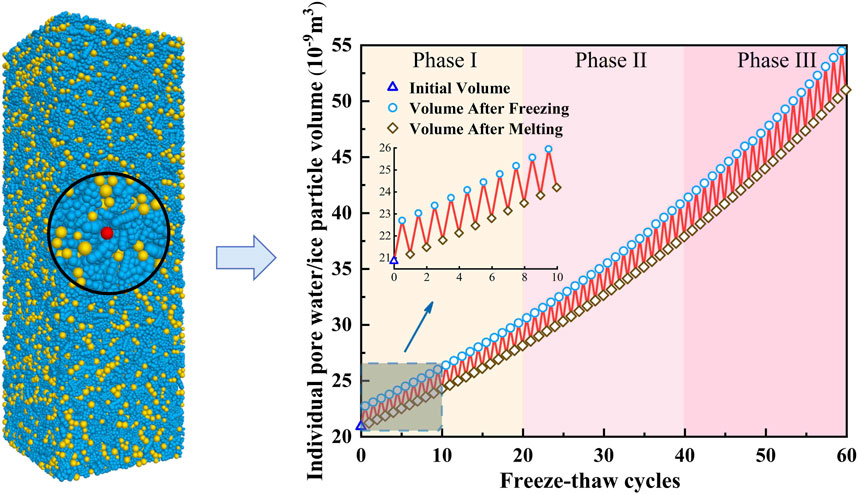
The pore water in the recurring water–ice phase change process that causes volume variations is often responsible for the freeze–thaw damage to pervious concrete. In the frozen state, the water becomes ice with volume expansion, resulting in a certain freezing pressure that squeezes the surrounding aggregate particles to cause interparticle cementation fracture. In the melted state, the ice becomes water and is reabsorbed into the pore space for the next freezing step. This cycling process was implemented through time step integration, with unity time step. The changes in the pore water particle states are shown in Figure 4.
The mechanical properties of pervious concrete diminish as a result of permanent freezing and thawing damage that develops inside the material after several FTCs. A water–ice particle phase-transition-coupled expansion method based on the particle discrete element is proposed from the above analysis of the freeze–thaw damage of pervious concrete. Using the particle flow procedure, the freeze–thaw cycling process of pervious concrete was simulated, and the following assumptions were made:
(1) Pervious concrete specimens were simplified to consist of natural coarse aggregate and pore water particles.
(2) Pervious concrete internal pore moisture seepage was not considered during the freeze–thaw process.
(3) Through temperature changes (warming or cooling), the pore water particles reach the target temperatures consistently. The initial volume
where
Here,
where
The following expression (Equation 9) can be used to determine the volume change relationship with the unfrozen water content during freezing and thawing of the individual pore water particles:
where
where
Based on the numerical computations, the pore water particles in the specimen reach the desired temperature when the designated temperature is attained by either warming or cooling. As a result, once the FTCs achieve the desired temperature, the temperature is no longer maintained constant. Thus, the relationship of temperature change with time is expressed by the following cosine function (Equation 11):
3 Results and analyses
3.1 Compressive and flexural strengths
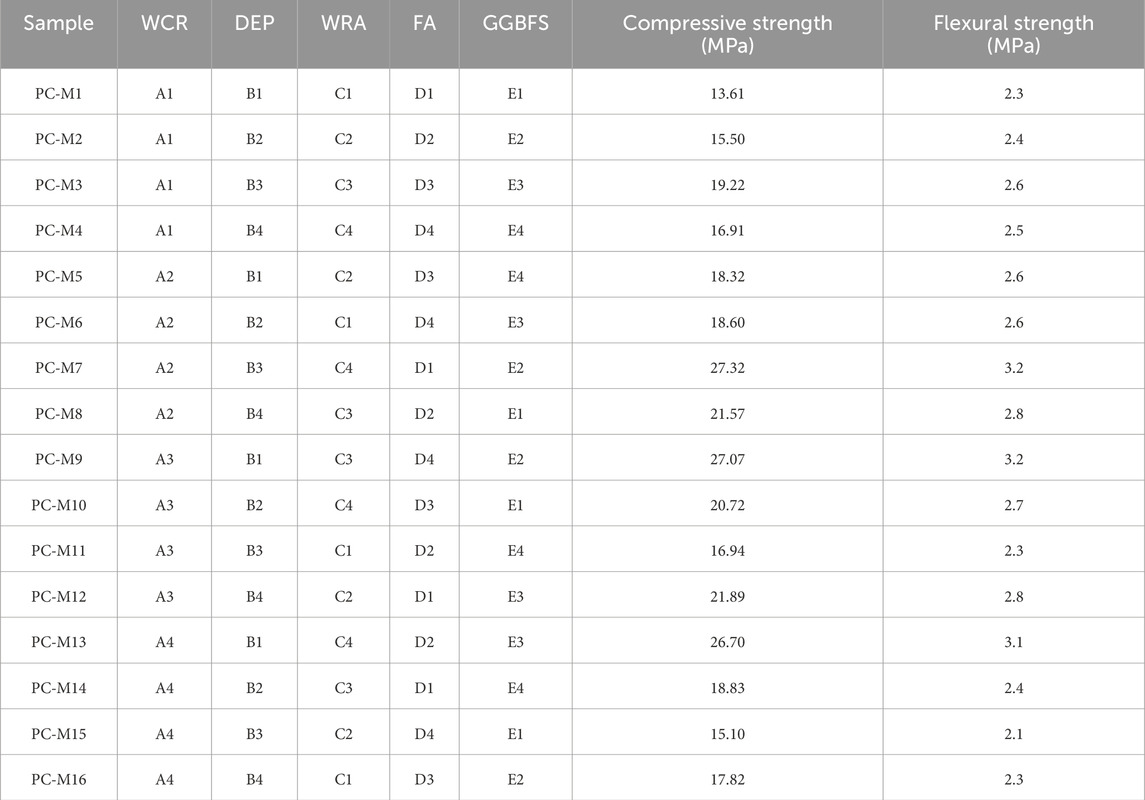
The compressive and flexural strengths of the pervious concrete specimens were measured using a universal testing machine (WAW-3000). For each group of tests, three specimens measuring 100 mm × 100 mm × 100 mm were used to determine the compressive strength, and three specimens measuring 100 mm × 100 mm × 400 mm were used to determine the flexural strength. The average value of the test was used as the result, and when the maximum and minimum values exceeded 15% of the median value, the test data were considered invalid. Table 8 shows the compressive and flexural strength results of the pervious concrete samples. The fundamental mechanical characteristics of pervious concrete can be measured using key indices, such as the compressive and flexural strengths. As shown in Table 8, the pervious concrete specimens exhibit significant variations in both compressive and flexural strengths when subjected to various influences. The maximum compressive strength among the tested pervious concrete specimens is 27.32 MPa, while the minimum compressive strength is 13.61 MPa. Similarly, the maximum flexural strength is 3.2 MPa and minimum flexural strength is 2.1 MPa.
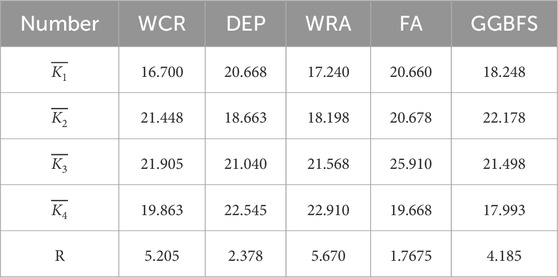
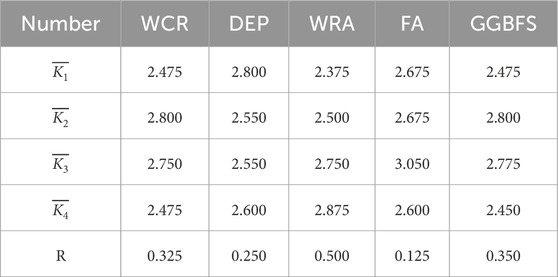
To determine the key factors influencing the compressive and flexural strengths, an analysis using the extreme variance method is necessary. The extreme variance analysis results for the compressive strength are detailed in Table 9, while the results for the flexural strength are presented in Table 10.
As illustrated in Table 9, the factors influencing the compressive strength of pervious concrete in descending order of impact are the WRA dosage, WCR, GGBFS dosage, DEP dosage, and FA dosage. In the absence of other factors or properties, the key conditions for achieving the highest compressive strength in pervious concrete are a WCR of 0.3, DEP dosage of 8%, WRA dosage of 0.3%, FA dosage of 10%, and GGBFS dosage of 5%.
As illustrated in Table 10, the factors influencing the flexural strength of pervious concrete in descending order of impact are WRA dosage, WCR, GGBFS dosage, DEP dosage, and FA dosage. The optimum flexural strength of pervious concrete can be achieved under the following conditions: WCR of 0.28, DEP dosage of 0%, WRA dosage of 0.3%, FA dosage of 20%, and GGBFS dosage of 5%.
3.2 Effective porosity and permeability
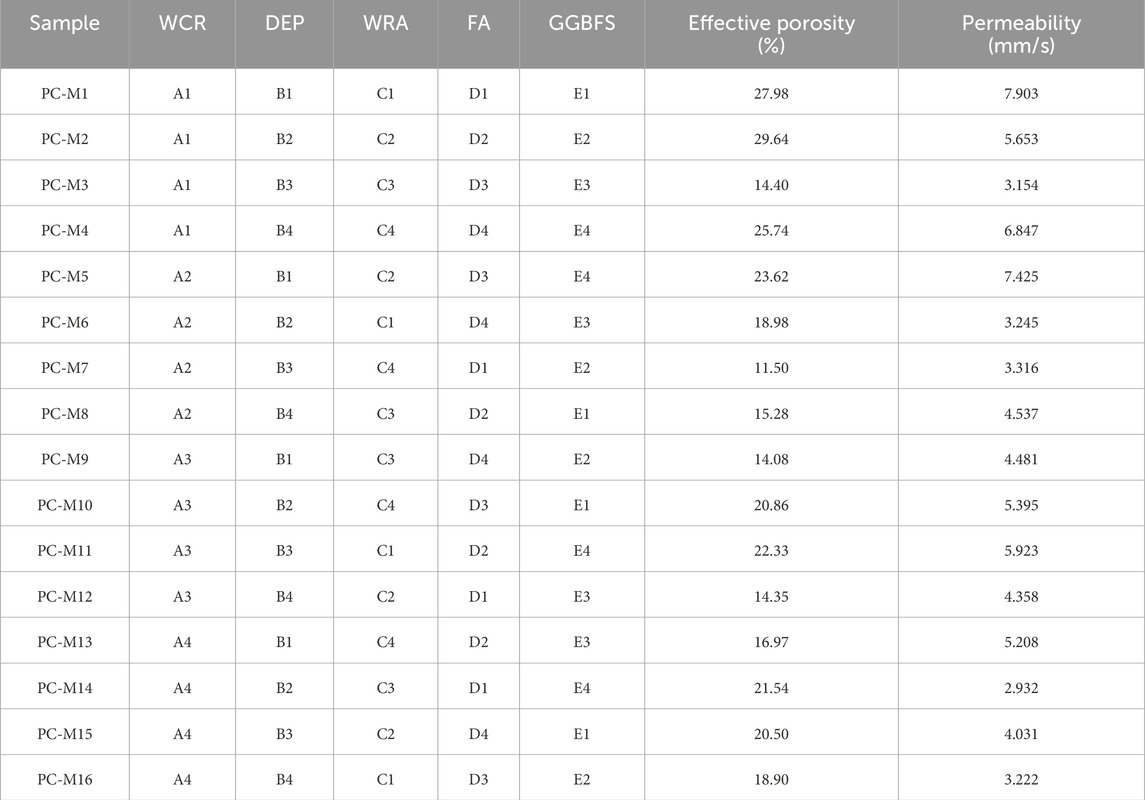
The water permeability coefficient of pervious concrete was calculated using the constant head technique, whereas the effective porosity was determined using the mass approach. To ensure accuracy, three specimens measuring 100 mm × 100 mm × 100 mm each were assessed for each group. The average of the test results was then used as the final data for each group. The measurement results of the effective porosity and water permeability coefficient are shown in Table 11.
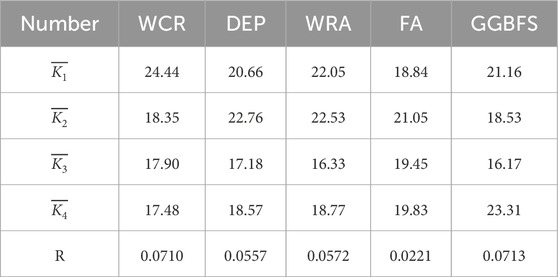
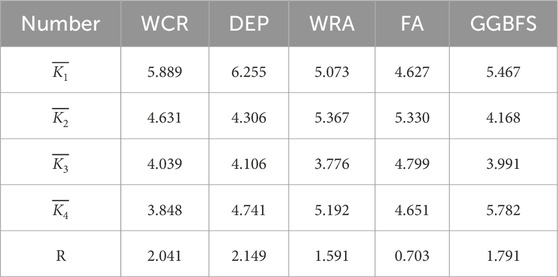
As seen from Table 11, various factors have different degrees of influence on the effective porosity and permeability coefficient; the effective porosities of most of the specimens meet the designed porosity of 15%, while the permeability coefficients meet the specification of 0.5 mm/s. The pervious concrete specimens exhibited a minimum of 11.5% effective porosity and maximum of 29.64%; similarly, the permeability coefficient ranged from 2.932 mm/s to 7.903 mm/s. To ascertain the principal elements impacting the permeability coefficient and effective porosity of pervious concrete, an analysis was conducted using the extreme variance method. Tables 12, 13 display the results of the extreme variance analysis for effective porosity and permeability coefficient, respectively.
As illustrated in Table 12, the factors influencing the effective porosity of pervious concrete in descending order of impact are GGBFS dosage, WCR, WRA dosage, DEP dosage, and FA dosage. In the absence of other factors or properties, the optimal conditions for minimizing the effective porosity of pervious concrete are a WCR of 0.25, DEP dosage of 4%, WRA dosage of 0%, FA dosage of 10%, and GGBFS dosage of 15%.
As illustrated in Table 13, the factors influencing the permeability coefficient of pervious concrete in descending order of impact are DEP dosage, WCR, GGBFS dosage, WRA dosage, and FA dosage. The optimal conditions for achieving the best permeability coefficient for pervious concrete are a WCR of 0.25, DEP dosage of 0%, WRA dosage of 0.1%, FA dosage of 10%, and GGBFS dosage of 10%.
3.3 Freeze–thaw durability
Series 2 samples (100 mm × 100 mm × 300 mm) were prepared using the best resultant preferred proportion (PC-M7) and were subjected to freeze–thaw durability tests. Figures 5A, B, C illustrate the mass and strength losses following 28 d of freeze–thaw damage maintenance. There were no visible damages to the appearance of the pervious concrete samples after 25 FTCs, suggesting that the impact of 25 FTCs was not substantial. The strength and mass losses of the Series 2 samples after 100 FTCs were lower than those of the control pervious concrete samples (without cementitious materials).
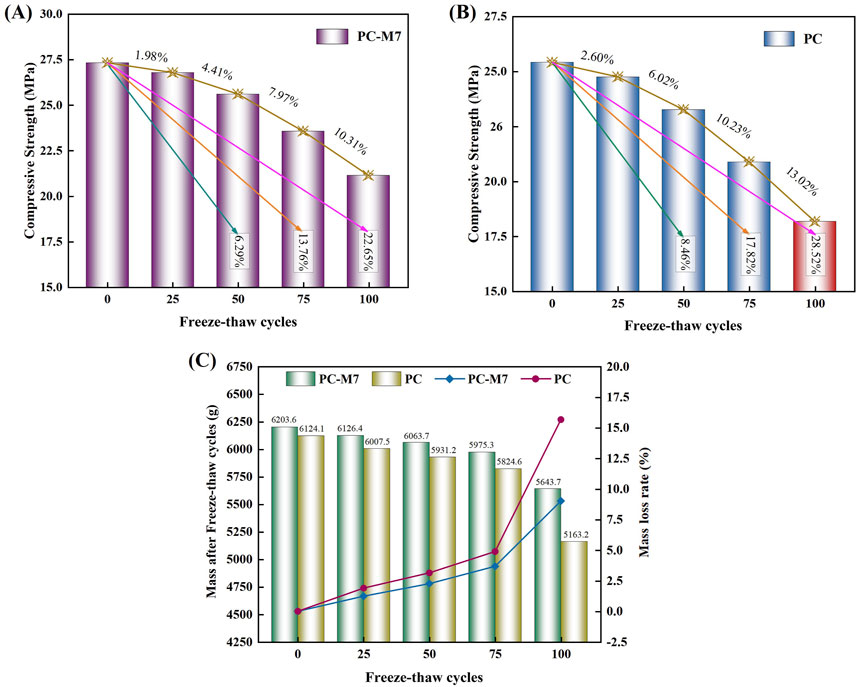
Figure 5. Pervious concrete freeze–thaw damage graphic following a typical curing period of 28 d: (A, B) compressive strength loss; (C) mass loss.
4 Discrete element simulation
4.1 Validation and calibration of parameters
4.1.1 Calibration of parameters
Damage to pervious concrete is caused by a combination of the cement paste bond location between the aggregates and damage to the aggregates themselves. To replicate the actual damages to the specimens, the non-flexible clusters must be converted to flexible clusters to realize the actual fracture of the aggregates. The average radius of the discrete metaparticles generated in the ball generation command was controlled using the FISH language. To achieve a compromise between computational efficiency and accuracy, discrete unit particles with an average radius of 1.0 mm were used instead of rigid aggregate clusters in the aggregate DEM developed in this study. Figure 6 shows the generated flexible cluster model.
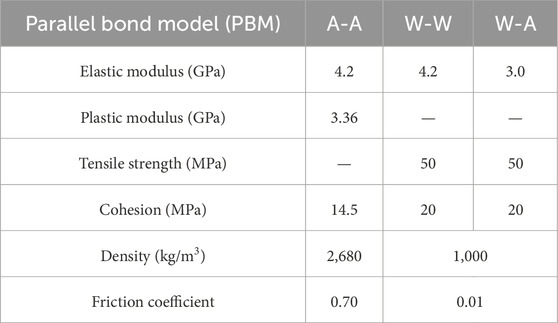
To reduce the complexity of parameter calibrations, the particle and parallel bond moduli as well as the particle and parallel bond stiffness ratios are usually considered equal. In addition, the actual freeze–thaw damage occurs between aggregate skeletons, so it is necessary to set the strength values of water–water interparticle bonding and aggregate–water interparticle bonding large enough to avoid affecting the results. Along with the indoor test results, the trial-and-error method was used to calibrate the fine-scale parameters, and the model fine-scale parameters were finally obtained as shown in Table 14 [36].
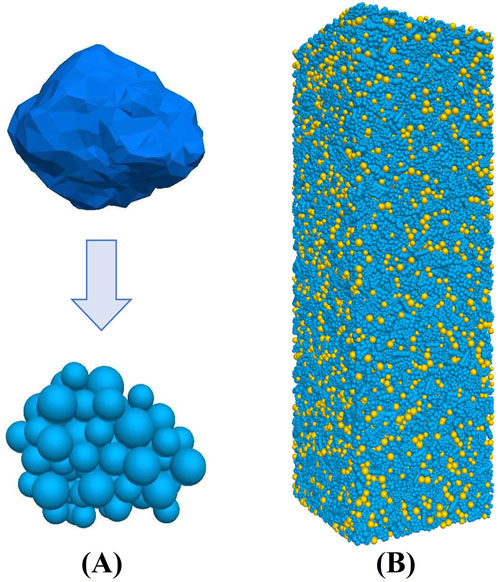
Figure 6. Rigid cluster model of aggregates transformed into the flexible cluster model: (A) conversion of single rigid rock particles to flexible rock particles; (B) conversion of rigid numerical model to flexible numerical model.
4.1.2 Fine-scale parameter validation
The experimental and numerical simulation results of pervious concrete samples for different numbers of FTCs are displayed in Figure 7. The dashed line in Figure 7 indicates that the UCS and modulus of elasticity of pervious concrete are negatively correlated with the number of FTCs. The stress–strain curves from the simulations and tests are essentially similar, as seen in Figure 8, suggesting that the numerical model is a superior representation of the fundamental mechanical characteristics of pervious concrete.
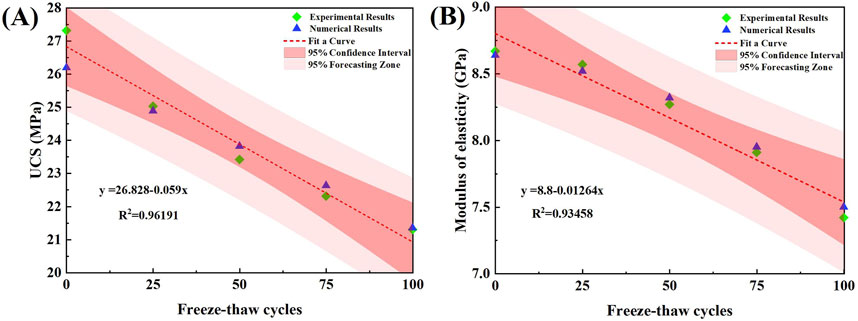
Figure 7. (A) Relationship between the uniaxial compressive strength (UCS) and number of freeze–thaw cycles (FTCs); (B) relationship between modulus of elasticity and number of FTCs.
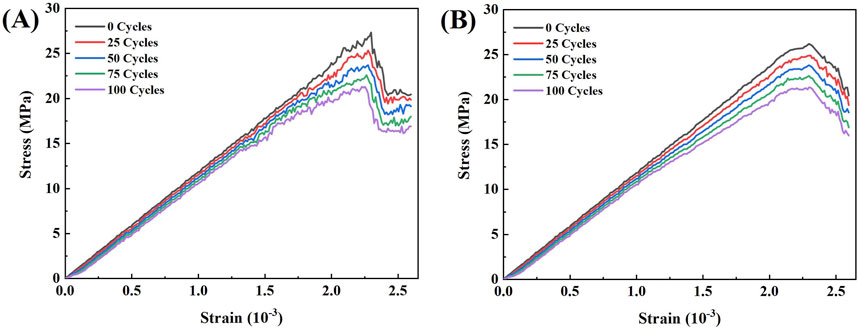
Figure 8. (A) Experimental and (B) simulation results for the stress–strain curves based on different numbers of FTCs.
4.2 Numerical simulations
4.2.1 Effects of FTCs on pervious concrete
The volume changes of individual water particles were calibrated during the FTC, and the changes in the volume of water particles with temperature after 60 FTCs are plotted in Figure 9; it can be seen that the amount of changes in the volume of the water particles after freezing and thawing are relatively small during the early stages, whereas these change are more obvious in the middle and later stages of freezing and thawing.
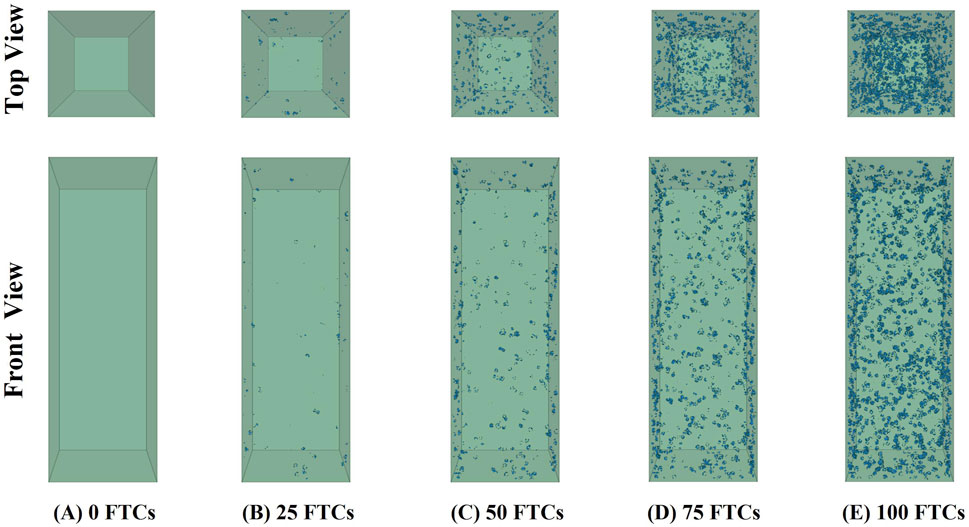
The internal pore water in the frozen state undergoes volume expansion, resulting in a freezing pressure due to pore expansion. With each FTC, the pore volume increases, allowing more water to enter during the next freeze. As a result, the volume expansion of pore water increases again, leading to the formation of microcracks. Figure 10 shows the distribution of microcracks in the internal contact fracture after every 25 FTCs, and it can be seen that microcracks are generated from the surface toward the interior.
Figure 11 shows that after 25, 50, 75, and 100 FTCs, more number of tensile microcracks are produced than shear microcracks, indicating that tensile microcracks are dominant during the freezing and thawing cycles. With the freezing and thawing cycle, the tensile microcracks gradually develop and increase in all directions mainly due to the decrease in temperature, whereby the pore water particles become ice particles and expand, causing extrusion of the surrounding rock particles. This is mainly attributable to the volume expansion of the pore water particle phase into ice particles with decrease in temperature, which results in extrusion of the surrounding rock particle skeleton. In terms of the shear microcracks, more disorder is observed while the numbers produced in the prefreezing and thawing stages are small; the development in the later stage is then relatively faster, indicating that deterioration due to damage of the specimen is more significant in the later stages of freezing and thawing.
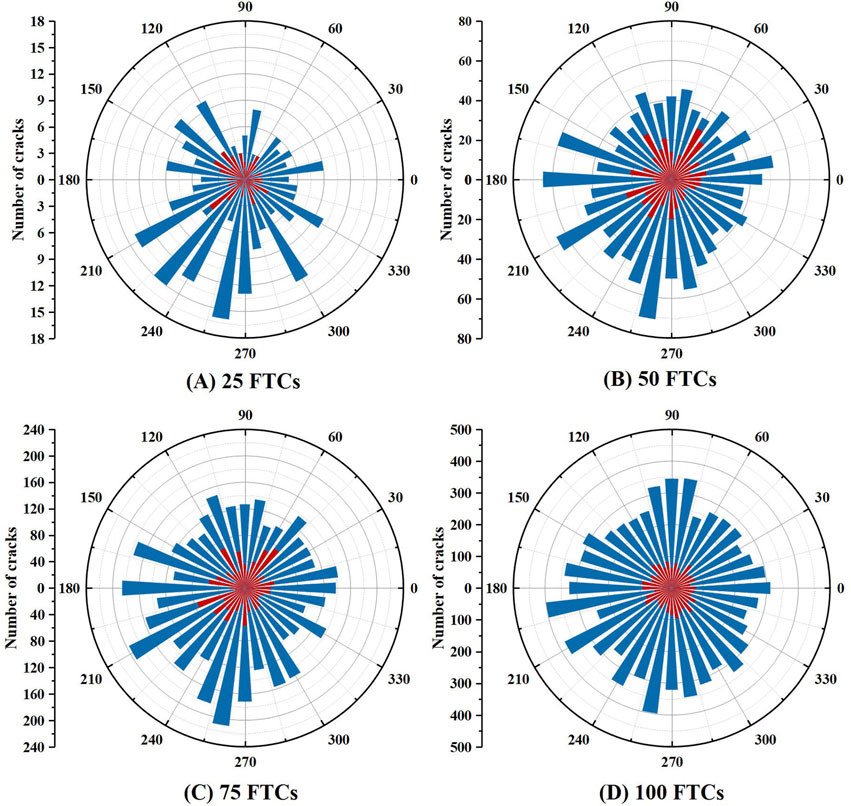
Figure 11. Crack rose diagrams for (A) 25, (B) 50, (C) 75, and (D) 100 FTCs (tensile cracks in blue, shear cracks in red).
Supplementary Figure S1 shows the distribution of cracks as well as damage to the aggregates and bond point after uniaxial compressive test of the specimens under different numbers of FTCs. From Figure 10, it can be seen that the FTCs induced cracks around the model and that the number of cracks in the permeable concrete increased abruptly with increasing numbers of FTCs, resulting in a decrease of the UCS. With increasing stress, the cracks were gradually and mostly concentrated around the freeze–thaw cracks, eventually forming the damage pattern shown in Supplementary Figure S1.The model reflects the residual strains generated and captures the cumulative damage of the pervious concrete samples below the cracks through observation of the crack formation process. The modulus of elasticity of pervious concrete decreases as the number of FTCs increases, as shown in Figure 7B. The experimental and simulated strain energies are computed by Equation 12 and the stress-strain curves shown in Figure 8.
where
Based on the stress–strain data of the specimens for different numbers of FTCs, as shown in Figure 8A, the strain energies were calculated (Supplementary Figure S2). In the absence of FTCs, the strain energy was measured as 70.66 kJ/m3. With increasing cycle counts, this energy reduces to 67.21 kJ/m3 for 25 cycles, 22.64 kJ/m3 for 50 cycles, 12.46 kJ/m3 for 75 cycles, and 11.25 kJ/m3 for 100 cycles, marking reductions of 6.30%, 67.96%, 82.37%, and 84.10%, respectively, compared to the absence of FTCs. As a result, the strain energies of the specimens and number of FTCs have an inverse relationship consistent with the patterns seen in UCS and changes in modulus of elasticity with increasing numbers of FTCs.
4.2.2 Impact of porosity on pervious concrete under FTC regulation
Four samples with different porosity levels (10%, 15%, 20%, and 25%) were tested through FTCs to examine the effects of porosity on pervious concrete while maintaining all other microscopic parameters constant. The results showed that samples with higher porosities were more prone to rupture, as shown in Supplementary Figure S3. This indicates that porosity has a direct effect on the mechanical properties of pervious concrete in the presence of FTCs. The axial compressive strength of pervious concrete after 50 FTCs showed that the modulus of elasticity and UCS are closely correlated with porosity. The initial UCS and modulus of elasticity are maximal at 29.86 MPa and 11.21 GPa, respectively, for pervious concrete with 10% porosity. As the porosity increased from 10% to 25%, the UCS and elastic modulus decreased gradually.
Supplementary Figure S4 illustrates the manner in which porosity directly affects the decay constants for the modulus of elasticity and UCS, indicating that porosity directly affects the performance of pervious concrete following repeated FTCs. For instance, after 50 FTCs, the UCS of pervious concrete with 10% porosity was 27.68 MPa; after 50 FTCs, the UCS dropped by 4.12% from the starting value. Following 50 FTCs, the loss rate of the UCS increased with porosity, reaching 7.16%, 12.46%, and 16.35%. The starting UCS, modulus of elasticity, decay constant, and FTC fluctuation pattern for the simulations are in agreement with the experimental findings. The is mainly because large pores are the weak points of stress transfer in pervious concrete, and higher porosity means that the stress concentration is more visible. The integrity of the specimens was severely damaged as a result of more water being pumped into the pores following the FTCs.
5 Conclusion
The present study involved various formulations of pervious concrete, with differences in the amounts of DEP, WRA, FA, and GGBFS used, for assessing the effects of FTCs and measuring the compressive strengths of the samples following a standard 28-day curing period. Next, using PFC3D as the evaluation framework, an actual aggregate model of pervious concrete was created. The damage caused by repeated FTCs to pervious concrete as well as the correlations among initial UCS, porosity, and decay constant were examined using a PBM. The following are the primary conclusions of this study:
(1) Compared to the control group, the addition of 8% DEP, 0.2% WRA, 10% FA, and 5% GGBFS to pervious concrete based on a WCR of 0.28 resulted in strength losses of 0.62%, 2.17%, 4.06%, and 5.87% after 25, 50, 75, and 100 FTCs as well as mass losses of 0.66%, 0.89%, 1.21%, and 6.66%, respectively.
(2) Using PFC3D software, models of pervious concrete were created based on actual aggregates, and the accuracies of these PBM-based models were confirmed by contrasting the outcomes of numerical simulations with experimental data. The mechanical parameters of pervious concrete were numerically calculated after 25 FTCs through uniaxial compressive tests, and the findings showed good agreement with the experimental data. These results provide reference values for practical applications.
(3) By monitoring the locations of cracks and compression failures in the broken samples and by creating a complete record of the damage process, the simulation results of the gradual damage process of pervious concrete were obtained, providing effective and feasible technical references for actual conditions.
(4) Using various porosity and starting UCS values for pervious concrete, the impact on the decay constant was examined. The modulus of elasticity and decay constant of UCS were directly correlated with porosity, suggesting that the FTCs had greater impacts on pervious concrete with higher porosities. Conversely, the initial UCS and its decay constant are inversely related. As a result, the decay constants of UCS and elastic moduli of pervious concrete can be easily calculated following an arbitrary number of FTCs by considering the initial values.
Data availability statement
The original contributions presented in this study are included in the article/Supplementary Material, and any further inquiries may be directed to the corresponding author.
Author contributions
QX: writing–original draft and writing–review and editing. BG: conceptualization, investigation, software, writing–original draft, and writing–review and editing. HD: investigation, methodology, software, supervision, and writing–review and editing. JZ: investigation, methodology, software, supervision, and writing–review and editing.
Funding
The authors declare that financial support was received for the research, authorship, and/or publication of this article. This research was sponsored by the Training Scheme for Young Backbone Teachers in Colleges and Universities in Henan Province (no. 2019-163), Excellent Teaching Case Project of Professional Degree Postgraduates in Henan Province (no. 2022-115), Scientific Research Foundation of Graduate School of Xinyang Normal University (no. 2024KYJJ107), Special Projects of Key R&D and Promotion in Xinyang City (no. 20220055), and Key Scientific and Technological Projects in Henan Province (no. 232102320196).
Conflict of interest
The authors declare that the research was conducted in the absence of any commercial or financial relationships that could be construed as a potential conflict of interest.
Publisher’s note
All claims expressed in this article are solely those of the authors and do not necessarily represent those of their affiliated organizations, or those of the publisher, the editors and the reviewers. Any product that may be evaluated in this article, or claim that may be made by its manufacturer, is not guaranteed or endorsed by the publisher.
Supplementary material
The Supplementary Material for this article can be found online at: https://www.frontiersin.org/articles/10.3389/fphy.2024.1466191/full#supplementary-material
SUPPLEMENTARY FIGURE 1Uniaxial compression damage for different numbers of FTCs.
SUPPLEMENTARY FIGURE 2Peak total strain energy versus number of FTCs.
SUPPLEMENTARY FIGURE 3Relationships between the elasticity modulus, number of FTCs, and uniaxial compressive strength of the pervious concrete for different porosities.
SUPPLEMENTARY FIGURE 4Impacts of porosity and attenuation constant on the characteristics of the pervious concrete.
References
1. Guan X, Wang J, Xiao F. Sponge city strategy and application of pavement materials in sponge city. J Clean Prod (2021) 303:127022. doi:10.1016/j.jclepro.2021.127022
2. Lund MS, Kevern JT, Schaefer VR, Hansen KK. Mix design for improved strength and freeze-thaw durability of pervious concrete fill in pearl-chain bridges. Mater Structures (2017) 50:42–15. doi:10.1617/s11527-016-0907-4
3. Bilal H, Chen T, Ren M, Gao X, Su A. Influence of silica fume, metakaolin and sbr latex on strength and durability performance of pervious concrete. Construction Building Mater (2021) 275:122124. doi:10.1016/j.conbuildmat.2020.122124
4. Adil G, Kevern JT, Mann D. Influence of silica fume on mechanical and durability of pervious concrete. Construction Building Mater (2020) 247:118453. doi:10.1016/j.conbuildmat.2020.118453
5. Zhong R, Wille K. Material design and characterization of high performance pervious concrete. Construction Building Mater (2015) 98:51–60. doi:10.1016/j.conbuildmat.2015.08.027
6. Bonicelli A, Giustozzi F, Crispino M. Experimental study on the effects of fine sand addition on differentially compacted pervious concrete. Construction Building Mater (2015) 91:102–10. doi:10.1016/j.conbuildmat.2015.05.012
7. Li H, Xu C, Dong B, Chen Q, Gu L, Yang X. Enhanced performances of cement and powder silane based waterproof mortar modified by nucleation csh seed. Construction Building Mater (2020) 246:118511. doi:10.1016/j.conbuildmat.2020.118511
8. Li H, Xue Z, Liang G, Wu K, Dong B, Wang W. Effect of cs-hs-pce and sodium sulfate on the hydration kinetics and mechanical properties of cement paste. Construction Building Mater (2021) 266:121096. doi:10.1016/j.conbuildmat.2020.121096
9. Nazeer M, Kapoor K, Singh S. Strength, durability and microstructural investigations on pervious concrete made with fly ash and silica fume as supplementary cementitious materials. J Building Eng (2023) 69:106275. doi:10.1016/j.jobe.2023.106275
10. Wu H, Liu Z, Sun B, Yin J. Experimental investigation on freeze–thaw durability of portland cement pervious concrete (pcpc). Construction Building Mater (2016) 117:63–71. doi:10.1016/j.conbuildmat.2016.04.130
11. Hesami S, Ahmadi S, Nematzadeh M. Effects of rice husk ash and fiber on mechanical properties of pervious concrete pavement. Construction Building Mater (2014) 53:680–91. doi:10.1016/j.conbuildmat.2013.11.070
12. Saboo N, Shivhare S, Kori KK, Chandrappa AK. Effect of fly ash and metakaolin on pervious concrete properties. Construction Building Mater (2019) 223:322–8. doi:10.1016/j.conbuildmat.2019.06.185
13. Qin L, Gao X, Su A, Li Q. Effect of carbonation curing on sulfate resistance of cement-coal gangue paste. J Clean Prod (2021) 278:123897. doi:10.1016/j.jclepro.2020.123897
14. Yang X, Liu J, Li H, Ren Q. Performance and itz of pervious concrete modified by vinyl acetate and ethylene copolymer dispersible powder. Construction Building Mater (2020) 235:117532. doi:10.1016/j.conbuildmat.2019.117532
15. Anderson I, Dewoolkar MM. Laboratory freezing-and-thawing durability of fly ash pervious concrete in a simulated field environment. ACI Mater J (2015) 112. doi:10.14359/51687921
16. Chindaprasirt P, Jaturapitakkul C, Sinsiri T. Effect of fly ash fineness on compressive strength and pore size of blended cement paste. Cement and concrete composites (2005) 27:425–8. doi:10.1016/j.cemconcomp.2004.07.003
17. Santos WF, Quattrone M, John VM, Angulo SC. Roughness, wettability and water absorption of water repellent treated recycled aggregates. Construction Building Mater (2017) 146:502–13. doi:10.1016/j.conbuildmat.2017.04.012
18. Ebrahimi K, Daiezadeh MJ, Zakertabrizi M, Zahmatkesh F, Korayem AH. A review of the impact of micro-and nanoparticles on freeze-thaw durability of hardened concrete: mechanism perspective. Construction Building Mater (2018) 186:1105–13. doi:10.1016/j.conbuildmat.2018.08.029
19. Vancura M, MacDonald K, Khazanovich L. Microscopic analysis of paste and aggregate distresses in pervious concrete in a wet, hard freeze climate. Cement and Concrete Composites (2011) 33:1080–5. doi:10.1016/j.cemconcomp.2011.05.011
20. Chen L, Li H, Guo Y, Chen P, Atroshchenko E, Lian H. Uncertainty quantification of mechanical property of piezoelectric materials based on isogeometric stochastic fem with generalized n th-order perturbation. Eng Comput (2024) 40:257–77. doi:10.1007/s00366-023-01788-w
21. Chen L, Lian H, Xu Y, Li S, Liu Z, Atroshchenko E, et al. Generalized isogeometric boundary element method for uncertainty analysis of time-harmonic wave propagation in infinite domains. Appl Math Model (2023) 114:360–78. doi:10.1016/j.apm.2022.09.030
22. Chen L, Wang Z, Lian H, Ma Y, Meng Z, Li P, et al. Reduced order isogeometric boundary element methods for cad-integrated shape optimization in electromagnetic scattering. Computer Methods Appl Mech Eng (2024) 419:116654. doi:10.1016/j.cma.2023.116654
23. Lund M, Hansen K, Brincker R, Jensen A, Amador S. Evaluation of freeze-thaw durability of pervious concrete by use of operational modal analysis. Cement Concrete Res (2018) 106:57–64. doi:10.1016/j.cemconres.2018.01.021
24. Giustozzi F. Polymer-modified pervious concrete for durable and sustainable transportation infrastructures. Construction Building Mater (2016) 111:502–12. doi:10.1016/j.conbuildmat.2016.02.136
25. Feng L, Zhang Y, Wang X, Mery S, Akin M, Li M, et al. Impact of deicing salts on pervious concrete pavement. Front Mater (2023) 10:1189114. doi:10.3389/fmats.2023.1189114
26. Sahdeo SK, Ransinchung G, Rahul K, Debbarma S. Effect of mix proportion on the structural and functional properties of pervious concrete paving mixtures. Construction Building Mater (2020) 255:119260. doi:10.1016/j.conbuildmat.2020.119260
27. Tsang C, Shehata MH, Lotfy A. Optimizing a test method to evaluate resistance of pervious concrete to cycles of freezing and thawing in the presence of different deicing salts. Materials (2016) 9:878. doi:10.3390/ma9110878
28. Nassiri S, AlShareedah O, Rodin III H, Englund K. Mechanical and durability characteristics of pervious concrete reinforced with mechanically recycled carbon fiber composite materials. Mater Structures (2021) 54:107. doi:10.1617/s11527-021-01708-8
29. Zou D, Wang Z, Shen M, Liu T, Zhou A. Improvement in freeze-thaw durability of recycled aggregate permeable concrete with silane modification. Construction Building Mater (2021) 268:121097. doi:10.1016/j.conbuildmat.2020.121097
30. Nguyen DH, Sebaibi N, Boutouil M, Leleyter L, Baraud F. A modified method for the design of pervious concrete mix. Construction Building Mater (2014) 73:271–82. doi:10.1016/j.conbuildmat.2014.09.088
31. Borhan TM, Al Karawi RJ. Experimental investigations on polymer modified pervious concrete. Case Stud Construction Mater (2020) 12:e00335. doi:10.1016/j.cscm.2020.e00335
32. AlShareedah O, Nassiri S. Spherical discrete element model for estimating the hydraulic conductivity and pore clogging of pervious concrete. Construction Building Mater (2021) 305:124749. doi:10.1016/j.conbuildmat.2021.124749
33. Xie C, Yuan L, Zhao M, Jia Y. Study on failure mechanism of porous concrete based on acoustic emission and discrete element method. Construction Building Mater (2020) 235:117409. doi:10.1016/j.conbuildmat.2019.117409
34. Xiao Q, Hu X, Li X, Zhang G, Zhao J. Study on the basic mechanical properties and discrete element method simulation of permeable concrete. Sustainability (2023) 15:13310. doi:10.3390/su151813310
35. Ng K, Dai Q. Numerical investigation of internal frost damage of digital cement paste samples with cohesive zone modeling and sem microstructure characterization. Construction Building Mater (2014) 50:266–75. doi:10.1016/j.conbuildmat.2013.09.025
36. Zhao H, Geng Q, Liu X. Influence of freeze–thaw cycles on mechanical properties of pervious concrete: from experimental studies to discrete element simulations. Construction Building Mater (2023) 409:133988. doi:10.1016/j.conbuildmat.2023.133988
37. Xiang J, Liu H, Lu H, Gui F. Degradation mechanism and numerical simulation of pervious concrete under salt freezing-thawing cycle. Materials (2022) 15:3054. doi:10.3390/ma15093054
38. Wu P, Liu Y, Peng X, Chen Z. Peridynamic modeling of freeze-thaw damage in concrete structures. Mech Adv Mater Structures (2023) 30:2826–37. doi:10.1080/15376494.2022.2064015
39. Xu F, Li X, Xiong Q, Li Y, Zhu J, Yang F, et al. Influence of aggregate reinforcement treatment on the performance of geopolymer recycled aggregate permeable concrete: from experimental studies to pfc 3d simulations. Construction Building Mater (2022) 354:129222. doi:10.1016/j.conbuildmat.2022.129222
40. Huang S, Lu Z, Ye Z, Xin Z. An elastoplastic model of frost deformation for the porous rock under freeze-thaw. Eng Geology (2020) 278:105820. doi:10.1016/j.enggeo.2020.105820
41. Moradllo MK, Qiao C, Ghantous RM, Zaw M, Hall H, Ley MT, et al. Quantifying the freeze-thaw performance of air-entrained concrete using the time to reach critical saturation modelling approach. Cement and Concrete Composites (2020) 106:103479. doi:10.1016/j.cemconcomp.2019.103479
42. Hosseinzadeh N, Montanari L, Qiao C, Suraneni P. Damage in cement pastes and mortars exposed to cacl2 and low-temperature cycles. Mater Structures (2022) 55:105. doi:10.1617/s11527-022-01949-1
43. Taheri BM, Ramezanianpour AM, Sabokpa S, Gapele M. Experimental evaluation of freeze-thaw durability of pervious concrete. J building Eng (2021) 33:101617. doi:10.1016/j.jobe.2020.101617
44. CJJ/T135-2009 (2009). Technical specification for pervious cement concrete pavement. China: Architecture and Building Press Beijing.
45. GB/T50081-2019 (2019). Standard for test methods of concrete physical and mechanical properties. China: Architecture and Building Press Beijing.
46. Zhang Y, Li H, Abdelhady A, Yang J. Comparative laboratory measurement of pervious concrete permeability using constant-head and falling-head permeameter methods. Construction Building Mater (2020) 263:120614. doi:10.1016/j.conbuildmat.2020.120614
47. ASTM. Standard test method for density and void content of freshly mixed pervious concrete (2014) Available from: https://www.astm.org/c1688_c1688m-14a.html (Accessed January 10, 2023).
48. GB/T50082-2009 (2009). The test method of long-term and durability on ordinary concrete. China: Architecture and Building Press Beijing.
49. Tomac I, Gutierrez M. Coupled hydro-thermo-mechanical modeling of hydraulic fracturing in quasi-brittle rocks using bpm-dem. J Rock Mech Geotechnical Eng (2017) 9:92–104. doi:10.1016/j.jrmge.2016.10.001
Keywords: discrete element method, PFC3D, parallel bond model, freeze–thaw cycles, reality modeling
Citation: Xiao Q, Gao B, Deng H and Zhao J (2025) Study on the performance of pervious concrete under freeze–thaw cycle based on PFC3D. Front. Phys. 12:1466191. doi: 10.3389/fphy.2024.1466191
Received: 17 July 2024; Accepted: 02 December 2024;
Published: 10 January 2025.
Edited by:
Yilin Qu, Northwestern Polytechnical University, ChinaCopyright © 2025 Xiao, Gao, Deng and Zhao. This is an open-access article distributed under the terms of the Creative Commons Attribution License (CC BY). The use, distribution or reproduction in other forums is permitted, provided the original author(s) and the copyright owner(s) are credited and that the original publication in this journal is cited, in accordance with accepted academic practice. No use, distribution or reproduction is permitted which does not comply with these terms.
*Correspondence: Qidan Xiao, eGlhb3FpZGFuMjUzQDE2My5jb20=
 Qidan Xiao
 Bo Gao1,2


