 Lin Ren
 Jiehua Zhang
 Fujun Lai
94% of researchers rate our articles as excellent or good
Learn more about the work of our research integrity team to safeguard the quality of each article we publish.
Find out more
ORIGINAL RESEARCH article
Front. Phys., 09 September 2024
Sec. Social Physics
Volume 12 - 2024 | https://doi.org/10.3389/fphy.2024.1462089
This article is part of the Research TopicNetwork Learning and Propagation Dynamics AnalysisView all 14 articles
Introduction: This study investigates the mechanisms of public opinion dissemination and governance strategies during public health events, using a two-stage SIR model informed by the Information Cascade Theory.
Methods: The research employs Gephi visual analysis to identify principal nodes of public opinion and combines model simulations with dynamic propagation analysis to verify the model's precision and applicability.
Results: The findings reveal that pivotal information nodes significantly accelerate the spread of public opinion, while ordinary nodes contribute to the natural attenuation of public discourse due to their strong spontaneous recovery capabilities. The simulation analysis further identifies the optimal timing for government intervention, particularly during the initial and peak phases of public opinion dissemination.
Discussion: Based on the results, the study recommends strategies to strengthen the management of key opinion nodes, enhance public information literacy, optimize policy implementation, and utilize simulation tools to assist in public opinion management. These recommendations offer valuable theoretical and practical insights for managing public opinion during public health events.
As indicated in the 53rd Statistical Report on Internet Development in China, published by the China Internet Network Information Centre (CNNIC) on 22 March 2024, the number of Internet users in China had reached 1.092 billion by December 2023, representing a penetration rate of 77.5%1. The pervasive use of the Internet has facilitated the expression of ideas, but it has also precipitated significant social challenges associated with the proliferation of online public opinion. As indicated in the Global Risks Report 2021, the circulation of online public opinion on significant adverse occurrences not only results in economic losses but also endangers social stability and government credibility. In particular, in the context of COVID-19, the rapid dissemination of online public opinion has served to exacerbate social panic and the spread of rumours, thereby increasing the difficulty of public crisis management2.
The COVID-19 in 2020 had an unprecedented impact on the public health system, economy and social order of various countries. In this context, the rapid dissemination of negative online public opinion may give rise to social panic, policy misunderstanding and the propagation of rumours, thereby further exacerbating the complexity and governance difficulty of public crises [1, 2]. It is becoming increasingly evident from research that the role of digital technology in public health responses is of paramount importance [3]. In particular, during the initial phase of an epidemic, the volume of information exchanged on social media platforms increases exponentially [4], accompanied by a proliferation of misinformation and fake news. The confluence of these factors in the context of information asymmetry had a profound impact on the public’s trust in and compliance with anti-epidemic measures.
During the epidemic in China, several microblogging hotspots emerged, including reports of a woman leaving Hanzhou for Beijing, a patient who failed to report a suspected case in a Wuhan community who subsequently committed suicide, and the case of three members of a family of a retired departmental official in Hubei who were diagnosed with COVID-19 and refused to be quarantined. The rapid dissemination and fermentation of public opinion on the Internet has resulted in these incidents having a significant impact that extends well beyond their immediate consequences. In fact, they have triggered a greater and more persistent social panic. It is therefore of particular importance to monitor public opinion, comprehend the nuances of social opinion and proactively direct and regulate social opinion during a crisis.
The Chinese government places a significant emphasis on the management of public opinion on the Internet. At the Fifth Plenary Session of the 19th CPC Central Committee, the concept of “strengthening the construction of cybercivilisation” was first proposed in the “Recommendations of the Central Committee of the Communist Party of China on the Formulation of the 14th Five-Year Plan for the Development of the National Economy and Society and the Vision and Goals for the 23rd Five-Year Plan.” This document placed considerable emphasis on the importance of the governance of public opinion on the Internet. In his remarks, General Secretary Xi Jinping highlighted the growing significance of the Internet as a key arena for public opinion struggles. He underscored the critical importance of China’s ideological and regime security in the context of these ongoing battles in the digital domain. The implementation of the strategy of “Network Power” and the concept of “Community of Destiny in Cyberspace” has served to further highlight the urgency and importance of cyberspace governance. Consequently, the Chinese government has enacted a series of policies and regulations, including the Cybersecurity Law of the People’s Republic of China, the Data Security Law of the People’s Republic of China, and the Personal Information Protection Law of the People’s Republic of China, with the objective of reinforcing the legal and institutional safeguards for the governance of cyber public opinion.
Online public opinion exerts significant influence on individual decision-making processes, particularly through the mechanisms of information asymmetry [5–7], herd behaviour [8], opinion leaders [9], and emotional contagion [10], among others. These factors, among others, exert an influence on individual decision-making processes. The completeness, vividness and relevance of the quality of opinion information can also exert a significant influence on user behaviour [11, 12]. During the COVID-19 outbreak, the lack of comprehensive and accurate information made internet users more vulnerable to misinformation, which led to irrational behaviors such as following rumors and disclosing personal information [13]. Therefore, beyond strengthening governance through institutional constraints, it is crucial for policymakers to understand evolving public opinion trends and the psychological state of the public. This understanding can help in making timely adjustments to publicity strategies and improving public policies, thereby guiding public opinion more effectively and mitigating adverse effects [14]. Research shows that timely dissemination of official information and active public involvement can significantly reduce the spread of rumors and alleviate panic [15, 16]. Effective governance of online public opinion requires a dual approach: crisis management, which addresses public opinion during a crisis, and prospective guidance, which prepares and manages public opinion before a crisis occurs [17].
The origins of online opinion research can be traced back to the 1990s, when researchers began to apply text analytics techniques from computer science to the prediction and analysis of opinion communication [18]. The advent of social media platforms has precipitated a phase of accelerated development in online opinion research, with researchers increasingly focusing on the far-reaching impact of social media on opinion communication [19, 20]. In terms of research content, studies have primarily focused on the concept and characteristics of online public opinion [21, 39], the governance subject and elemental structure of online public opinion [2, 22], the generation mechanism of online public opinion [23], and the evolutionary trend of online public opinion [42]; [24, 25]). Additionally, studies have explored the prediction and governance of online public opinion [26]. Notably, significant advancements have been made in the field of public opinion life cycle research. The information life cycle theory, proposed by Rogers et al. [27], provides a comprehensive framework for understanding the evolution of public opinion. Building on this theory, researchers have used quantitative analysis to break down the communication of public opinion into four distinct stages: latency, outbreak, spread, and dissipation. These studies not only offer empirical evidence for managing public opinion during emergencies but also provide a scientific foundation for policymakers to design effective intervention strategies [28, 29]. Notably, during the COVID-19, research highlighted the unique characteristics of information dissemination in crises and its significant impact on social stability [30].
In terms of research methods, social network analysis methods [16, 17, 31–33] and improved neural network algorithms [34] have been employed. Furthermore, mathematical modelling methods for multi-subject simulation have been employed, including the SIR improvement models [27, 35], system dynamics models [36], and other methods which have gradually become popular for public opinion governance, and have shown a trend of diversification and disciplinary crossover.
While existing studies have made some progress in understanding the evolution and governance of online public opinion, there are still a number of deficiencies that require further investigation. Firstly, the research methodology employed is relatively homogeneous and lacks a comprehensive strategy that combines qualitative and quantitative analyses. This may result in an incomplete understanding and explanation of the phenomenon of public opinion. Secondly, there are limitations in the data and models used. For example, the data sources may be biased, while the existing algorithms and models may not be able to accurately capture the dynamics and diversity of public opinion. This limits the depth and breadth of the research. Moreover, the interdisciplinary integration is still inadequate, which constrains the capacity of researchers to delve into the intricacies of online public opinion from diverse vantages.
This study addresses the limitations of existing research through the following improvements: Firstly, the utilisation of Gephi software for the visual analysis of public opinion dissemination is presented, thereby offering a novel tool and methodology for the dynamic monitoring and intervention of the dissemination process. This improvement addresses the shortcomings of existing methodologies in identifying dissemination pathways. Secondly, within the context of the pandemic, this study employs a simulation of the public opinion dissemination mechanism on Weibo, extending and refining the two-stage SIR model based on infectious disease modelling. The model incorporates the actual characteristics of public opinion dissemination, thereby enhancing the accuracy and comprehensiveness of the analysis of microblogging network public opinion dissemination.
In conclusion, the contributions of this study can be summarized as follows: firstly, the study integrates information life cycle theory with visualisation tools such as Gephi [37] in order to meticulously characterise the dissemination characteristics of public opinion on Weibo from both temporal and structural perspectives. This approach allows for a more detailed understanding of public opinion propagation during COVID-19. Secondly, this paper builds upon and enhances the two-phase SIR model, which is based on the infectious disease model [35, 38]. It does so by integrating the actual characteristics of public opinion dissemination. This improves the accuracy and comprehensiveness of the analysis of microblogging network public opinion dissemination characteristics, and provides a more effective model for subsequent research.
The remainder of this study is structured as follows: the second part introduces the real-life characteristics of online public opinion communication and conducts visual analysis; the third part conducts theoretical analysis and modelling; the fourth part conducts case simulation and model reliability texting; and the fifth part summarises the findings and puts forward policy recommendations.
In order to align the theoretical analysis with empirical evidence, this section employs visualisation techniques to illustrate the actual trajectory and attributes of public opinion dissemination on Weibo. Firstly, the dissemination of public opinion is mapped out over time by extracting data on the propagation of different negative events on Weibo within the same period. This allows the temporal characteristics of public opinion dissemination to be revealed. Secondly, the life cycle theory of public opinion propagation is employed to analyse the propagation characteristics of microblog public opinion. Ultimately, the Gephi software is employed to distinguish between core and ordinary nodes in the propagation of public opinion, thereby elucidating the structural characteristics of the microblog public opinion propagation path. The aforementioned analysis will furnish data that will inform the subsequent theoretical modelling and analysis.
Gephi is a network analysis software that enables data visualisation. It can visually display the nodes (individuals in the network) and edges (relationships between individuals) of the network. Its powerful graphical processing capabilities and diverse analysis algorithms can be employed to solve the problem of difficult to understand complex network relationships. It is widely used in the visual analysis of social network data [37]. In this paper, the dissemination visualisation analysis of microblog opinion dissemination data was carried out by Gephi. The specific steps included the importation of data in CSV format into Gephi, the calculation of the viewable concatenation within the circle of core nodes, and the multistep filtering, intersection and complementary processing of the degree values of the nodes. Additionally, the redundant nodes were deleted. Subsequently, the number of nodes, the number of edges and the type of graph of the network are analysed, the network parameters are adjusted and the layout is set.
The data employed in this study were sourced from the Weibo platform (https://weibo.com). In order to obtain data pertaining to public opinion on typical negative events related to the COVID-19, we employed the use of crawler technology to collate relevant information from this platform. This encompassed user IDs, time nodes, retweets, comments, likes, comment texts, and location information. The extraction of events is divided into two stages.
In the initial phase of the investigation, the negative events that occurred during the early stages of the COVID-19 were identified through the “zhiweidata” platform (zhiweidata.co). The specific selection criterion is the Event Influence Index (EII), which identifies the six most influential negative events in the EII rankings between 1 December 2019 and 30 June 2020. The EII is calculated based on the cumulative impact of an event’s dissemination on microblogs and is normalised to range from 0 to 100.
In the second step, data mining was conducted on the selected negative events. Initially, the crawler technique was employed to extract the opinion data pertaining to the negative events from the microblogging platform. Subsequently, the raw data were subjected to cleaning procedures, which entailed the removal of hyperlinks, numbering, and redundant symbols, with the objective of ensuring the neatness and coherence of the data set. In instances where data were absent, interpolation or deletion was employed to guarantee the integrity of the data set. In order to eliminate discrepancies between the magnitudes of the data, numerical data such as retweets, comments and likes were normalised.
This paper builds upon the life cycle theory of public opinion [27] to develop a new typology for the life cycle of online public opinion communication during the Coronavirus Disease 2019 (COVID-19) pandemic. The proposed typology categorises the life cycle into five distinct phases: the incubation period, the outbreak period, the decline period, the resurgence period and the calm period. Furthermore, the typology identifies three critical peaks of public opinion intensity. The initial peak, designated “A,” occurs during the incubation period, the subsequent peak, designated “B,” occurs during the outbreak period, and the final peak, designated “D,” occurs during the resurgence period. The aforementioned framework is illustrated in Figure 1.
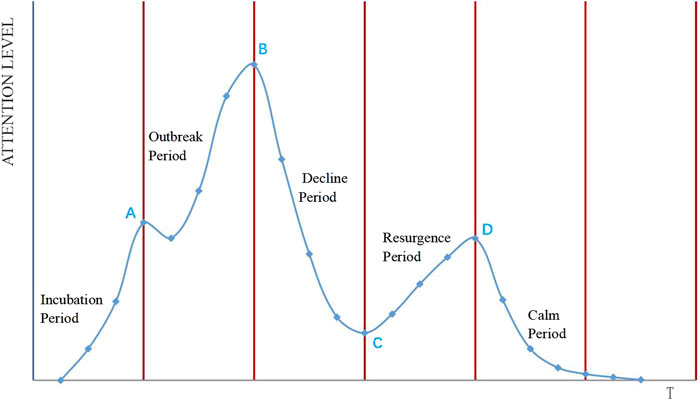
Figure 1. Weibo public opinion dissemination lifecycle diagram.
As illustrated in the aforementioned figure, the incubation period is the interval preceding the level of concern reaching the incubation peak, designated as A. It is possible for there to be one or more incubation peaks during this phase. The outbreak period is the interval between the peak of the incubation period (A) and the peak of the outbreak period (B). It is during this period that public opinion undergoes a rapid intensification, attracting considerable attention. The decline period is the period between the peak of the outbreak period B and the commencement of the resurgence period C, during which there is a gradual decrease in public opinion attention. The resurgence period is the period between the conclusion of the decline period (C) and the peak of the resurgence period (D). During this period, public opinion may intensify once more, and this may occur again and again in the case of multiple resurgence periods. The period of calm is the interval between the peak of the resurgence period and the point at which public opinion reaches zero, indicating a gradual decline in public opinion.
In order to visually observe the evolution of microblog public opinion in the time dimension, the six microblog public opinion hotspot events extracted above were compared with the life cycle of online public opinion dissemination. This was done with a view to portraying their temporal public opinion dissemination evolution. The chart below depicts the evolution of public opinion over time, with the horizontal axis representing the number of days and the vertical axis indicating the degree of public opinion attention, quantified by the number of microblog retweets.
As illustrated in Figure 2, the incidents involving the Huanggang Health Commission’s inadequate epidemic response and the Dali Municipal Government’s expropriation of anti-epidemic materials from Chongqing and Huangshi exhibit a prototypical pattern of incubation, outbreak, decline, and calm periods. In contrast, the collapse of the Quanzhou isolation hospital follows a different pattern, characterised by an additional resurgence period with a distinct peak. A comparative analysis of six representative microblog public opinion events during the global COVID-19 pandemic demonstrates that the life cycle of online public opinion dissemination effectively captures the evolution patterns. The duration, intensity and impact of an event are key factors in determining the presence and prominence of the incubation and resurgence periods. It is noteworthy that these periods may not always manifest as a single peak. In instances where a resurgence period is absent, the decline and stabilisation of public opinion tend to occur concurrently.
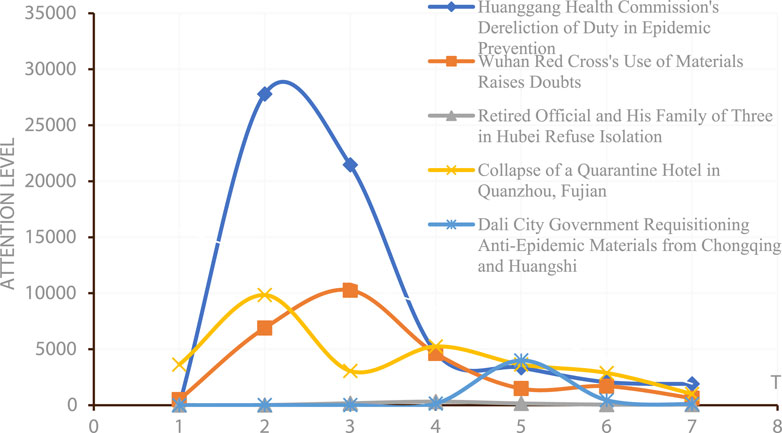
Figure 2. Comparative trend chart of online public opinion spread during public health emergencies.
In order to gain further insight into the communication structure of microblog public opinion events, this paper selects the topic of “Unexplained Pneumonia in Wuhan” on the microblog platform as the research object. The data from this microblog was extracted using crawler technology between 31 December 2019 and 3 January 2020. This included information such as user IDs, comments, retweets and likes. The data regarding retweets, comments and likes were aggregated in order to ascertain the influence of different communication nodes. Accordingly, the following microblog opinion propagation map has been constructed with the assistance of the opinion visualisation tool Gephi, as depicted in Figure 3.
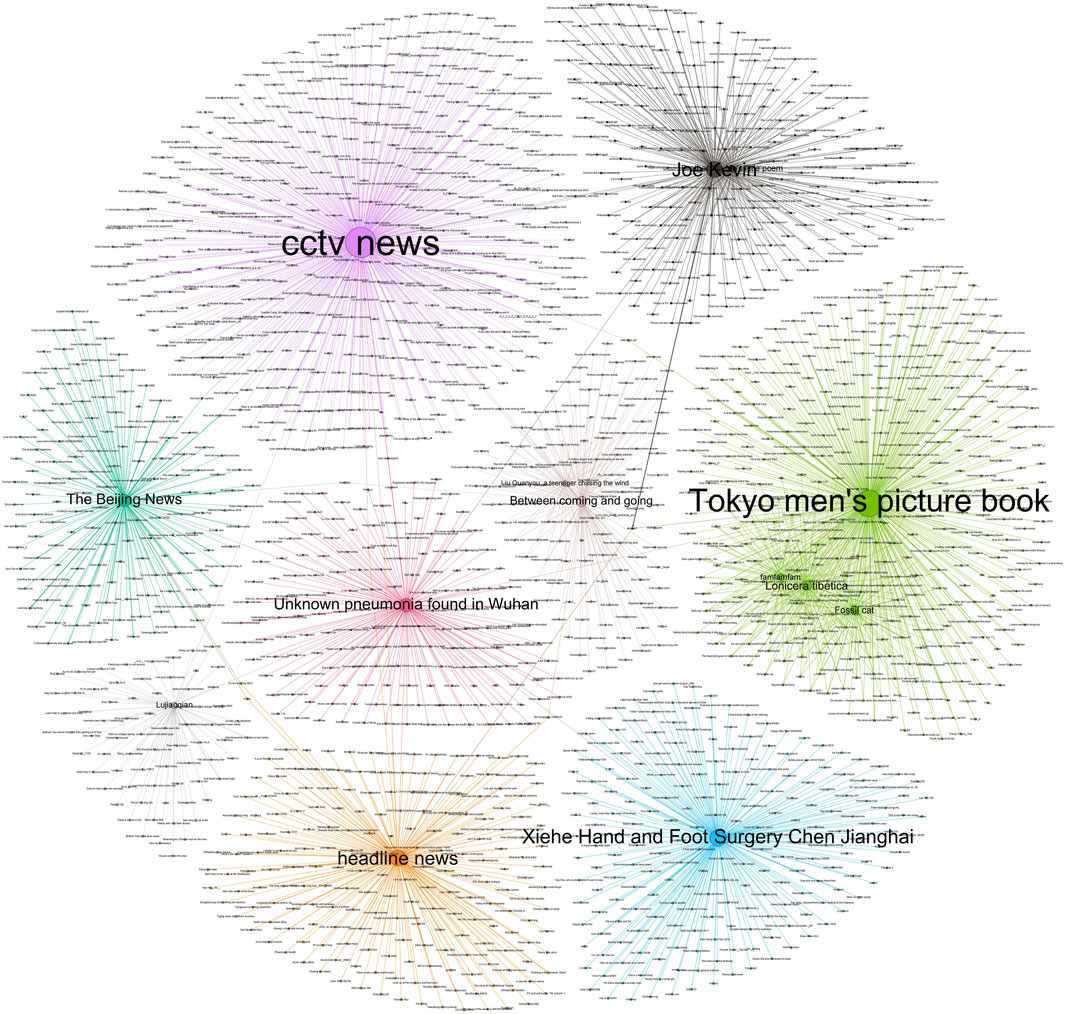
Figure 3. Visualization of online public opinion spread regarding the “Unknown Pneumonia Outbreak in Wuhan” incident.
Figure 3 shows that, under the topic of “Unexplained Pneumonia in Wuhan,” key nodes such as “CCTV News,” “Tokyo Men’s Illustrated Book,” “Xiehe Hand and Foot Surgery,” “Chen Jianghai,” “Headline News,” and “Qiao Kevin” have significantly higher influence compared to secondary nodes like “Between Coming and Going” and “Natsume’s Little Brother.” The number and area of nodes connected to key nodes are notably greater than those of secondary nodes. Key nodes attract substantial attention and drive the event’s dissemination, while secondary nodes further spread the event. This cascading effect makes the “Unexplained Pneumonia in Wuhan” incident a highly influential public opinion event. Using Gephi, we can visualize the communication structure, showing that transmission is node-based, with key nodes triggering wider public opinion. Significant differences in communication impact highlight the crucial role of key nodes in shaping and influencing public sentiment.
The analyses reveal that the dissemination of public opinion during the early stages of the recent COVID-19 outbreak exhibited sudden and fractious characteristics. While Weibo discussions were initially low, information spread rapidly, reflecting the inherent instability of the communication landscape. Netizens often displayed intense negative emotions, with some users significantly influencing information spread through extensive retweets and engagement [30]. Integrating the microblog public opinion life cycle with Gephi’s visualization analysis, we identify four key characteristics of public opinion dissemination during the COVID-19 pandemic:
• Cyclicality: Public opinion dissemination follows distinct phases—latency, outbreak, decline, warming-up, and calming-down—each with unique intensity and propagation patterns.
• Opinion Leaders: Key nodes (opinion leaders) play a crucial role by quickly attracting public attention and further spreading opinions through secondary nodes.
• Context Dependence: Dissemination is influenced by the event’s context and external factors. Changes in anti-epidemic policies and epidemic data updates can rapidly alter dissemination direction and intensity.
• Dynamics: The dissemination process is dynamic, with significant variations in influence among nodes. The dissemination path and intensity of public opinion may fluctuate rapidly.
On the basis of the preceding analysis of microblog opinion dissemination characteristics, this section introduces the Information Cascade Theory to further explore the generation mechanism of microblog online public opinion. The explanatory power of the model is enhanced by the construction of the social utility function of opinion dissemination among microblog users and the application of optimal control theory to optimise the analysis of the dissemination rate of opinions. In conclusion, this paper puts forward a more realistic two-stage SIR model with the aim of providing a comprehensive insight into the propagation mechanism of microblogging online public opinion.
The Information Cascade model, proposed by Bikhchandani et al. [8], reveals that individuals operating in a decentralised manner exert influence and are themselves influenced. Individuals’ behaviours may deviate from the principles of popular rationality, yet they are also susceptible to the influence of the majority group. This can result in a tendency to neglect one’s own perceptions, a phenomenon known as the “illusion of group rationality,” and a proclivity towards blind adherence to the prevailing opinion of the group. This phenomenon is also referred to as “animal spirits” in the context of Information Cascade Theory. Anderson and Holt [40] constructed a general model based on Bayes’ law, which provides a theoretical framework for the Information Cascade Theory.
The phenomenon of the Information Cascade Theory is particularly evident in the context of microblog communication, where the decisions of netizens with regard to their communication are frequently shaped by a desire to align themselves with prevailing trends. In this context, microblog users’ communication decisions are shaped by a combination of rational and irrational factors, resulting in a range of outcomes, including both positive and negative effects. The limited nature of microblogging cyberspace results in a reduction in the rate of public opinion dissemination, which in turn leads to a gradual weakening of the positive effect. As time progresses and the number of participants increases, the cost of dissemination rises, leading to an increase in the negative effect. Nonetheless, the typical lifespan of network memory is only 7 days [30], with the negative effect subsequently diminishing over time. Accordingly, this paper presents a social utility function for microblogging users’ opinion dissemination decisions, based on the trade-off between positive and negative effects, as described in Equations 1–3:
The social utility function for online public opinion dissemination, as proposed in this paper, is based on a trade-off between the two effects generated by public opinion dissemination. The function is constructed as follows:
where P represents the positive effect, N represents the negative effect, and U denotes the total social utility.
The classical SIR infectious disease model is an important mathematical model used in epidemiology to describe the process of infectious disease transmission. The model divides the population into three categories: susceptible (S), infected (I), and immune (R), and simulates the temporal changes in the number of individuals in these three categories through differential equations. The SIR model was first introduced into the analysis of public opinion dissemination by Daley and Kendall [41] who, with the help of the analogy of the spread of infectious diseases, revealed the mechanism of the spread of rumours in society. Building on the SIR model, this study categorises microblog users into three groups: Potential Opinion Spreaders (S), Opinion Spreaders (I), and Opinion Immune Users (R). The former denotes potential information disseminators who have not yet been exposed to public opinion information; the latter, trusting users who have already been exposed to and disseminated public opinion information; and the latter, immunisers, who have ceased disseminating public opinion information. In order to more accurately reflect the intricacies of opinion dissemination, we have enhanced the classical SIR model in two stages, integrating the aforementioned portrayal of dissemination characteristics.
The parameters used in this study are illustrated in Figure 4:
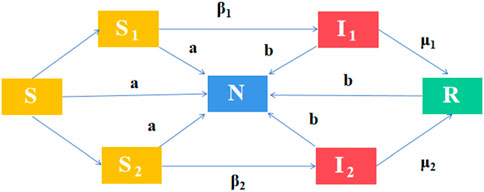
Figure 4. The parameter relationship diagram of the two-stage SIR segmented model.
The symbols for the parameters are defined as follows:
R: Number of opinion immunizers;
N: Total number of Weibo users affected by the opinion;
Furthermore, we propose the following modeling approach for the two-stage SIR model:
The initial propagation phase is the first stage of the process. In this phase, the model introduces two key variables: the growth rate of new followers (
Stage 2: Diffusion spreading stage: As the information disseminates widely, the model also considers the impact of official information disclosure and government intervention. This stage demonstrates a decline in the rate of spread (
In light of the aforementioned enhancements, our proposed two-stage SIR model is capable of simulating the microblog opinion dissemination process in a more comprehensive manner, elucidating the dynamic alterations and attributes of information dissemination across distinct stages.
In fact, four factors merit particular attention: Firstly, the existence of information asymmetry gives rise to suspicion and speculation regarding the source of information, which in turn facilitates the dissemination of false information. Secondly, the tailored recommendations of information sources reinforce confirmation bias, thereby exacerbating the phenomenon of digital echo chambers. Thirdly, the influence of online opinion leaders, the reticence of elite users and the followers of ordinary users has challenged the theory of “The Spiral of Silence.” Fourthly, the “rational” decision-making of dispersed individuals may result in unforeseen distortions of opinion, thereby giving rise to the formation of the “rabble” effect, which in turn serves to promote the development of social irrationality. Collectively, these factors render the phenomenon of the information waterfall susceptible to the formation of public opinion bias in online public opinion events, which in turn exerts an influence on public decision-making. In light of the aforementioned evidence, this paper puts forth the following four hypotheses:
Hypothesis 1. Network Users Have Complete Information Judgement.
Assuming that for an information set
Hypothesis 2. Information Dissemination Among Network Users Is Homogeneous.
Assuming that network users have equal dissemination and trust capabilities, the overall efficiency of information dissemination remains unchanged despite personalized recommendations. Homogeneous dissemination can mitigate the impact of confirmation bias on the overall public opinion and suppress the intensification of the “digital echo chamber” effect. However, due to the varying sizes of nodes, the probability of encountering and disseminating information through different nodes varies, leading to differences in dissemination effectiveness.
Hypothesis 3. Network Users Are Boundedly Rational, and Information Transmission Is Imperfect.
Due to the inability of network users to access fully symmetric information and their bounded rationality, they are more susceptible to the influence of opinion leaders. This bounded rationality leads ordinary users to follow opinion leaders, resulting in the “spiral of silence” phenomenon.
Hypothesis 4. The Total Number of Network Public Opinion Users, N, Dynamically Changes with External Factors such as Propagation and Exit Rates.
Network users are categorized into three types:
In the initial phase of the Weibo opinion dissemination model, the advantages of “following the trend” propagation are perceived to be positive, leading internet users to engage in “irrational” following behaviour by disregarding the information they receive. At this juncture, the number of disseminators increases exponentially, while the dissemination rate stabilises and propagates at a constant rate. To more accurately represent the actual processes occurring in opinion dissemination, this study employs the well-established SIR model for its initial modelling of online opinion diffusion on Weibo. In this model, S, I, and R represent the potential opinion spreaders, active opinion spreaders, and opinion receivers, or “immune” opinion recoverers, respectively. The definitions of the remaining parameter symbols utilized in the first stage are presented in Table 1, and the proof process is detailed in Equations 4–18.

Table 1. Relevant parameters of the equations in the first stage.
Given that
Property 1. The number of potential information disseminators
Proof:
Property 2. When I reaches its maximum value, the intensity of public opinion also peaks.
Proof:
Taking the total differential on both sides, we obtain:
According to Property 1 and using the Euler approximation method, we have:
Therefore, when
Property 3. Given the initial value of
Proof:
Where
In the second stage of Weibo public opinion dissemination, individual users face potential negative consequences (such as loss of personal reputation, account suspension, legal penalties, etc.) due to official information disclosures and government interventions. As a result, if users rationally analyze and assess the existing information before taking action, such rational behavior can lead to an increase in their overall welfare. The definitions of the parameter symbols employed in the second stage are set forth in Table 2.

Table 2. Relevant parameters of the equations in the second stage.
Let
Thus, to examine the optimal time path of
To construct the Hamiltonian function, we have:
And assuming U, P, and N are nonlinear differential functions, the first-order conditions are:
It is easily proven that the first-order conditions maximize the Hamiltonian function, leading to:
The differential equation for
The transversality conditions are:
When
yields:
The term
Moreover,
Thus, the number of potential disseminators at any given time depends on the size of
(1) When the dissemination rate is low,
(2) When the dissemination rate is
(3) When the dissemination rate is higher,
In the model, the dissemination probability
Thus, if the dissemination probability
The first-order condition is:
It can be proven that
The path of
Therefore, in reality, the propagation rate of Weibo public opinion exhibits significant variability as the situation evolves. In the second stage, the multi-agent dynamics in Weibo public opinion lead to a continuous decrease in the propagation rate, eventually converging to zero.
Based on the characteristics of the second stage of propagation, the following model is established:
where
To verify the effectiveness of the proposed modified SIR model, this study selects the Weibo event “Questions Raised on the Wuhan Red Cross Material Usage” as a case. The modified SIR model is used for simulation to validate its effectiveness. Additionally, sensitivity analysis is conducted to ensure the reliability of the model.
On 30 January 2020, Wuhan Renai Hospital, which specializes in plastic surgery and reproductive health, received 16,000 N95 masks donated by the Hubei Red Cross. In contrast, Wuhan Union Hospital, a major facility for treating epidemic patients, only received 3,000 ordinary masks. This discrepancy attracted significant attention, with mainstream media outlets such as China Daily and CCTV reporting on the issue, causing the Weibo public opinion to reach its peak. On February 1, the Hubei Red Cross responded to the donation distribution concerns, Wuhan Red Cross adjusted the targeted donation process, and the Red Cross Society of China dispatched a work team to Wuhan, leading to a gradual calming of the public opinion.
For the case simulation, we selected the “Wuhan Red Cross material usage controversy” event, one of the six key public opinion incidents identified earlier. The study period spanned from 30 January 2020, to 14 February 2020. Data from the “zhiweidata” platform (zhiweidata.co) indicated that the event generated 48,759 original Weibo posts. The event lasted for 14 days and 16 h, peaking at a dissemination rate of 993 posts per hour and an average rate of 21 posts per hour. The peak volume reached 8,636 posts. Additional data, including likes, comments, retweets, and view counts, were also considered.
Data filtering and information fitting provided the following parameters: for key information nodes,
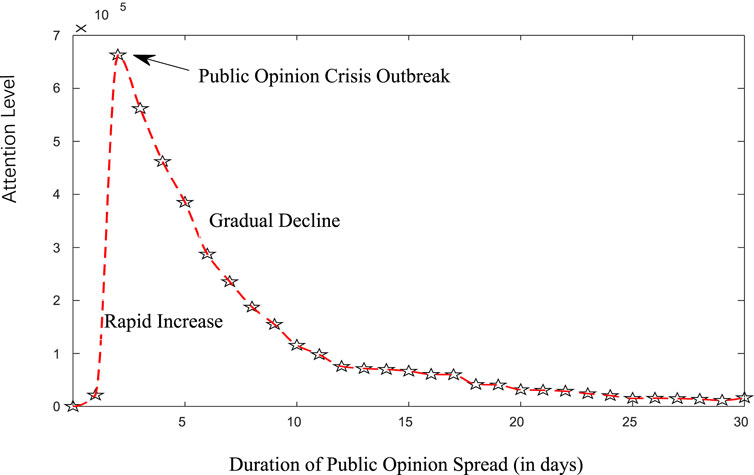
Figure 5. Trend chart of online public opinion spread regarding the “Wuhan Red Cross’s Use of Materials Raises Doubts” incident.
Following the determination of the initial values and parameters of the model based on the aforementioned information, this paper employs Matlab for simulation and analysis. The simulation results derived from real data are illustrated in Figure 6.
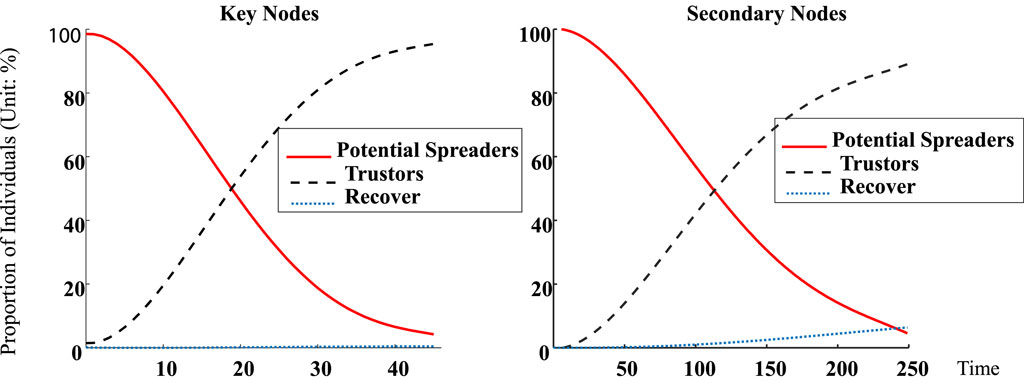
Figure 6. Simulation diagram of public opinion spread in the first stage.
According to the ratio trajectory of the number of key information nodes to the number of common information nodes in the initial stage, it can be observed that:
(1) The key nodes exert a strong driving effect on the ordinary nodes due to their high relevance, exhibiting a high propagation rate and low recovery rate. They possess the key “power” characteristics to promote the triggering of public opinion.
(2) In contrast, the propagation rate of the ordinary nodes is very slow compared with that of the key nodes, and the spontaneous recovery rate of public opinion propagated by the ordinary nodes is high. The propagation process is equipped with an intrinsic immune system that suppresses public opinion.
(3) The propagation of different nodes ultimately reaches its peak, and the ratio of the three types of people can be stabilised.
In the second stage of public opinion dissemination, the dissemination rate
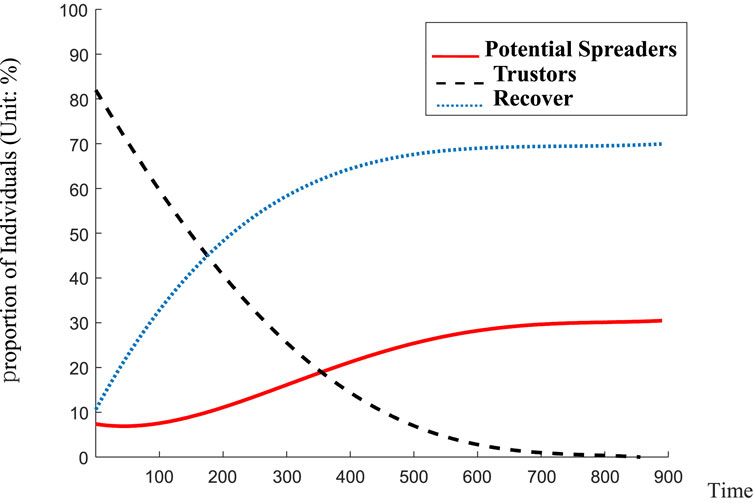
Figure 7. Simulation diagram of public opinion spread in the second stage.
In order to enhance the reliability of the model, this paper conducts a sensitivity analysis by modifying the initial propagation rate, the recovery rate, the decay function and the resistance rate of public opinion information.
When the initial propagation rate in the second stage is reduced to 2.5% while maintaining the initial value of the model and other parameters, it can be observed that the number of opinion information trusters converges to zero at a faster rate. Similarly, an increase in the initial recovery rate to 1.5% while maintaining the remaining parameters constant can facilitate a more rapid decline in the number of opinion information trusters. Furthermore, sensitivity tests with different initial values demonstrate that the speed of convergence of public opinion trustees increases in a sequential manner when the initial propagation rate of the second stage is set to 2%, 1.5%, and 1%, and the initial recovery rate is set to 2%, 2.5%, and 3.5%, respectively. Figure 8 illustrates that by reducing the number of pivotal nodes in the initial stages of public opinion formation and improving the overall quality of public opinion participants, it is possible to exert greater control over the direction of public opinion. This allows for adjustments to be made to the initial dissemination rate and recovery rate in subsequent stages.
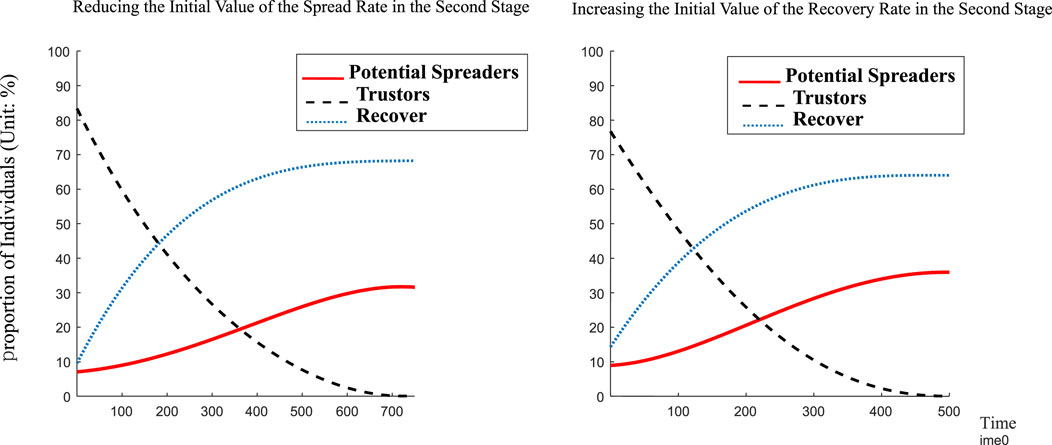
Figure 8. Comparison of the effects of initial spread rate and recovery rate on public opinion spread.
In order to investigate the impact of the decay rate on public opinion propagation, the initial value of the model and other parameters were maintained while the exponential decay function was adjusted to accelerate the decay rate in the second stage. The resulting propagation paths are illustrated in Figure 9, which depicts the effect of increasing the decay speed by a factor of 1 and a factor of 2, respectively. The findings indicate that the rate of convergence of the microblog opinion trustees towards zero is markedly accelerated with an increase in the decay speed of the propagation rate. Consequently, the public opinion management department may further expedite the cooling-off period for public opinion through policy measures such as enhanced supervision and the implementation of a punitive mechanism, thereby achieving more efficacious public opinion management.
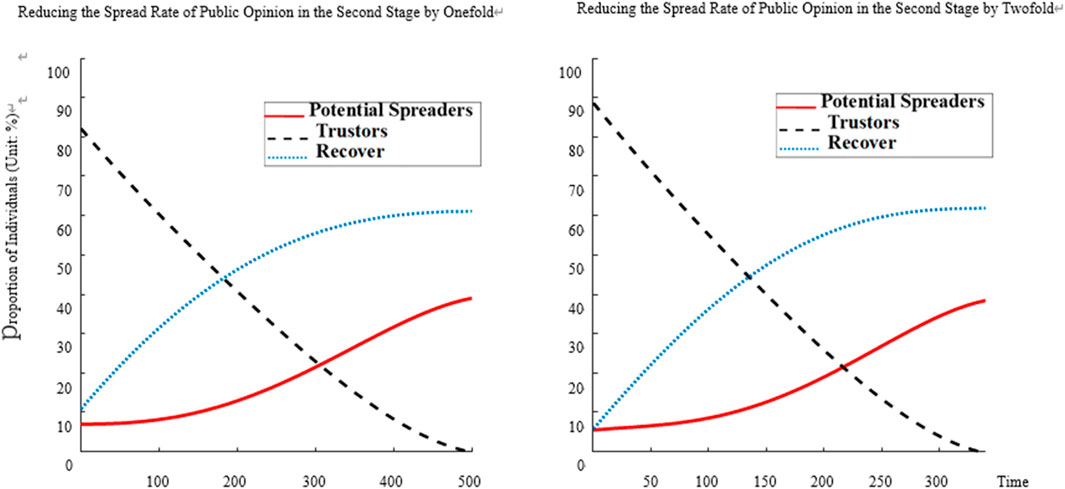
Figure 9. Comparison of the effects of decrease rate of spread rate on public opinion spread.
In order to reduce the rate of secondary infection of public opinion by restorers, the second-stage public opinion information resistance is set at 10% while maintaining the initial value of the model and other parameters. A review of the collected data indicates an increase in the prevalence of popular comments such as “think with the available information” and “stay on the sidelines without direct evidence.” This indicates that microbloggers have become more circumspect in their engagement with public opinion, particularly in light of the repeated instances of factual manipulation. This is evidenced by the observed increase in the capacity to resist public opinion information. Figure 10 illustrates the communication path subsequent to the augmentation of information resistance.
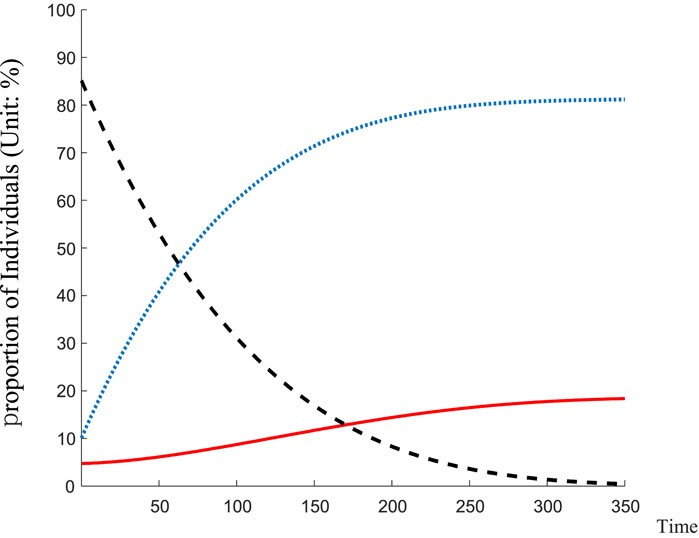
Figure 10. Increasing the resistance probability in the second stage.
As information resistance increases, the number of individuals who trust microblog opinion information decreases rapidly, and the speed at which public opinion stabilises significantly accelerates. It is therefore imperative that effective governance of the second stage of microblog opinion dissemination be established. The ability of microblog users to screen information and their level of resistance to public opinion are the key factors influencing the control and pacification speed of microblog public opinion in this stage.
This study identifies several key aspects of public opinion communication. Firstly, key information nodes exert a significant influence on the dissemination of public opinion, due to their high dissemination rate and low recovery rate. As a result, they are of critical importance in the rapid spread of public opinion. It is of the utmost importance to regulate these nodes in order to prevent the escalation of public opinion. Secondly, while ordinary information nodes propagate at a slower rate, they demonstrate robust spontaneous recovery, thereby playing a pivotal role in the natural suppression of public opinion. Furthermore, public opinion propagation is a dynamic process, with mechanisms that reduce dissemination and enhance recovery contributing to the gradual calming of public opinion, particularly following official intervention. This serves to validate the model’s reliability and applicability. Ultimately, the simulation analysis indicates that the most effective government intervention occurs during the initial and peak stages of public opinion. It is imperative that prompt responses, information clarification and strengthened guidance are provided at these stages in order to effectively control the spread and impact of public opinion.
Establish a dedicated public opinion monitoring system to track and analyze key information nodes in real time. This system should incorporate data mining and sentiment analysis to promptly identify content that may trigger widespread public opinion. Develop and refine an emergency response mechanism with contingency plans to assess and manage risks associated with these nodes. Rapidly deploy specialized teams to handle sudden public opinion events. Strengthen regulations and enforcement by introducing strict laws and penalties for the spread of false information related to these nodes and increase platform oversight to prevent the dissemination of malicious content.
Adopt adaptive policy measures to manage public opinion at different stages. In the initial phase, implement a comprehensive monitoring system to address and clarify false information swiftly to prevent escalation. Develop emergency response plans for timely risk assessment and management. During peak periods, enhance public opinion guidance with positive messaging to control discourse and reduce negative information spread. Monitor key nodes closely to prevent malicious content dissemination and enforce regulations on false information. In the decline phase, focus on stabilizing public sentiment and addressing residual issues through continuous updates and communication to restore social trust.
Optimize official information release strategies to ensure timely and transparent communication, thus preventing escalation due to delays. Establish a dedicated platform for regular updates and information dissemination to build public trust. Create channels for gathering public feedback on public opinion management to refine measures and encourage engagement. Collaborate with media outlets and social platforms to leverage their influence for positive guidance and to minimize negative information spread.
Integrate information literacy courses into educational curriculums to develop critical thinking and evaluation skills. Promote the development and dissemination of tools for verifying information authenticity in collaboration with technology companies. Increase public awareness through multi-channel campaigns, utilizing both social and traditional media, to educate the public on identifying and addressing false information.
Inhance research and data analysis to improve understanding and prediction of public opinion events. Support research institutions and universities in related studies and promote the development of public opinion analysis technologies. Integrate artificial intelligence and big data technologies to optimize monitoring and analysis processes, thereby improving the accuracy of trend predictions and supporting decision-making. Implementing these measures will help develop comprehensive and scientific strategies for effectively managing and controlling public opinion events.
The original contributions presented in the study are included in the article/supplementary material, further inquiries can be directed to the corresponding author.
LR: Data curation, Funding acquisition, Writing–original draft, Writing–review and editing, Conceptualization. JZ: Formal Analysis, Investigation, Project administration, Writing–original draft. ZS: Methodology, Software, Visualization, Writing–review and editing. FL: Resources, Validation, Writing–review and editing. DX: Conceptualization, Supervision, Writing–original draft, Writing–review and editing.
The author(s) declare that financial support was received for the research, authorship, and/or publication of this article. The authors acknowledge the financial support from the Humanities and Social Science Fund of Ministry of Education of China (Grant number 19YJC630136).
The authors declare that the research was conducted in the absence of any commercial or financial relationships that could be construed as a potential conflict of interest.
All claims expressed in this article are solely those of the authors and do not necessarily represent those of their affiliated organizations, or those of the publisher, the editors and the reviewers. Any product that may be evaluated in this article, or claim that may be made by its manufacturer, is not guaranteed or endorsed by the publisher.
1The 53rd Statistical Report on Internet Development in China - Internet Development Research (cnnic.cn).
2Global Risks Report 2021 | World Economic Forum | World Economic Forum (weforum.org).
1. Tsao S-F, Chen H, Tisseverasinghe T, Yang Y, Li L, Butt ZA. What social media told us in the time of COVID-19: a scoping review. The Lancet Digital Health (2021) 3(3):e175–94. doi:10.1016/s2589-7500(20)30315-0
2. Liu ZR. The exploration of government’s management in public opinion crisis under the new media era. Gansu Theor Res (2009)(05) 32–5.
3. Budd J, Miller BS, Manning EM, Lampos V, Zhuang M, Edelstein M, et al. Digital technologies in the public-health response to COVID-19. Nat Med (2020) 26(8):1183–92. doi:10.1038/s41591-020-1011-4
4. Cinelli M, Quattrociocchi W, Galeazzi A, Valensise CM, Brugnoli E, Schmidt AL, et al. The COVID-19 social media infodemic. Scientific Rep (2020) 10(1):16598–10. doi:10.1038/s41598-020-73510-5
5. Akerlof GA. The market for “lemons”: quality uncertainty and the market mechanism. In: Uncertainty in economics. Elsevier (1978). p. 235–51.
6. Harris M, Raviv A. Control of corporate decisions: shareholders vs. management. The Rev Financial Stud (2010) 23(11):4115–47. doi:10.1093/rfs/hhq081
7. Spence M. Job market signaling. In: Uncertainty in economics. Amsterdam, Netherlands: Elsevier (1978). p. 281–306.
8. Bikhchandani S, Hirshleifer D, Welch I. A theory of fads, fashion, custom, and cultural change as informational cascades. J Polit Economy (1992) 100(5):992–1026. doi:10.1086/261849
9. Yin F, Xia X, Song N, Zhu L, Wu J. Quantify the role of superspreaders-opinion leaders-on COVID-19 information propagation in the Chinese Sina-microblog. PloS one (2020) 15(6):e0234023. doi:10.1371/journal.pone.0234023
10. Hatfield E, Cacioppo JT, Rapson RL. Emotional contagion. Curr Dir Psychol Sci (1993) 2(3):96–100. doi:10.1111/1467-8721.ep10770953
11. Böhme R, Moore T. The “iterated weakest link” model of adaptive security investment. J Inf Security (2016) 7(02):81–102. doi:10.4236/jis.2016.72006
12. Daradkeh M, Gawanmeh A, Mansoor W. Information adoption patterns and online knowledge payment behavior: the moderating role of product type. Information (2022) 13(9):414. doi:10.3390/info13090414
13. Citroen CL. The role of information in strategic decision-making. Int J Inf Manag (2011) 31(6):493–501. doi:10.1016/j.ijinfomgt.2011.02.005
14. Wang XQ, Wu QQ. Characteristics, influence and guiding strategies of online public opinion in major epidemics in the era of all-media. Ideological and Theor Education (2020)(03) 102–6. doi:10.13556/j.cnki.dncb.cn35-1274/j.2018.10.027
15. Kou Y, Gui X, Chen Y, Pine K. Conspiracy talk on social media: collective sensemaking during a public health crisis. Proc ACM Human-Computer Interaction (2017) 1(CSCW):1–21. doi:10.1145/3134696
16. Zhao Y, Zhu S, Wan Q, Li T, Zou C, Wang H, et al. Understanding how and by whom COVID-19 misinformation is spread on social media: coding and network analyses. J Med Internet Res (2022) 24(6):e37623. doi:10.2196/37623
17. Himelein-Wachowiak M, Giorgi S, Devoto A, Rahman M, Ungar L, Schwartz HA, et al. Bots and misinformation spread on social media: implications for COVID-19. J Med Internet Res (2021) 23(5):e26933. doi:10.2196/26933
18. Cowie J, Lehnert W. Information extraction. Commun ACM (1996) 39(1):80–91. doi:10.1145/234173.234209
19. Papacharissi Z, de Fatima Oliveira M. Affective news and networked publics: the rhythms of news storytelling on# Egypt. J Commun (2012) 62(2):266–82. doi:10.1111/j.1460-2466.2012.01630.x
20. Tufekci Z, Wilson C. Social media and the decision to participate in political protest: observations from Tahrir Square. J Commun (2012) 62(2):363–79. doi:10.1111/j.1460-2466.2012.01629.x
21. Thelwall M. Blog searching: the first general-purpose source of retrospective public opinion in the social sciences? Online Inf Rev (2007) 31(3):277–289. doi:10.1108/14684520710764069
22. Wang X, Xue XR. The online public opinion crisis and government governance in emergency public events: an analysis based on the online public opinion during the Wenchuan earthquake. Inf and Comput (Theory Edition) (2009)(16) 78+80. doi:10.16381/j.cnki.issn1003-207x.2020.03.006
23. Khan Y, Fazli G, Henry B, de Villa E, Tsamis C, Grant M, et al. The evidence base of primary research in public health emergency preparedness: a scoping review and stakeholder consultation. BMC Public Health (2015) 15:432–13. doi:10.1186/s12889-015-1750-1
24. Tian YL, Li X. An analysis of the evolution path of online public opinion on COVID-19 based on event-logic graph. Inf Stud Theor and Appl (2021) 44(03):76–83. doi:10.1016/j.pubrev.2019.101869
25. Zhang SL, Wang LC, Lou GZ (2021). Research on the public opinion analysis system based on knowledge graph. J Mod Inf, 41(04), 10–6. doi:10.2307/3319808
26. Xu Y, Huang T, Zuo Z, Wang X. Social media sentiment and COVID-19 transmission: results from a time-varying SIR model. PACIS (2021).
27. Rogers EM, Singhal A, Quinlan MM. Diffusion of innovations. In: An integrated approach to communication theory and research. Routledge (2014). p. 432–48.
29. Han SQ. The life cycle study of hot events in online public opinion. Southeast Commun (2018)(10) 88–90. doi:10.1016/S2589-7500(20)30315-0
30. Wang X, Oxholm G, Zhang D, Wang Y-F. Multimodal transfer: a hierarchical deep convolutional neural network for fast artistic style transfer. In: Proceedings of the IEEE conference on computer vision and pattern recognition (2017).
31. Anstead N, O'Loughlin B. Social media analysis and public opinion: the 2010 UK general election. J computer-mediated Commun (2015) 20(2):204–20. doi:10.1109/CVPR.2017.759
32. Rim H, Lee Y, Yoo S. Polarized public opinion responding to corporate social advocacy: social network analysis of boycotters and advocators. Public relations Rev (2020) 46(2):101869. doi:10.1016/j.pubrev.2019.101869
33. Wang Y-M, Guo T-Y, Li W-D, Chen B. Direct immune-SCIR public-opinion propagation model based on real-time online users. Chin Phys B (2020) 29(10):100204. doi:10.1088/1674-1056/aba9c0
34. Dahou A, Xiong S, Zhou J, Haddoud MH, Duan P. Word embeddings and convolutional neural network for Arabic sentiment classification. In: Proceedings of coling 2016, the 26th international conference on computational linguistics (2016) Technical papers.
35. Yuan J, Shi J, Wang J, Liu W. Modelling network public opinion polarization based on SIR model considering dynamic network structure. Alexandria Eng J (2022) 61(6):4557–71. doi:10.1016/j.aej.2021.10.014
36. Zhao JH, Wan KW. Research on the dynamics of public opinion dissemination in social networks based on the information propagation model - SIR infectious disease model. Inf Sci (2017) 35(12):34–8.
37. Jacomy M, Venturini T, Heymann S, Bastian M. ForceAtlas2, a continuous graph layout algorithm for handy network visualization designed for the Gephi software. PloS one (2014) 9(6):e98679. doi:10.1371/journal.pone.0098679
38. Ma N, Liu YJ. A staged modeling analysis of the communication influence of opinion leaders. Chin J Manage Sci (2020) 28(03):52–8. doi:10.1016/j.aej.2021.10.014
39. Wang XW, Xing YF, Zhang L, Li SM. Research on the development trends of online public opinion at home and abroad in the context of social media. Inf and Comput (2017) 38(04):6–14. doi:10.3969/j.issn.1008-0821.2021.04.002
40. Anderson LR, Holt CA. Information cascades in the laboratory. The Am Econ Rev (1997) 847–62. doi:10.2196/37623
41. Daley DJ, Kendall DG. Epidemics and rumours. Nature (1964) 204(4963):1118. doi:10.1038/2041118a0
Keywords: COVID-19, public opinion, visualization, two-stage SIR modeling, simulation
Citation: Ren L, Zhang J, Su Z, Lai F and Xiong D (2024) Evolution and governance of online public opinion during COVID-19: a hybrid approach using communication visualization, SIR modeling, and simulation validation. Front. Phys. 12:1462089. doi: 10.3389/fphy.2024.1462089
Received: 09 July 2024; Accepted: 23 August 2024;
Published: 09 September 2024.
Edited by:
Fei Xiong, Beijing Jiaotong University, ChinaReviewed by:
Chengfang Ye, Xiangtan University, ChinaCopyright © 2024 Ren, Zhang, Su, Lai and Xiong. This is an open-access article distributed under the terms of the Creative Commons Attribution License (CC BY). The use, distribution or reproduction in other forums is permitted, provided the original author(s) and the copyright owner(s) are credited and that the original publication in this journal is cited, in accordance with accepted academic practice. No use, distribution or reproduction is permitted which does not comply with these terms.
*Correspondence: Deping Xiong, eGlvbmdkZXBpbmdAMTI2LmNvbQ==
Disclaimer: All claims expressed in this article are solely those of the authors and do not necessarily represent those of their affiliated organizations, or those of the publisher, the editors and the reviewers. Any product that may be evaluated in this article or claim that may be made by its manufacturer is not guaranteed or endorsed by the publisher.
Research integrity at Frontiers
Learn more about the work of our research integrity team to safeguard the quality of each article we publish.