- 1School of Law, Shandong Normal University, Jinan, China
- 2School of Law, Zhongnan University of Economics and Law, Wuhan, China
- 3Department of Economics, Cornell University, Ithaca, NY, United States
Fossil fuels remain indispensable energy resources despite their non-renewable nature. Understanding the patterns of global fossil fuel consumption is essential for energy security and policy-making. This study employs complex network theory and fractal time series analysis to explore the underlying dynamics and patterns of fossil fuel consumption globally, with a focus on coal, oil, and gas consumption.The study applies the Hurst index to raw fossil fuel consumption data to identify fractal characteristics. Additionally, the visibility graph method is used to convert time series data into complex networks, allowing further analysis of consumption patterns. The study examines fossil fuel consumption in 38 countries to assess global trends and differences. The analysis reveals that global fossil fuel consumption follows a fractal time series pattern, with Hurst index values exceeding 0.9, indicating long-term memory characteristics. The application of the visibility graph method demonstrates variations in the Hurst index of degree distribution, enabling the differentiation of consumption patterns across regions. The method also uncovers distinct features of coal, oil, and gas consumption when viewed from a network perspective. The findings suggest that fossil fuel consumption has predictable long-term patterns, which are crucial for assessing future energy demands. The study highlights the importance of legislative measures to safeguard fossil fuel resources, especially for countries like China, where energy security and international competitiveness are paramount. Understanding these consumption patterns could guide future energy policies aimed at managing non-renewable resources more effectively.
1 Introduction
Fossil fuel is a type of hydrocarbon or its derivatives, and it is a critical energy resource supporting the development of the global economy [1]. Especially, in modern society, fossil energy is still the most important part of energy consumption, which accounts for more than 80% of global disposable energy consumption. Many studies have focused on fossil fuels in recent decades. In the past half-century, the consumption of fossil fuels has increased substantially, about eight times since 1950. However, the type of fuel we rely on has also changed over time, from simple coal to a combination of oil and natural gas. Today, coal consumption is declining over the world, but oil and gas are still multiplying. Friedemann a J [2]. found that about 500 million tons of oil and its derivatives were used in the past year, indicating that fossil fuels have already become indispensable in human life.
A plethora of studies have been conducted on fossil fuels in recent decades. For example, the relationship between fossil fuel consumption and economic development has attracted much attention. Especially, COVID-19 has a significant impact on energy transportation [3], i.e., there is a strong relationship between freight and shipping routes and coronavirus cases, which affects the cost of oil transportation. By exploiting the data of fossil fuel consumption, equity price output, and exchange rates, S. L Vanessa [4] revealed the spatial relationship between COVID-19 and the national economy through the global vector autoregressive (GVAR) model. Some other studies [5–8] have also found that fossil fuel consumption directly affects economic development.
Fossil fuel consumption affects not only economic development but also environmental changes. For instance, F Martins [9] found that there is high dependence on fossil fuels in 29 European countries. SA Asongu [10] investigated fossil fuel energy consumption and other indicators of emissions from natural resources in Africa from 1980 to 2014. By applying LMDI and MRCI decomposition methods, it was found that global population growth is the most critical factor driving increased consumption of fossil products, and this varies from country to country [11]. Based on econometric models, Li [12] analyzed the relationship between carbon dioxide and China’s emissions, real GDP, clean energy, fossil fuel consumption, and trade opening from 1992 to 2020.
Given that fossil fuels have a significant impact on economic development and environmental protection, it is of great significance to regulate and protect the rational extraction and utilization of fossil fuels from a legal perspective. C. Judith [13] believe that the natural gas power generation industry urgently needs legislation to promote and protect it. G. Fang [14] discussed the legal regulations on the safety of offshore oil and gas exploration and development operations in the European Union, and based on this, proposed legislative implications of the relevant legal regulation of the EU for the safety rules of offshore oil and gas operations in China. PA Valeryevna [15] advocated that in order to promote the construction of ecological civilization, it is necessary to provide legal guarantees for the rational use of resources. In addition, in combating fossil fuel crimes, practice has proven that the role of relevant special actions is phased. It is important to establish the legal relationship of fossil fuel mining rights and the mining order through law, and establish a sound long-term mechanism for security prevention.
Fractal time series is a type of time series of Brownian motion. Fractal Brownian motion is statistically self-similar and has long-term memory, i.e., a memory effect makes the changing trend in the future the same as that at present. The Hurst index can characterize this long-term correlation. N. Dimitrios [16] analyzed the time series of PM10 in Athens, and it was found that PM10 in Athens had chaotic and long-term memory. C. Oscar [17] introduced a hybrid intelligent method that combines fractal theory and fuzzy logic to predict the COVID-19 time series.
As the field of network science develops, its areas of application are becoming increasingly broad [18–23]. The visibility graph model has been used in many fields, including economy, finance, environment, climate, medicine, psychology, etc. Thomas [24] applied the visibility graph to analyze the time series of PM10. Based on the deep learning and the visibility graph, X. Zhang [25] analyzed the time series of sleep and obtained different classes of sleep states. Additionally, many studies exploited visibility models to analyze brain wave data [26–29]. Other studies also applied the visibility graph to the environment and economic field [30–33]. J. Hu [34] and X. fan [35] employed this model to analyze the U.S. electricity market and China’s carbon trading market, respectively.
By leveraging the visibility graph, we provide a novel analytical framework that enhances the ability to detect, interpret, and predict complex dynamics in fossil fuel consumption. This has significant implications for network analysis, ultimately contributing to the advancement of knowledge and technology in this area. This paper mainly analyzes the internal characteristics of fossil fuel consumption, excavates much information on fossil fuel consumption, and provides a research basis for investigating the relationship between fossil fuel consumption and the economic environment in the future. Compared with previous research on fossil fuel consumption, this study has three obvious advantages: 1) Mapping time series to the complex network to find more hidden information of the series data, which helps to better understand the characteristics of this sequence; 2) the characteristics of the time series is represented by the fractal characteristics. However, when the time series are positively correlated, by mapping the time series data into a network and analyzing it through the Hurst index of the degree distribution of the network, it can be determined whether the impact of the time nodes on the future is random; 3) Complex network theory has high calculation efficiency and is suitable for big data applications. When applied to time series, complex networks can provide direct results compared with multi-fractal formalism.
The rest of this paper is organized as follows: Section 2 introduces the model that maps time series to a complex network, the complex network theory, and the data description of fossil fuel consumption based on the fractal time series theory. Then, in Section 3, the topography measles and the Hurst index of fossil fuel consumption are analyzed. Finally, the results and conclusion are presented in Section 4.
2 Model and data
2.1 Visibility graph
In this paper, the visibility graph method of time series proposed by Lacasa et al. [36] was utilized to construct the complex network for characterization. First, the discrete time series data
That is, these two points
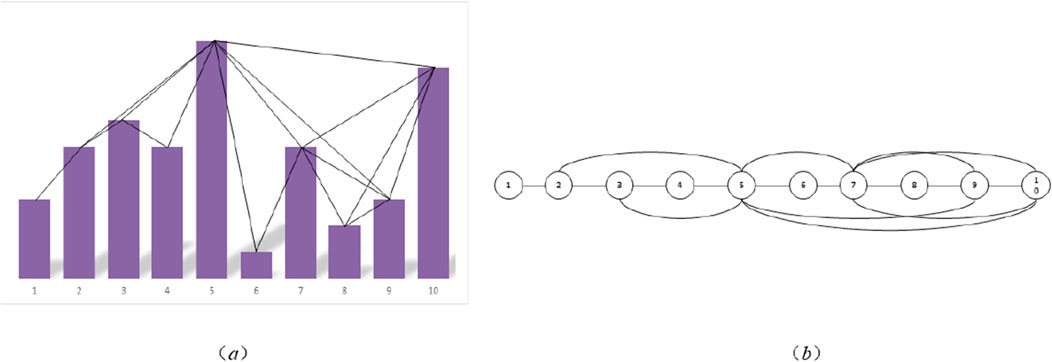
Figure 1 shows how to link the data. If one data bar (e.g., the fifth bar) is the highest, there are 3 bars between the fifth and the first bar, and these 2 bars are sheltering from the third bar. In this case, there is no edge linking nodes 1 and 5; Meanwhile, there are 4 bars between the fifth and 10th bars, but there is no bar to occlusion these 2 bars, so there is an edge to link them.
2.2 The topological characteristics of visbility graph
2.2.1 Degree
In a graph structure, the number of edges connected to a node is the degree of the node, and the degree distribution of each node in the graph is the degree distribution [37].
2.2.2 Average path length
The average path length [38] of a visibility graph is to form one time node to time node will take an average of
where
2.2.3 Cluster coefficient
The cluster coefficient is given by Newman [39]. Intuitively, if we have two friends, they may be friends with each other. Similarly, for the visibility graph, if time nodes
if
For a visibility graph, the average cluster coefficient is the average of all time-node cluster coefficients. As shown in the Equation 4
where
2.3 Fractal time series
For a time series
The Hurst index can reflect the auto-correlation of time series, especially the hidden long-term trend, which is called the long-term memory in statistics. Many computational approaches can be adopted for the Hurst index, and this paper used
(1) Let
where,
(2)
(3) Based on the standard deviation
(4) Through the exponential relationship between Equation 7 and the first
the following results can be obtained. As shown in the Equation 9:
where,
When
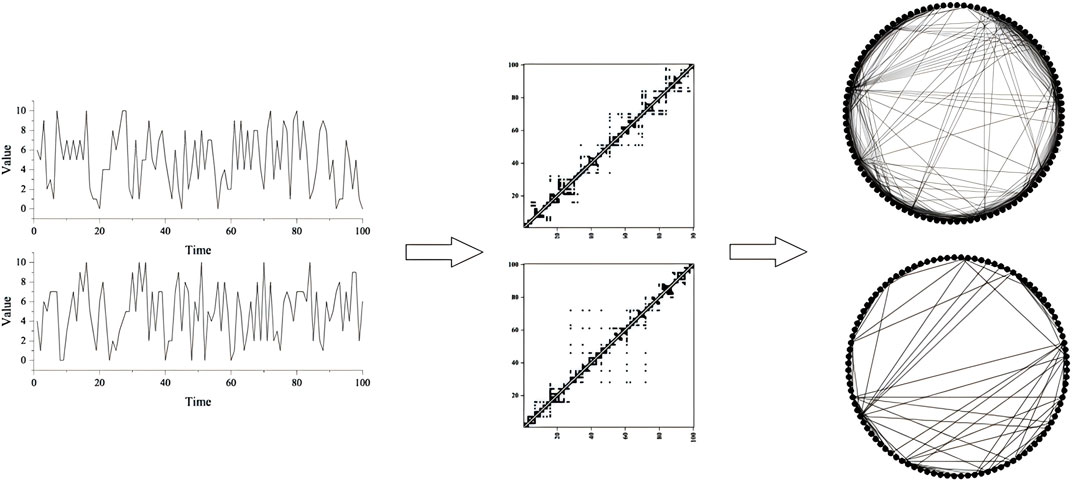
As illustrated in Figure 2, the time series data is mapped to an adjacency matrix by the visibility graph, with the calculated degree, cluster coefficients, diameter, and average path length of the complex network.
2.3.1 Data
Since energy consumption keeps changes, it needs to be quantified. The quotient between the use of fossil fuels (oil, coal, and gas) and the inland energy consumption is referred to as fossil energy consumption [9] (FFC), as shown in Equation 10
where
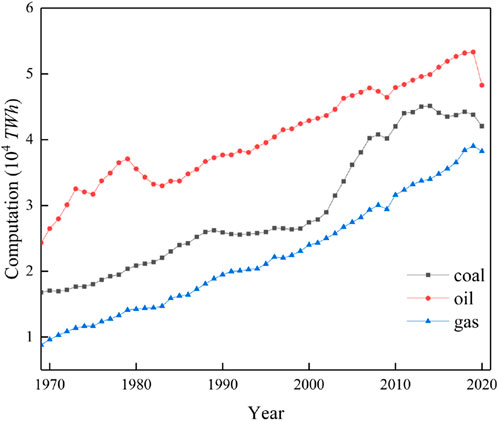
The coal, oil, and gas consumption were obtained from the Our World in Data [40]. Due to the insufficient data in some countries, this study did not involve the countries with missing data and obtained the fossil fuel consumption data of 38 countries finally. From Figure 3, it can be seen that fossil fuel (coal, oil, and gas) consumption in the world has increased gradually in the given period. However, in 2020, all fossil fuel consumption decreased significantly. Meanwhile, as global awareness of environmental protection increases, more and more countries have begun using clean energy and replacing oil with natural gases. Besides, coal consumption is always between oil consumption and natural gas consumption.
3 Analysis
3.1 Fossil fuel consumption in different countries
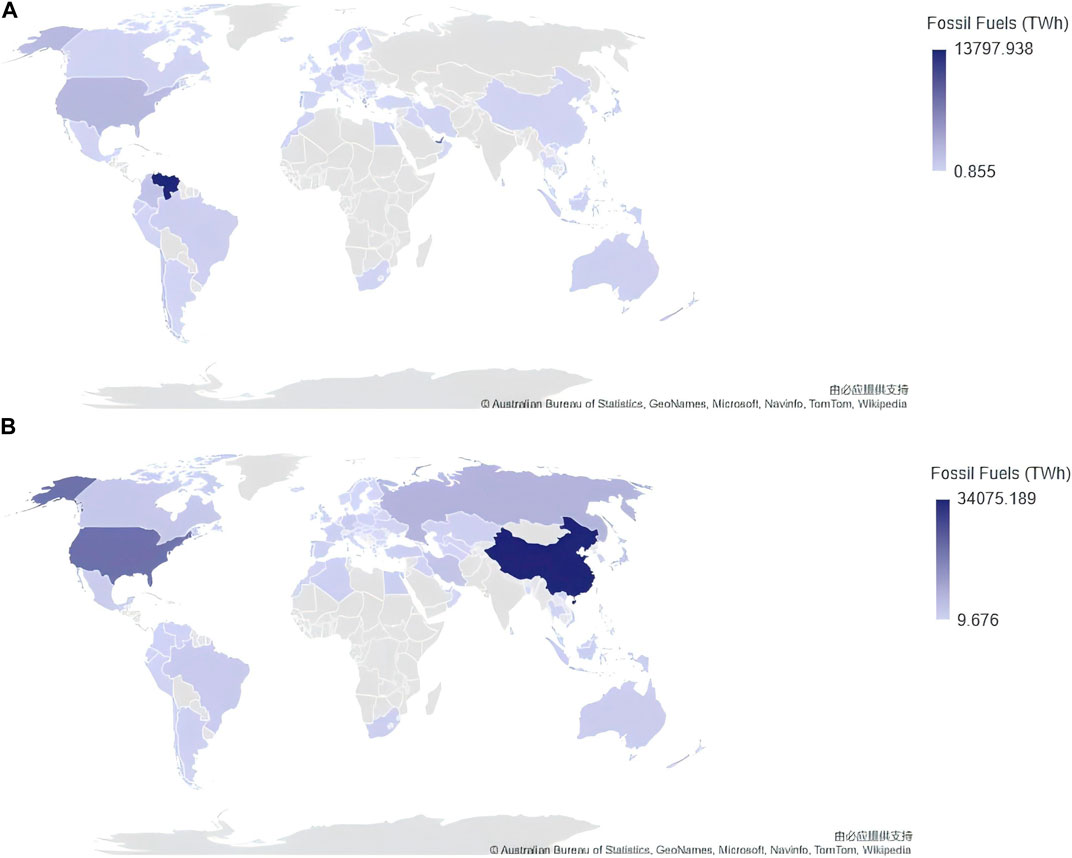
By comparing the total fuel consumption of various countries in 1968 and 2020 in Figure 4, it can be found that Venezuela’s total fuel consumption decreased from the first in the world to almost no fossil fuel consumption, while China’s total fossil fuel consumption ranked from the last in 1968 to the top in 2020. These two maps show that the consumption of fossil fuels is closely related to economic development.
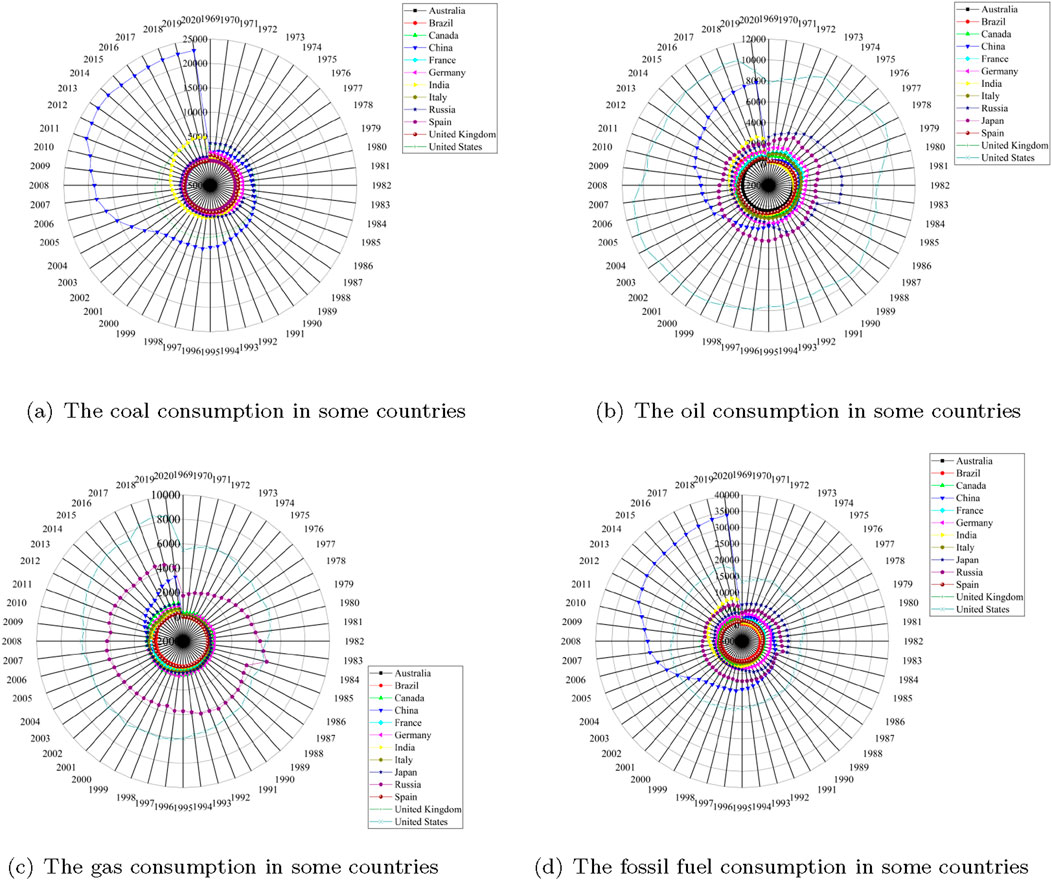
Figure 5 presents the time series of coal, oil, and gas consumption from 1986 to 2020 of 13 countries. The coal, oil, and gas consumption has increased in these 13 countries. Due to the differences in economy, policies, and resource reserves among these countries, there are significant variations in fuel consumption. Specifically, the growth of coal consumption in China is the most in the world. Since 2000, China’s oil and coal consumption has increased substantially, becoming our country a major coal consumer. Meanwhile, the United States is the largest consumer of oil and gas. However, Figure 5D indicates that China has a high growth rate in energy consumption, and in 2004, China’s total energy consumption exceeded the total energy consumption of the United States, which is highly related to the rapid development of China’s economy.
3.2 Visibility graph of fossil fuel consumption
Network science provides a new tool for analyzing fossil fuel consumption data. The visibility network structure can be exploited to reveal the practical significance of fossil fuel consumption, and more hidden information about fossil fuel consumption can be obtained from the degree, degree distribution, cluster coefficient, average short length, and diameter of the network structure.
Through the definition of the visibility graph, it can be known that the degree is the number of other time nodes connected to one time node, and the average degree is the degree of all nodes on average. The more significant the average degree, the stronger the correlation between these data.
The average path length is the number of time nodes to pass between two time nodes to establish a connection. The average path length is the average number of time nodes to pass between two nodes to establish a connection. The diameter is the longest path among all the shortest paths, indicating the number of time nodes to pass to establish an edge connection with the weakest correlation between these two time nodes. A large average path length indicates a strong correlation between these data.
The clustering coefficient describes the relationship between two nodes with familiar neighbors, which reflects the relationship between two time nodes connected to the same time node. A larger clustering coefficient indicates a stronger attraction of one node to other nodes.
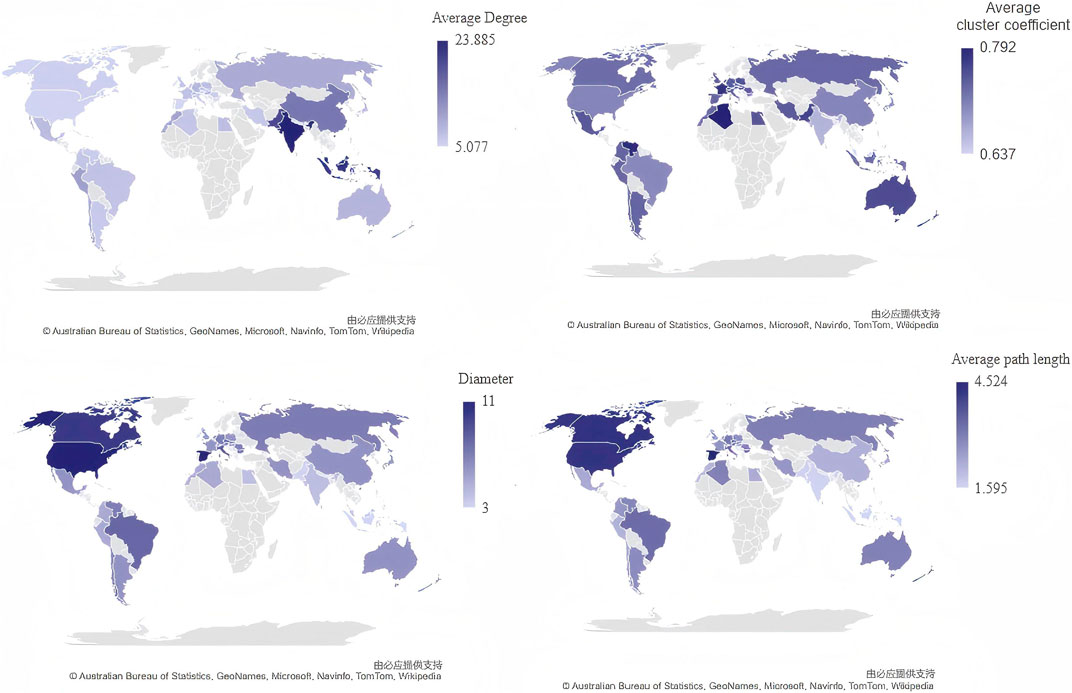
Figure 6 shows the visibility graph of coal consumption. These four maps present the average degree, average cluster coefficient, diameter, and average path length of coal consumption in the 38 countries, respectively. It can be found that India, Indonesia, Malaysia, and Pakistan are the top four countries in terms of average degree (all exceed 20). Meanwhile, the average path length in these four countries is less than 2, indicating that the correlation between the coal consumption data of these four countries is the strongest. Besides, these five countries, including Algeria, Venezuela, France, Pakistan, and Australia, are the top five countries in terms of cluster coefficient, which indicates that these five countries are closely related to their neighboring nodes in coal consumption.
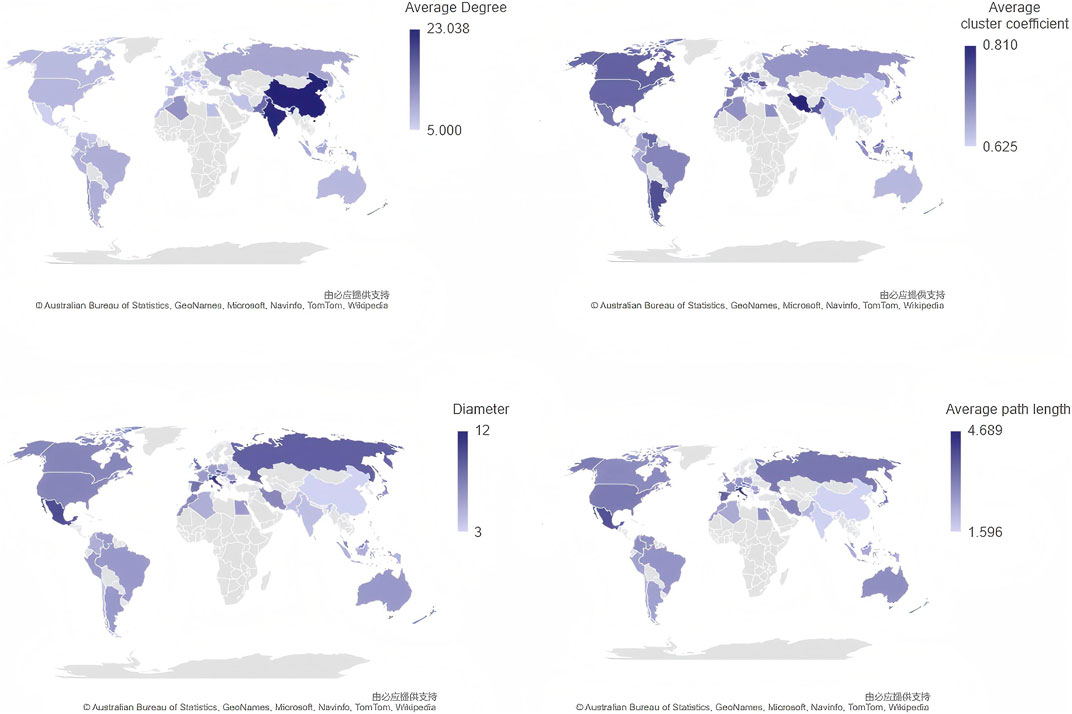
Figure 7 presents the visibility graph of oil consumption. Similar to Figure 6, this figure depicts the average degree, average cluster coefficient, diameter, and average path length of oil consumption in the 38 countries, respectively. It can be seen from these maps that the average degree of China and India is over 20. Italy, Czechia, Slovakia, and Mexico are the top four countries in terms of diameter (all exceed 10). Besides, Iran, Taiwan (China), Argentina, Romania, and Pakistan are the top four countries in terms of average cluster coefficient (all exceeds 0.75), and the average cluster coefficient of Iran is over 0.8, indicating that Iran is more strongly correlated with its neighbors in oil consumption. Moreover, Italy, Mexico, Spain, and Czechia are the top four countries in terms of the average path length of oil consumption (all exceed 3.5).
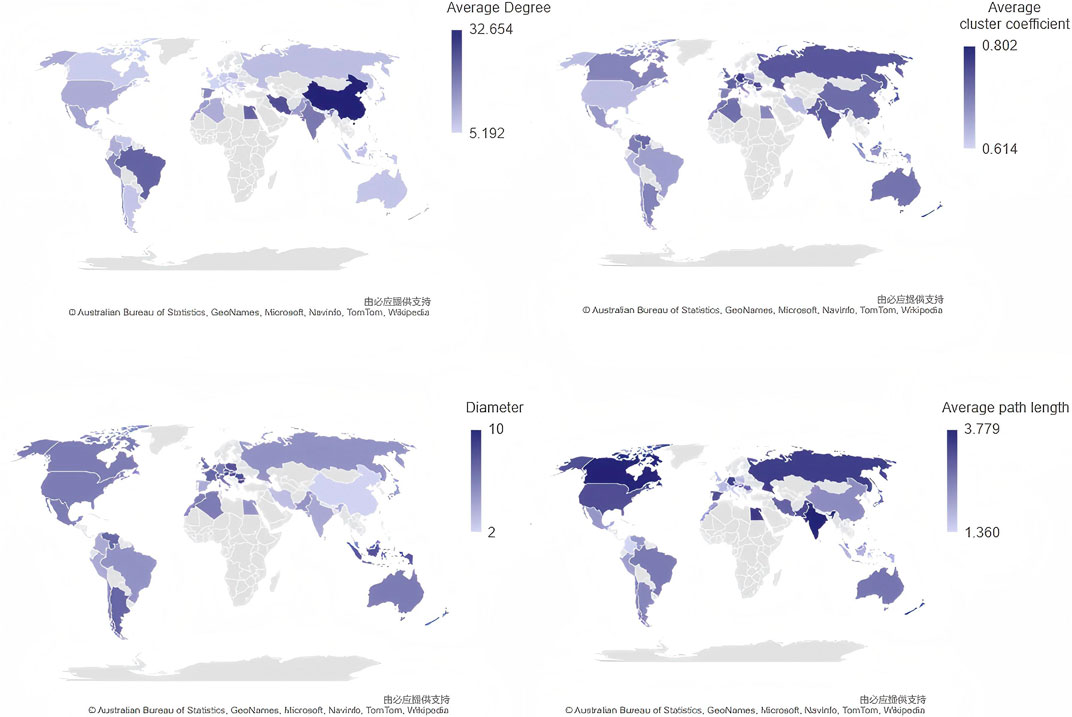
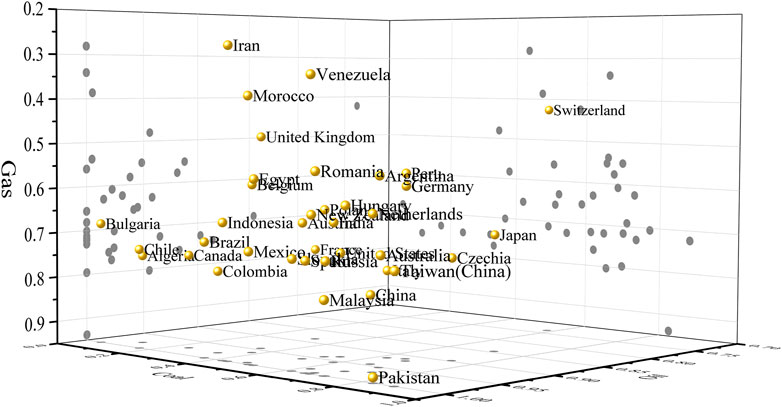
Figure 8 depicts the visibility graph of natural gas consumption in terms of average degree, average cluster coefficients, diameter, and average path length. It can be seen that China, Iran, Egypt, and Brazil are the top four countries in terms of average degree (all exceed 20). Meanwhile, these four countries have the smallest average path length, indicating that the correlation between the coal consumption data of these four countries is the strongest. Besides, the diameter of Austria, Hungary, Bulgaria, Netherlands, and Switzerland is over 9. Moreover, the average cluster coefficient of Slovakia, Germany, Hungary, Japan, Czechia, Romania, and Belgium is over 0.75.
3.3 Fractal analyze
Fractal is an essential feature of time series. In this section, the fractal characteristics of three fossil fuels are analyzed. Through Table 1, it can be found that the Hurst indices of coal, oil, and natural gas consumption data are all greater than 0.5. Meanwhile, the Hurst indices of most fossil fuel consumption exceed 0.9, indicating that the consumption of these three types of fossil fuels has long-term memory. When the Hurst index equals to 0.5, the sequence is the randomized time series. The closer the Hurst index is to 0.5, the stronger the stochasticity of the effect of the series on the future. In this paper, when the Hurst index is between 0.4 and 0.6, the series can be considered stochastic.
In Table 1, the Hurst index is marked in bold when it is between 0.4 and 0.5. The Hurst index of degree (HID) of 10 countries including Austria, Egypt, India, Indonesia, Iran, Mexico, Morocco, Poland, Switzerland, and the United States in coal consumption is in bold, indicating that in coal consumption, the current time nodes have a stochastic impact on future time nodes. The HID of the oil consumption of Argentina, Belgium, Egypt, Germany, Peru, Romania, Switzerland, and the United Kingdom are the same as that of the 10 countries in coal consumption; the same as the previously mentioned, the countries in natural gas consumption are Algeria, Argentina, Brazil, France, Germany, Hungary, Iran, Morocco, Netherlands, New Zealand, Romania, Russia, Slovakia, Switzerland, Taiwan (China), and Venezuela, respectively.
Since the coal, oil, and gas consumption in these 38 countries are long-term memory time series, only analyzing the Hurst index of the primary data cannot discover new features in the original data. However, as shown in Figure 9, with the assistance of the Hurst of degree, new characteristics of fossil fuel consumption can be obtained. There are fuel consumption differences between different countries and in the same country.
4 Conclusion
This paper utilizes the Hurst index to analyze fossil fuel consumption time series data for 38 countries. The analysis reveals that all fossil fuel consumption data in these countries exhibit long-term memory characteristics, indicating a significant relationship between fossil fuel consumption and economic development.
The visibility graph method is employed to uncover hidden features (such as average degree, average clustering coefficient, and diameter) of the fossil fuel consumption data. These features help identify differences in fuel consumption between countries. Furthermore, fractal and complex network theory are applied to analyze fossil fuel consumption, revealing significant differences among the 38 countries. By using the Hurst index of the degree distribution, this study distinguishes global fossil fuel consumption patterns and determines whether current fuel consumption affects future consumption randomly. Additionally, the stable supply and economic security of national fossil fuel resources depend on the formulation and improvement of relevant resource protection laws. Without legal protection, the security of energy resources cannot be ensured, economic development needs cannot be met, and people’s needs for survival and development cannot be satisfied.
Data availability statement
The original contributions presented in the study are included in the article/Supplementary Material, further inquiries can be directed to the corresponding author.
Author contributions
LZ: Conceptualization, Data curation, Methodology, Writing–original draft. XJ: Investigation, Methodology, Writing–review and editing. YM: Methodology, Software, Validation, Visualization, Writing–review and editing.
Funding
The author(s) declare that no financial support was received for the research, authorship, and/or publication of this article.
Acknowledgments
This work is supported by the 2024 Shandong Provincial Key Art and Science Youth Project “Research on Intellectual Property Protection of Traditional Crafts in the Yellow River National Cultural Park (Shandong Section)” (No. L2024Q05100112). Thanks to Chat GPT 3.5 for helping us polish the language.
Conflict of interest
The authors declare that the research was conducted in the absence of any commercial or financial relationships that could be construed as a potential conflict of interest.
Publisher’s note
All claims expressed in this article are solely those of the authors and do not necessarily represent those of their affiliated organizations, or those of the publisher, the editors and the reviewers. Any product that may be evaluated in this article, or claim that may be made by its manufacturer, is not guaranteed or endorsed by the publisher.
References
1. Diffenbaugh NS, Burke M. Global warming has increased global economic inequality. Proc Natl Acad Sci (2019) 116(20):9808–13. doi:10.1073/pnas.1816020116
2. Friedemann AJ. Half a million products are made out of fossil fuels. In: Life after fossil fuels. Springer (2021). p. 81–4.
3. Michail NA, Melas KD. Shipping markets in turmoil: an analysis of the covid-19 outbreak and its implications. Transportation Res Interdiscip Perspect (2020) 7:100178. doi:10.1016/j.trip.2020.100178
4. Smith LV, Tarui N, Yamagata T. Assessing the impact of covid-19 on global fossil fuel consumption and co2 emissions. Energ Econ (2021) 97:105170. doi:10.1016/j.eneco.2021.105170
5. Gokmenoglu KK, Sadeghieh M. Financial development, co2 emissions, fossil fuel consumption and economic growth: the case of Turkey. Strateg Plann Energ Environ (2019) 38(4):7–28. doi:10.1080/10485236.2019.12054409
6. Mensah IA, Sun M, Gao C, Omari-Sasu AY, Zhu D, Ampimah BC, et al. Analysis on the nexus of economic growth, fossil fuel energy consumption, co2 emissions and oil price in africa based on a pmg panel ardl approach. J Clean Prod (2019) 228:161–74. doi:10.1016/j.jclepro.2019.04.281
7. Kahia M, Ben Jebli M, Belloumi M. Analysis of the impact of renewable energy consumption and economic growth on carbon dioxide emissions in 12 mena countries. Clean Tech Environ Pol (2019) 21(4):871–85. doi:10.1007/s10098-019-01676-2
8. Gyimah J, Yao X, Tachega MA, Hayford IS, Opoku-Mensah E. Renewable energy consumption and economic growth: new evidence from Ghana. Energy (2022) 248:123559. doi:10.1016/j.energy.2022.123559
9. Martins F, Felgueiras C, Smitková M. Fossil fuel energy consumption in european countries. Energ Proced (2018) 153:107–11. doi:10.1016/j.egypro.2018.10.050
10. Asongu SA, Agboola MO, Alola AA, Bekun FV. The criticality of growth, urbanization, electricity and fossil fuel consumption to environment sustainability in africa. Sci Total Environ (2020) 712:136376. doi:10.1016/j.scitotenv.2019.136376
11. Chen J, Wu Y, Xu C, Song M, Liu X. Global non-fossil fuel consumption: driving factors, disparities, and trends. Management Decis (2018) 57:791–810. doi:10.1108/md-04-2018-0409
12. Li B, Haneklaus N. The role of clean energy, fossil fuel consumption and trade openness for carbon neutrality in China. Energ Rep (2022) 8:1090–8. doi:10.1016/j.egyr.2022.02.092
13. Cherni JA, Kentish J. Renewable energy policy and electricity market reforms in China. Energy Policy (2007) 35(7):3616–29. doi:10.1016/j.enpol.2006.12.024
14. Fang G, Tian L, Liu M, Fu M, Sun M. How to optimize the development of carbon trading in China—enlightenment from evolution rules of the eu carbon price. Appl Energ (2018) 211:1039–49. doi:10.1016/j.apenergy.2017.12.001
16. Nikolopoulos D, Moustris K, Petraki E, Koulougliotis D, Cantzos D. Fractal and long-memory traces in pm10 time series in athens, Greece. Environments (2019) 6(3):29. doi:10.3390/environments6030029
17. Castillo O, Melin P. Forecasting of covid-19 time series for countries in the world based on a hybrid approach combining the fractal dimension and fuzzy logic. Chaos, Solitons and Fractals (2020) 140:110242. doi:10.1016/j.chaos.2020.110242
18. Cheng L, Zhu P, Tang K, Gao C, Wang Z. Gin-sd: source detection in graphs with incomplete nodes via positional encoding and attentive fusion. Proc AAAI Conf Artif Intelligence (2024) 38:55–63. doi:10.1609/aaai.v38i1.27755
19. Zhong C, Xiong F, Pan S, Wang L, Xiong X. Hierarchical attention neural network for information cascade prediction. Inf Sci (2023) 622:1109–27. doi:10.1016/j.ins.2022.11.163
20. Zhu P, Pan Z, Tang K, Cui X, Wang J, Xuan Q. Node injection attack based on label propagation against graph neural network. IEEE Trans Comput Soc Syst (2024) 1–13. doi:10.1109/tcss.2024.3395794
21. Ni X, Xiong F, Pan S, Wu J, Wang L, Chen H. Community preserving social recommendation with cyclic transfer learning. ACM Trans Inf Syst (2023) 42(3):1–36. doi:10.1145/3631115
22. Zhu H, Xiong F, Chen H, Xiong X, Wang L. Incorporating a triple graph neural network with multiple implicit feedback for social recommendation. ACM Trans Web (2024) 18(2):1–26. doi:10.1145/3580517
23. Zhu P, Cheng L, Gao C, Wang Z, Li X. Locating multi-sources in social networks with a low infection rate. IEEE Trans Netw Sci Eng (2022) 9(3):1853–65. doi:10.1109/tnse.2022.3153968
24. Plocoste T, Carmona-Cabezas R, Jiménez-Hornero FJ, de Ravé EG, Calif R. Multifractal characterisation of particulate matter (pm10) time series in the caribbean basin using visibility graphs. Atmos Pollut Res (2021) 12(1):100–10. doi:10.1016/j.apr.2020.08.027
25. Zhang X, Landsness EC, Chen W, Miao H, Tang M, Brier LM, et al. Automated sleep state classification of wide-field calcium imaging data via multiplex visibility graphs and deep learning. J Neurosci Methods (2022) 366:109421. doi:10.1016/j.jneumeth.2021.109421
26. Zhu G, Li Y, Wen P. Analysis and classification of sleep stages based on difference visibility graphs from a single-channel eeg signal. IEEE J Biomed Health Inform (2014) 18(6):1813–21. doi:10.1109/jbhi.2014.2303991
27. Wang L, Long X, Arends JB, Aarts RM. Eeg analysis of seizure patterns using visibility graphs for detection of generalized seizures. J Neurosci Methods (2017) 290:85–94. doi:10.1016/j.jneumeth.2017.07.013
28. Gao Z-K, Guo W, Cai Q, Ma C, Zhang Y-B, Kurths J. Characterization of ssmvep-based eeg signals using multiplex limited penetrable horizontal visibility graph. Chaos: Interdiscip J Nonlinear Sci (2019) 29(7):073119. doi:10.1063/1.5108606
29. Supriya S, Siuly S, Wang H, Zhang Y. Eeg sleep stages analysis and classification based on weighed complex network features. IEEE Trans Emerging Top Comput Intelligence (2018) 5(2):236–46. doi:10.1109/tetci.2018.2876529
30. Hu J, Chen J, Zhu P, Hao S, Wang M, Li H, et al. Difference and cluster analysis on the carbon dioxide emissions in China during covid-19 lockdown via a complex network model. Front Psychol (2022) 12:795142. doi:10.3389/fpsyg.2021.795142
31. Cui X, Hu J, Ma Y, Wu P, Zhu P, Li H-J. Investigation of stock price network based on time series analysis and complex network. Int J Mod Phys B (2021) 35(13):2150171. doi:10.1142/s021797922150171x
32. He Z, Zhang S, Hu J, Dai F. An adaptive time series segmentation algorithm based on visibility graph and particle swarm optimization. Physica A: Stat Mech its Appl (2024) 636:129563. doi:10.1016/j.physa.2024.129563
33. Hu J, Chu C, Criado R, Chen J, Hao S, Wang M. Visibility graph and graph convolution networks-based segmentation of carbon emission in China. Ann Operations Res (2023) 1–22. doi:10.1007/s10479-023-05623-9
34. Hu J, Xia C, Li H, Zhu P, Xiong W. Properties and structural analyses of USA’s regional electricity market: a visibility graph network approach. Appl Mathematics Comput (2020) 385:125434. doi:10.1016/j.amc.2020.125434
35. Fan X, Li X, Yin J, Tian L, Liang J. Similarity and heterogeneity of price dynamics across China’s regional carbon markets: a visibility graph network approach. Appl Energ (2019) 235:739–46. doi:10.1016/j.apenergy.2018.11.007
36. Lacasa L, Luque B, Ballesteros F, Luque J, Nuno JC. From time series to complex networks: the visibility graph. Proc Natl Acad Sci (2008) 105(13):4972–5. doi:10.1073/pnas.0709247105
37. Watts DJ, Strogatz SH. Collective dynamics of ‘small-world’networks. nature (1998) 393(6684):440–2. doi:10.1038/30918
38. Fronczak A, Fronczak P, Hołyst JA. Average path length in random networks. Phys Rev E (2004) 70(5):056110. doi:10.1103/physreve.70.056110
Keywords: fossil fuel, complex network, fractal time series, hurst index, legal protection, visibility graph
Citation: Zhang L, Jian X and Ma Y (2024) Analysis of differences in fossil fuel consumption in the world based on the fractal time series and complex network. Front. Phys. 12:1457287. doi: 10.3389/fphy.2024.1457287
Received: 30 June 2024; Accepted: 03 September 2024;
Published: 02 October 2024.
Edited by:
Shirui Pan, Griffith University, AustraliaReviewed by:
Fujun Lai, Yunnan University of Finance and Economics, ChinaManman Yuan, Inner Mongolia University, China
Copyright © 2024 Zhang, Jian and Ma. This is an open-access article distributed under the terms of the Creative Commons Attribution License (CC BY). The use, distribution or reproduction in other forums is permitted, provided the original author(s) and the copyright owner(s) are credited and that the original publication in this journal is cited, in accordance with accepted academic practice. No use, distribution or reproduction is permitted which does not comply with these terms.
*Correspondence: Xiao Jian, amFueHRpYW40QDE2My5jb20=
 Lin Zhang1
 Xiao Jian