- 1Department of Mechanical Engineering, College of Engineering, Qassim University, Buraydah, Saudi Arabia
- 2Department of Mechanical Engineering, Narowal Campus, University of Engineering and Technology Lahore, Lahore, Pakistan
- 3Department of Urban Innovation, Yokohama National University, Yokohama, Kanagawa, Japan
- 4Department of Mechanical Engineering, HITEC University Taxila, Islamabad, Pakistan
The formation of surface vortices in axial pump sumps presents a significant challenge to pump performance, primarily due to the risk of impeller cavitation. As such, effective mitigation strategies are imperative. In this study, the strength of surface vortices was successfully reduced to a safe operational level by employing two distinct types of anti-vortex devices (AVDs): triangular side fins type (AVDSF) and ring type (AVDR). Computational fluid dynamics (CFD) techniques were employed to reveal a substantial decrease in surface vorticity from 38 s-1 in the absence of AVDs to approximately 8 s-1 with either AVDSFs or AVDRs, underscoring their remarkable efficacy. Further, the helicity, a measure of vortex twisting, was reduced from about 0.4 m2s-2 to below 0.1 m2s-2 with the introduction of either side fins or ring-type AVDs. Detailed analyses of velocity streamlines contours elucidated that the suppression of surface vortices could be attributed to the disruption of vortex swirl motion induced by the implementation of AVDs. These findings provide crucial insights into the mechanisms underlying surface vortex suppression, thus paving the way for enhanced pump performance and reliability in axial pump’s suction sump applications. The implementation of AVDs is expected to prevent cavitation, air ingress, and vortex-induced vibrations, resulting in more reliable and efficient pump operation in industrial settings.
1 Introduction
Axial flow pumps are integral components of the chemical and processing industries, serving the purpose of maintaining fluid levels between various systems within the industry [1]. These industries encompass a wide range of applications, including power plants, flood management, and marine operations, such as open-cycle cooling of condensers, raw water treatment, residual heat removal from nuclear power plant cores, industrial fire systems, supply of chemical water, submersible tanks, and emergency water supply [2]. The primary performance indicators in a pumping system include the required flow rate, head (pressure), and maximum achievable efficiency. However, these performance indicators, as well as the overall design life of the pump, are constantly under threat from issues such as cavitation, vibration, and noise [3, 4]. The flow at the pump sump side greatly influences the pump’s performance parameters and overall operating conditions. The flow patterns within the sump are determined by its dimensions and conditions [5]. Vortex formation stands out as the primary factor with the most profound impact on the performance of hydraulic machines because of the potential of cavitation in impeller [6–9]. Vortices in pump sumps manifest in two main types: surface vortices from the water surface and subsurface vortices from the sump bottom and side walls [10]. Some of these vortices may have their positions fixed while some change with time [11]. In certain cases, the formation of air-entraining free-surface vortices or submerged (sub-surface) vortices leads to mechanical damage by inducing severe vibrations. This can result in adverse effects such as suction loss, unreliable operation, reduced efficiency, and impeller pitting. Prolonged vibrations further accelerate wear, promote structural fatigue, and lead to costly repairs of pump components [3, 12, 13]. The air is entrained due to the substantial pressure drop in the water body surrounding the vortex [14]. As these vortices increase in size and intensity, the performance of the pump is significantly reduced. The removal or mitigation of vortices within the sump is, therefore, imperative to enhance overall pump performance and prevent adverse effects on the system.
Several experimental investigations were carried out to explore the mechanics of formation of objectionable surface and sub-surface vortices. The dynamics of vortex generation was experimentally investigated by the particle image velocimetry (PIV) technique [15, 16]. Okamura et al. [16, 17] explored the formation of vortices on the surface and subsurface including both stationary and non-stationary types. Liu et al [18] utilized 3D-PIV to capture and analyze the characteristics of the floor-attached vortex (FAV) beneath the bell mouth of a vertical axial flow pump. Their analysis revealed a distribution pattern of circular velocity components within the vortex core zone, with the values approaching zero at the core center and increasing with the radius of core. Rajendran et al. [15] employed 2D-PIV to measure vortices near the bell in a pump sump demonstrating that variations in bell submergence depth and distance from the side wall significantly influenced vortex formation. Chong et al. [19] mathematically investigated the generation of boundary vortices under the influence of various non-dimensional flow parameters and shear layer flow in complex flow fields. Hite and Mih [20] explored the vortex generation at horizontal intake examining the impact of the Froude number on vortical motion and velocity curl. Song et al. [11] introduced a novel method called three-dimensional velocity measurement system (V3V) to calculate the three-dimensional velocity in the flow field to study the mechanics of FAV in pump sumps.
Although experimental approaches are valuable, their economic challenge associated with them have led to the adoption of computational fluid dynamics (CFD) simulations as a cost-effective solution for studying vortex formation and mechanics. CFD simulations provide valuable insights into the flow patterns and behavior, enabling the exploration of potential solutions for vortex elimination [17]. Zhang et al. [21] conducted numerical simulations to examine the formation of roof-attached vortices in a closed pump sump. Uruba et al. [22] investigated the effect of the flow rate and water level on the free surface vortices by employing shear stress transport (SST) turbulence model. Ferreira et al [23] also employed CFD to investigate the flow characteristics of suction sump using the SST model. Choi et al. [24, 25] employed CFD techniques to predict the vortex’s position while Amin et al. [25, 26] utilized CFD to assess the swirl angle, thereby gauging water imbalance in the pump return through the bell-mouth. Kim et al. [27] employed the ANSYS CFX model to examine the impact of the gap between an underwater cargo pump inlet and pump sump on suction performance. Johansson et al. [28] conducted both physical tests and CFD simulations to demonstrate the utility of hydraulic models in identifying adverse flow conditions, such as emergence of problematic surface or subsurface vortices and occurrence of intense swirl motion at impeller intake.
While it is possible to exert some control over vortices by adjusting the flow rate and submergence value, the complete elimination of vortex formation is constrained by various parameters. Factors such as the shape and geometry of the bell mouth (suction pipe), intake diameter, medium density and viscosity, and surface tension impose limitations on the ability to entirely prevent vortex formation [29, 30]. Consequently, the use of passive control methods involving physical components known as anti-vortex devices (AVDs) has emerged as a viable solution [31–34]. These devices effectively suppress vortices by disrupting the angular momentum of the flow [31]. The literature review suggests that the intensity of vortices can be reduced by the introduction of AVDs, thereby mitigating adverse effects such as cavitation, air ingress, and vibrations [31–34]. Kim et al. [35] explored the effectiveness of triangular-type AVD placed at the bottom of the sump, revealing a reduction in vorticity from 4.3 s-1 without the AVD to 2.5 s-1 with it. Similarly, the turbulence kinetic energy decreased from 0.35 m2s-2 to 0.30 m2s-2 at the suction pipe inlet when the AVD was utilized. Furthermore, Kim et al [29] employed a floor-splitter AVD and conducted numerical simulations to assess the flow dynamics in the sump at varying AVD heights, aiming to enhance pump station design and efficiency. Roshan et al. [36, 37] investigated the emergence and suppression of vortices at the suction intake of power-producing hydraulic machinery employing the large-scale hydraulic model, demonstrating the efficacy of anti-vortex walls in converting strong vortices into weaker ones. Amiri [38] experimentally investigated the efficacy of perforated and solid plates as AVDs placed on top of an intake to prevent surface vortex formation, finding that a perforated plate with specific dimensions and 50% uniform opening, and a solid plate of certain size, effectively eliminated surface vortices at the intake. Moreover, numerous studies, including those by Sarkardeh et al [39], Monshizadeh et al [40], Norizan et al [41], Inhwan et al [42], EchAmiriavezn et al [43], Ahmad et al [44], Behrouz et al [45], and Constantinescu et al [46] have experimentally and numerically investigated the vortex formation and suppression in reservoirs and pump sumps, contributing to advancements in pump station and suction sump efficiency through the evaluation of various AVDs.
However, most studies have focused on submerged vortices, with limited attention to surface vortices. This research, thus, aims to fill this gap by investigating the surface vortex formation and suppression, as well as developing effective vortex control strategies for axial flow pump systems using CFD analysis with the CFX tool of ANSYS 19.2.
2 Computational method
2.1 Analysis Framework
The computational analysis of flow behavior around the suction pipe and beneath its bell mouth within the suction sump was conducted using ANSYS CFX release 19.2. Following are the governing equations of the analysis. Equation 1 represents the continuity equation, while Equation 2 represents the momentum equation:
where
where
The SST turbulence model was utilized for both steady-state and transient analyses. The SST model integrates the strengths of both the k-ω and k-ε models in such a way that it resolves the k-ω equations near the walls while employing the k-ε equations elsewhere. This dual approach enables the utilization of the advantages of near-wall performance without encountering potential inaccuracies associated with free stream sensitivity [29]. Unlike the k-ε model, where the eddy viscosity is assumed to be constant, the SST model offers the flexibility to adjust the definition of eddy viscosity [47]. The SST model includes additional components such as the Blending Function, Turbulent Kinetic Energy equation, and Specific Dissipation Rate to combine the traditional k-ω and k-ε models. With these enhancements, the SST model has demonstrated greater effectiveness in CFD analysis compared to using individual traditional turbulence models [48]. Recognizing its wide applicability and the synergistic advantages it offers, NASA has endorsed the SST model as the most preferred option owing to its accuracy in its technical memorandum [49]. The SST model is described by the following equations (Equation 3; Equation 4):
Here,
Domain discretization and meshing are critical steps in CFD analysis. A mesh sensitivity analysis was conducted using five different mesh sizes: 3, 5, 7, 8, and 9 million elements. The results, including vorticity measurements, indicated that the meshes with 8 and 9 million elements yielded nearly identical outcomes. Consequently, the mesh with 8 million elements was chosen as the optimal size, providing a balance between computational efficiency and result accuracy. Further, to ensure accurate results, a special attention was given to mesh resolution at critical geometrical features where fine details of output variables were required. The computational domain was partitioned to enable refined meshing near the areas surrounding the suction pipe, while coarse meshes were defined at areas of less concern. This approach aimed to reduce computational time and cost without compromising on accuracy. The concept of single part two bodies was adopted with an exact interface between the coarse and fine meshes. The mesh configuration and interface between coarse and fine meshes are shown in Figure 1.

Figure 1. Computatinal grid (front view of CFD configuration) with inset revealing the interface between coarse and fine meshes.
In current simulations, the convective terms were stabilized using the first-order upwind scheme, while the diffusion terms were stabilized using the central differencing scheme. A root means square error of 10−6 was established as the convergence criterion to ensure accurate results. The computational load of the three-dimensional model was managed by distributing the computation among 6 processors using the parallel processing scheme.
2.2 Boundary conditions
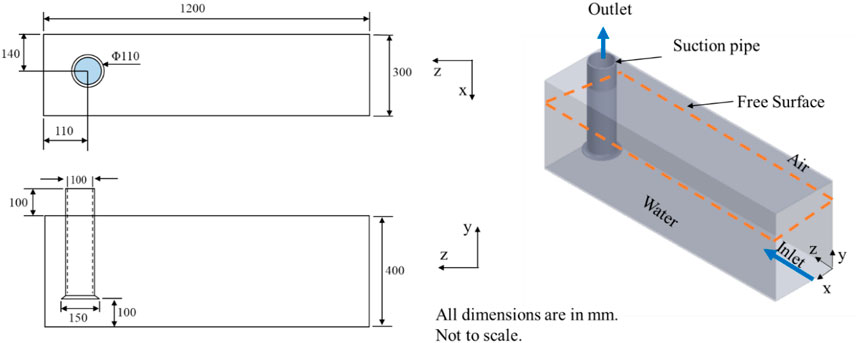
The analysis utilized boundary conditions specified in Table 1 while the dimensions of the suction pipe, suction sump, and bell mouth configuration within the sump have been illustrated in Figure 2. The computational domain, as depicted in the schematic in Figure 2, showcases the direction of fluid flow indicated by arrows, moving from the inlet boundary condition to the outlet boundary condition within the domain. In this arrangement, the channel width measures 300 mm, the suction pipe has a diameter of 100 mm, and its inlet is situated 100 mm above the channel floor and 110 mm away from the back wall (Figure 2). The study introduced non-homogeneous flow by offsetting suction pipe by 10 mm from the channel midline. Additionally, the water level was maintained at 300 mm, and the output was set to 1.0 cubic meter per minute.
2.3 Implementation of AVDs
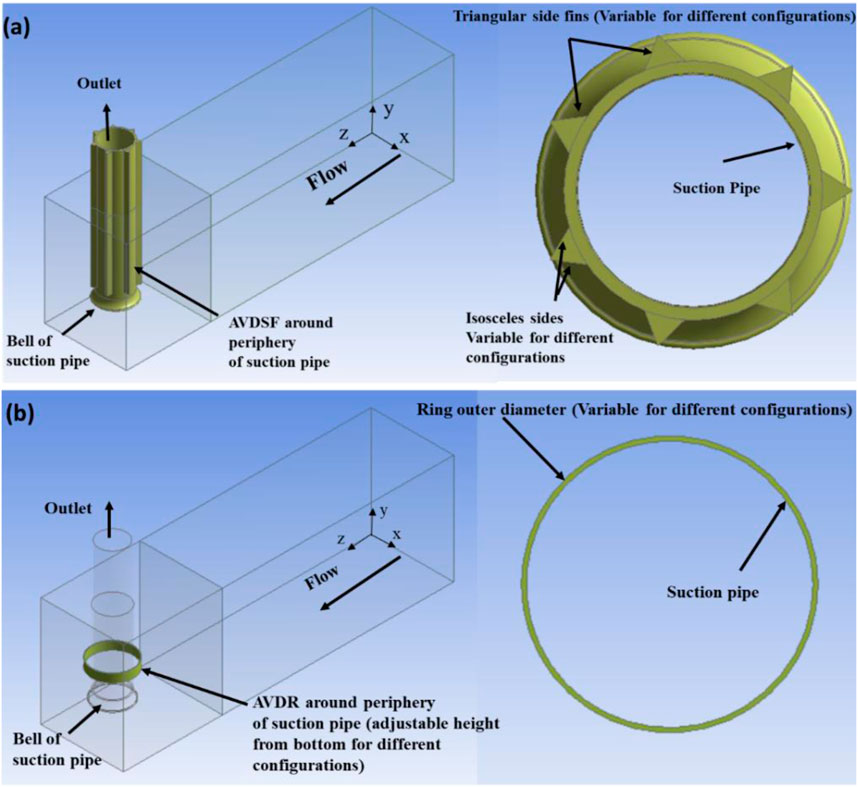
Following the validation of the CFD study with experimental data, the investigation of flow behavior in the pump sump continued by analyzing various flow parameters. Velocity streamlines, vorticity, and helicity were calculated to precisely locate and identify the surface vortices with their intensities around the suction pipe. To mitigate the adverse effects of vortices, two different configurations of AVDs were introduced: triangular-type side fins type and ring type, respectively referred as AVDSFs and AVDRS henceforth, as displayed in Figure 3. AVDSFs and AVDRs underwent a refinement process where their shapes and geometries were systematically varied in order to achieve the optimal results in terms of reducing the swirling effect and minimizing the addition of eddies to the swirling motion of the surface vortex, considering other corner or side vortices. For AVDSF configuration shown in Figure 3A, the size and number of triangular fins were varied, and the nomenclature of different configurations is provided in Table 2. Similarly, for AVDR configuration shown in Figure 3B, the ring diameter and its height from bottom were varied, and the nomenclature for different configurations is provided in Table 3. CFD simulations were conducted under similar conditions as described earlier (Section 2.1) to evaluate the performance of the AVDs. By analyzing the flow behavior with the implemented AVDs, the study aimed to assess their effectiveness in eliminating or suppressing the vortices and improving overall pump sump performance. The simulation results were meticulously compared with the baseline data obtained before the AVD deployment to gauge the impact of these anti-vortex devices on flow patterns and vortex intensity.
2.4 Model validation
In the PIV investigation conducted by Okamura [16, 52], the vortex’s position is visualized by a distinct bright spot, highlighted by a yellow dotted circle in Figure 4A. Additionally, Okamura’s CFD results displayed the vortex’s position, as depicted in their Figure 4B, with the vorticity measuring approximately 38 s-1 [16, 52]. To validate the current study’s CFD simulation, the vortex’s position and vorticity resulting from the flow were compared with Okamura’s simulation findings and are presented in Figure 4C Notably, current simulation reveals a vortex with a nearly identical vorticity of 38 s-1 positioned at a comparable location to Okamura’s study. The observed discrepancy falls within a margin of less than 5%, a variation deemed acceptable for practical purposes. This alignment suggests a strong agreement between the findings from current simulation and the results obtained through Okamura’s experimental and CFD analyses. The vorticity and helicity values are measured along a line passing through the vortex, positioned on the surface plane and representing the channel width, as indicated by the yellow dotted line in Figure 3C. The channel width is measured along the x-axis, ranging from −0.15 m to 0.15 m (Figure 2). This approach allows for investigating the effectiveness of AVDs and how they influence the vortex of interest, as well as other corner vortices.
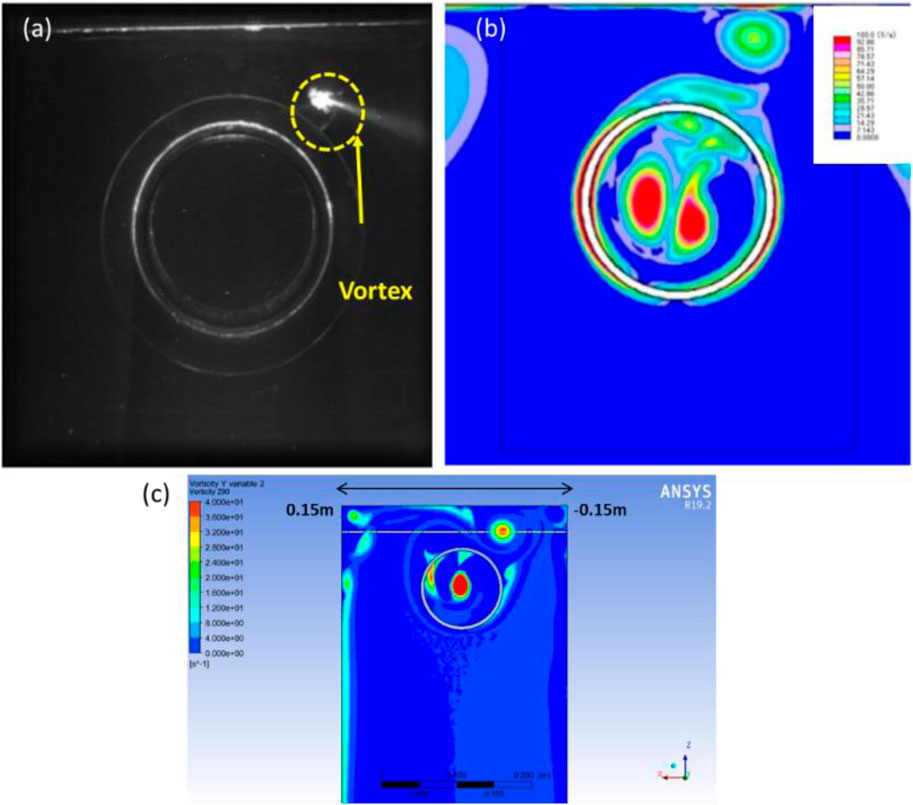
Figure 4. CFD model validation with experimental work: (A, B) PIV Experiment and CFD results, respectively, conducted by Okamura [16, 52] showing the vortex location (A) and its intensity (B), and (C) CFD results of current study showing location and vorticity of vortex.
3 Results and discussions
3.1 Deployment of AVDSFs
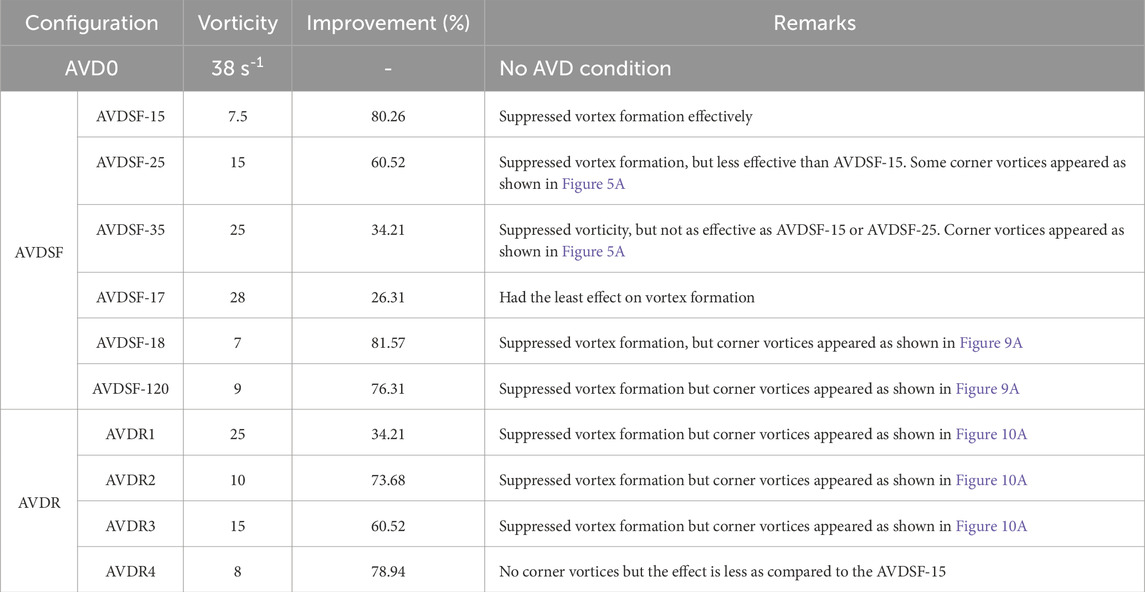
The effect of side fins with various configurations has been shown in Figure 5. It can be clearly seen that the deployment of AVDSF has positively influenced in minimizing the vorticity from about 38 s-1 for no AVD (AVD0) to 7.5 s-1, 15 s-1, 25 s-1 for AVDSF-15, AVDSF-25, and AVDSF-35, respectively as shown in Figures 5A, C. This corresponds to the remarkable reduction of up to 80.25% in surface vorticity which could be attributed to the disturbance in the vortex swirl motion caused by introduction of AVDSF [29]. A visual representation of the impact of AVDs on vortex formation and vorticity is given in the contour plots presented in Figure 6. Figure 6A displays the contour plot for AVD0, while Figures 6B–D display surface contour plots for AVDSF15, AVDSF25, and AVDSF35, respectively. These contours are obtained based Q-criterion to demonstrate the connection between regions characterized by high vorticity and the presence of vortices as discussed in literature [50]. These plots vividly illustrate how the implementation of AVDs significantly suppress the vortex formation and reduces surface vorticity. For instance, in contour plots shown in Figure 6, when no AVD was used, a strong vortex of vorticity with approximately 38 s-1 was seen while a vortex of significantly reduced vorticity was observed when AVDSF15 was implemented. Furthermore, helicity could be another measure to understand the mechanics of rotating flows and has been presented in Figures 5B, C. While vorticity, a vector quantity, measures the magnitude and direction of rotation but does not capture corkscrewing motion but helicity, a scalar quantity, indicates the degree of alignment between the velocity and vorticity fields. Including helicity allows for a better understanding of flow-twisting phenomena caused by vortices in the suction sump of pumps, providing a more comprehensive analysis of fluid dynamics and its impact on pump performance [51]. The helicity along the width of channel for AVD0 was 0.4 m2s-2, compared with 0.2 m2s-2, 0.15 m2s-2, and 0.1 m2s-2 for AVDSF-15, AVDSF-25, and AVDSF-35, respectively, on the surface vortex location. This reduction corroborates the efficacy of AVDs in disrupting the swirling motion of the vortex.
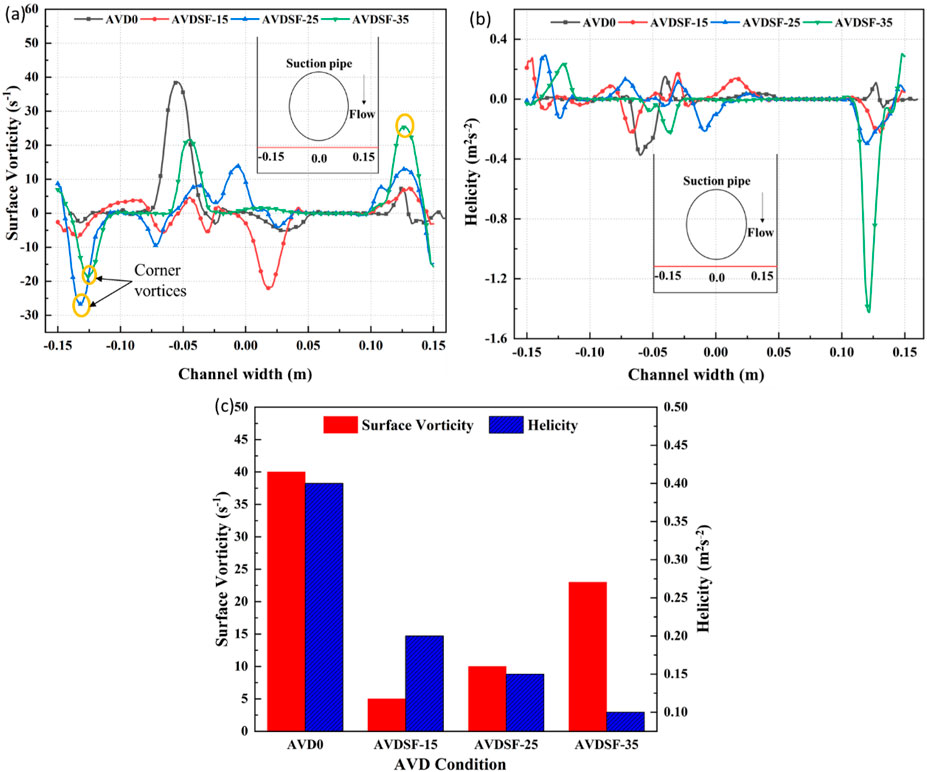
Figure 5. (A) Surface vorticities along the line shown in inset, (B) helicities along line shown in inset, and (C) maximum values of vorticity and helicity for AVD0, AVDSF-15, AVDSF-25, and AVDSF-35.
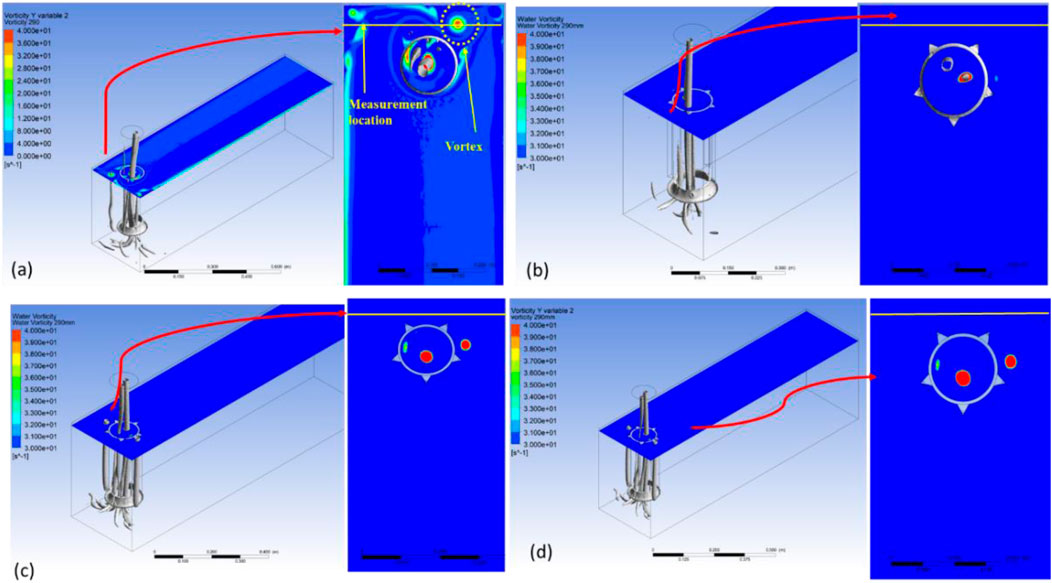
Figure 6. Contour plots showing surface vorticities for (A) AVD0, (B) AVDSF-15, (C) AVDSF-25, and (D) AVDSF-35.
Notably, among the different AVDSFs, AVDSF-15 proved most effective in suppressing the vortex because vorticity is minimum (7.5 s-1) for this configuration. As can be seen in Figure 5A, there are some vortices of concerning vorticity alongside of the channel walls known as corner vortices, which are more prominent in case of AVDSF-25 and AVDSF-35. It must be noted that the helicity of AVDSF-35 is smaller than that of AVDSF-15 and AVDSF-25. However, helicity reaches as high as 1.4 m2s-2 in the case of AVDF-35 owing to corner vortices as shown in Figure 5B. In contrast, helicity maintains a more moderate range of 0.2–0.3 m2s-2 in the case of AVDSF-15 and AVDSF-25 (Figure 5B). This distinction positions AVDSF-15 as the superior configuration among the alternatives. For convenience, vorticity and helicity for various AVDSF configurations have been exclusively shown in Figure 5C. Also, a comparison showing the improvement in vortex suppression is summarized in Table 4.
Formation and suppression of the surface vortex become evident when comparing velocity streamlines for AVD0 and AVDSF-15 as shown in Figure 7. AVD0 shows a strong vortex with a constructive counterclockwise streamline motion. However, the deployment of AVDSF-15 disrupts this pattern, introducing random or clockwise streamlines due to wake flow as shown by yellow dotted arrows in Figures 7A, B, thereby reducing the strength of vortex. Similar observations were made when AVDs were employed to suppress the FAVs [29, 35].
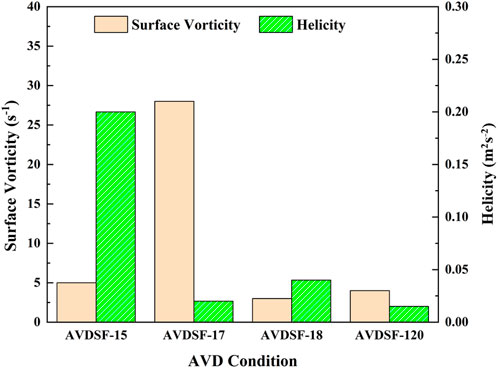
Furthermore, the effectiveness of suppression of vortex can be investigated as the function of the number of the side fins. Four sets of side fins having 5, 7, 8, and 20 fins each with a side length of 18.28 mm were chosen for analysis. Varying effects of number of side fins on vorticity and helicity have been shown in Figures 8, 9. For instance, AVDSF-17 reduces vorticity from 38 s-1 to 28 s-1 with a reduced wake flow motion, albeit less effectively than AVDSF-15, which achieves a reduction of 7.5 s-1. Similarly, AVDSF-18 and AVDSF-120 show reduced vorticity to approximately 7 s-1 and 9 s-1, respectively. However, both configurations introduce the corner vortices of magnitude 15 s-1 and 22 s-1 as shown in Figure 9A. Consequently, the AVDSF-15 configuration appears more effective than other AVDSFs configurations. This assertion is further supported by helicity graphs shown in Figure 9B where AVDSF-17 AVDSF-18, and AVDSF-120 reduce the helicity from approximately 0.4 m2s-2 to 0.02 m2s-2, 0.04 m2s-2, and 0.015 m2s-2, respectively. However, in the case of AVDSF-17 AVDSF-18, and AVDSF-120, corner vortices with high value of helicity are observed as shown in Figure 9A. Thus, the AVDSF-15 demonstrates the highest effectiveness among various combinations of side fin numbers as summarized in Table 4.
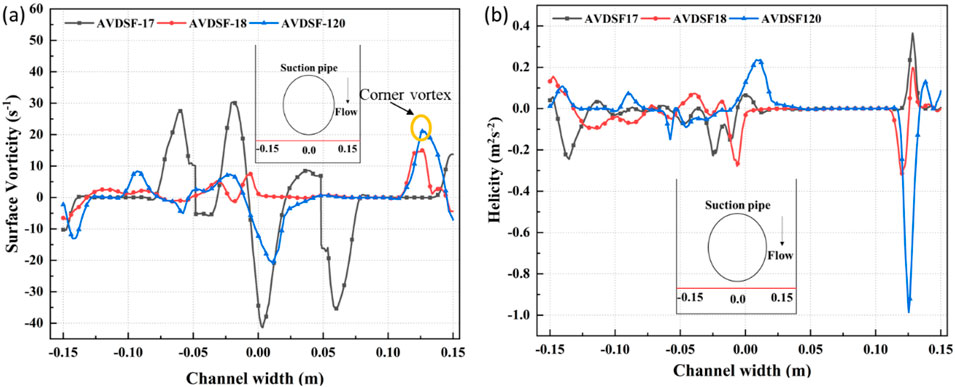
Figure 9. (A) Surface vorticities along the line shown in inset, (B) helicities along line shown in inset for various AVDSF configurations.
3.2 Deployment of AVDRs
A strong vortex of vorticity of 38 s-1 in case of no AVD condition (Figure 10A) was reduced to 25 s-1 (Figures 10A, 11A), 10 s-1 (Figures 10A, 11B), 15 s-1 (Figures 10A, 11C), and 8 s-1 (Figures 10A, 11D) with the deployment of AVDR1, AVDR2, AVDR3, and AVDR4, respectively. This suggests the positive influence of rings toward eliminating or reducing the strength of surface vortex and the improvement could be attributed to the disturbance in swirl motion of the vortex as shown by velocity streamline contours in Figure 12. The surface vortex shown in Figure 7A is disturbed with the deployment of AVDRs by introducing the streamlines of counter sense, thus reducing the vorticity as shown in Figure 12. Additionally, helicity along the width of the channel for AVD0 was 0.4 m2s-2, contrasting with 0.3 m2s-2, 0.25 m2s-2, 0.8 m2s-2, and 0.1 m2s-2 for AVDR1, AVDR2, AVDR3, and AVDR4, respectively, on the surface vortex location. This again confirms the effectiveness of AVDs in disrupting the swirling of the vortex. For convenience, vorticity and helicity for various AVDR configurations have been displayed exclusively in Figure 10C. Contour plots in Figure 10 depict how AVDs influence vortex formation and vorticity. Figure 7A presents the contour plot for AVD0, while Figures 11A–D show surface vorticity contour plots for AVDR1, AVDR2, AVDR3, and AVDR4, respectively. These plots illustrate the significant reduction in vortex formation and surface vorticity resulting from the application of AVDs.
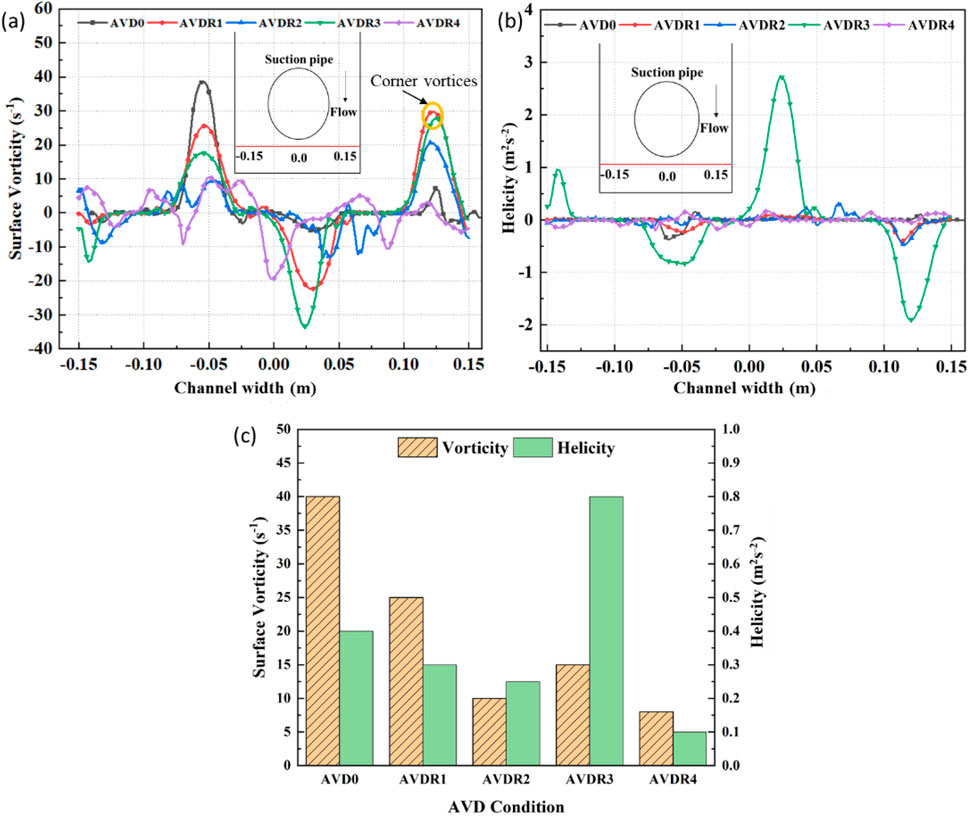
Figure 10. (A) Surface vorticities along the line shown in inset, (B) helicities along line shown in inset, and (C) maximum values of vorticity and helicity for AVD0 and various AVDR configurations.
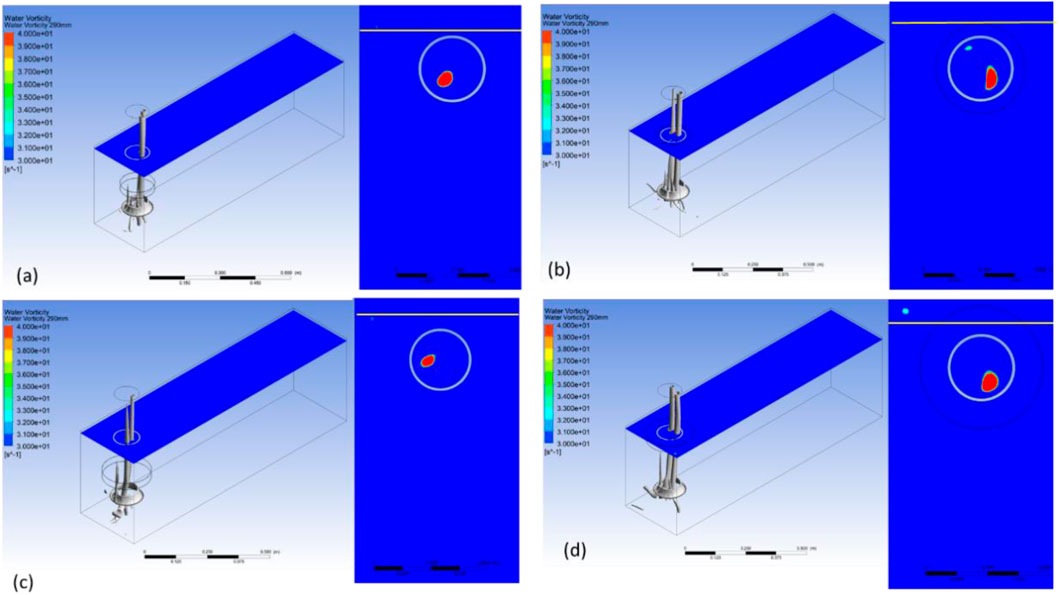
Figure 11. Contour plots showing surface vorticities for (A) AVDR1, (B) AVDR2, (C) AVDR3, and (D) AVDR4.
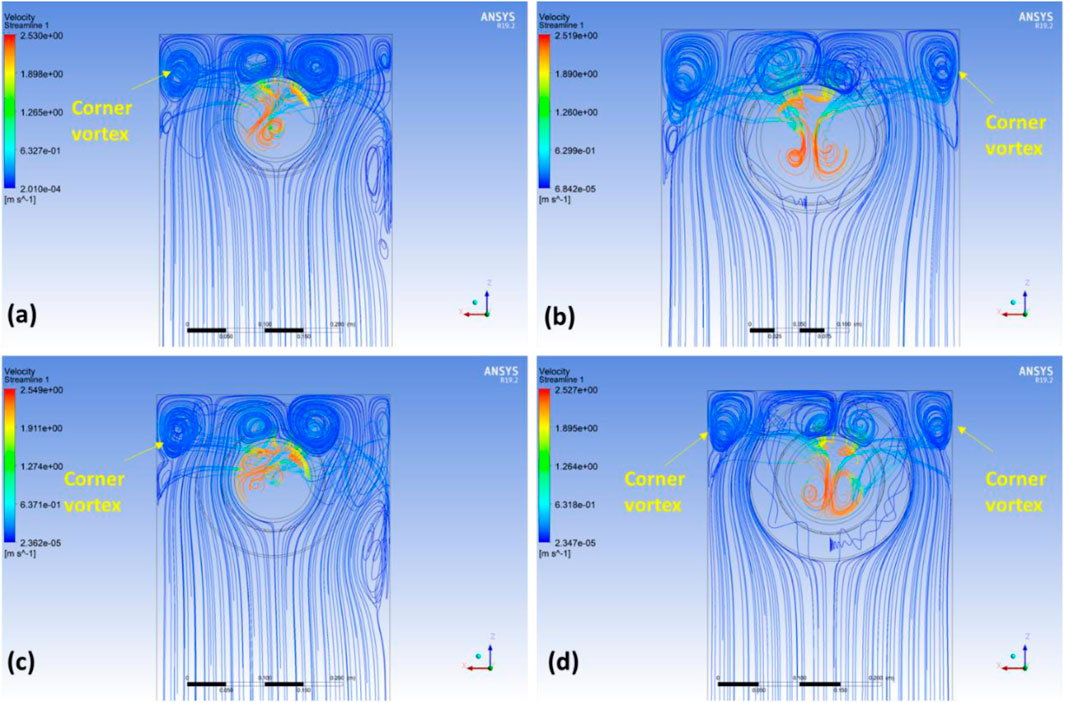
Figure 12. Velocity streamline contours for (A) AVDR1, (B) AVDR2, (C) AVDR3, and (D) AVDR4 configurations.
AVDR2 and AVDR4 exhibited smaller vorticities compared to AVDR1 and AVDR3 as shown in Figure 10C, emphasizing their superior efficacy. This difference might stem from the deployment positions; AVDR2 and AVDR4 were placed near the surface, whereas AVDR1 and AVDR3 were positioned in the middle (refer to Table 3). Consequently, AVDR2 and AVDR4 show greater effectiveness. This assertion could be further confirmed by examining the contours of velocity streamlines depicted in Figure 12. Streamlines in Figures 12A, C appear denser, indicating less disrupted swirl motion (and thus high vorticity) in the case of AVDR1 and AVDR3 compared to AVDR2 and AVDR4. A comparison of effectiveness of various configurations of AVDRs is presented in Table 4.
4 Conclusion
The study investigated the formation and mitigation of surface vortices by deploying two types of anti-vortex devices (AVDs), namely, AVDSFs (triangular fins type) and AVDRs (ring-type devices), through a CFD analysis. The results showed the effectiveness of these devices in reducing surface vortex intensity. The outcomes can be summarized as follows.
(i) In the absence of AVDs (AVD0), a prominent surface vortex with a vorticity of approximately 38 s-1 was observed in the pump sump.
(ii) With the deployment of AVDSFs, a remarkable reduction of vorticity up to 80.26% was achieved. This reduction was attributed to disruption of strong swirl motion of vortex as evidenced by velocity streamline contours. Moreover, it was shown that triangular side fins, each with 18.28 mm side length and a total of 5 fins (AVDSF-15), were most effective in diminishing the surface vortex intensity. For configurations other than AVDSF-15, a few other disturbances and corner vortices were observed.
(iii) Similarly, AVDRs also exhibited a significant reduction (80%) in surface vorticity in case of AVDR4, underscoring their effectiveness as AVDs. Velocity streamline contour plots illustrated how AVDRs disrupt the swirl motion to mitigate the surface vortex. Also, AVDRs positioned near the free surface were more effective in suppressing the surface vortex than those deployed in the middle around the periphery of suction pipe of pump.
(iv) While both types of AVDs were effective in mitigating vortex formation, factors such as manufacturability, cost, and ease of installation must be considered when selecting a specific configuration.
(v) This study can further be extended in optimizing the deployment of AVDs considering factors such as manufacturability and cost.
Data availability statement
The original contributions presented in the study are included in the article/supplementary material, further inquiries can be directed to the corresponding author.
Author contributions
AA: Funding acquisition, Resources, Supervision, Validation, Visualization, Writing–original draft, Writing–review & editing. ZH: Funding acquisition, Investigation, Methodology, Supervision, Visualization, Writing–original draft, Writing–review & editing. SA: Conceptualization, Formal Analysis, Methodology, Visualization, Writing–original draft, Writing–review & editing. MR: Conceptualization, Investigation, Methodology, Software, Validation, Visualization, Writing–original draft, Writing–review & editing. AZ: Conceptualization, Data curation, Investigation, Visualization, Writing–original draft, Writing–review & editing.
Funding
The author(s) declare that financial support was received for the research, authorship, and/or publication of this article. The Researchers would like to thank the Deanship of Graduate Studies and Scientific Research at Qassim University for financial support (QU-APC-2024-9/1).
Conflict of interest
The authors declare that the research was conducted in the absence of any commercial or financial relationships that could be construed as a potential conflict of interest.
Publisher’s note
All claims expressed in this article are solely those of the authors and do not necessarily represent those of their affiliated organizations, or those of the publisher, the editors and the reviewers. Any product that may be evaluated in this article, or claim that may be made by its manufacturer, is not guaranteed or endorsed by the publisher.
References
1. Kaya D. Experimental study on regaining the tangential velocity energy of axial flow pump. Energy Convers Management (2003) 44(11):1817–29. doi:10.1016/s0196-8904(02)00187-5
2. Moifatswane MP, Madushele N, Ahmed NA. Improving the performance of an axial flow pump: an overview. Adv Sci Technology (2021) 107:15–25. doi:10.4028/www.scientific.net/ast.107.15
3. Arocena VM, Abuan BE, Reyes JGT, Rodgers PL, Danao LAM. Numerical investigation of the performance of a submersible pump: prediction of recirculation, vortex formation, and swirl resulting from off-design operating conditions. Energies (2021) 14(16):5082. doi:10.3390/en14165082
4. Zhou R, Chen H, Dong L, Liu H, Chen Z, Zhang Y, et al. Effect of vibration and noise measuring points distribution on the sensitivity of pump cavitation diagnosis. Strojniški vestnik-Journal Mech Eng (2022) 68(5):325–38. doi:10.5545/sv-jme.2022.59
5. Wang C, Hu B, Zhu Y, Wang X, Luo C, Cheng L. Numerical study on the gas-water two-phase flow in the self-priming process of self-priming centrifugal pump. Processes (2019) 7(6):330. doi:10.3390/pr7060330
6. Yang F, Liu C. Numerical and experimental investigations of vortex flows and vortex suppression schemes in the intake passage of pumping system. Adv Mech Eng (2015) 7(2):547086. doi:10.1155/2014/547086
7. Favrel A, Müller A, Landry C, Yamamoto K, Avellan F. Study of the vortex-induced pressure excitation source in a Francis turbine draft tube by particle image velocimetry. Experiments in Fluids (2015) 56:215–5. doi:10.1007/s00348-015-2085-5
8. Baghlani A, Khayat M, Dehghan SM. Free vibration analysis of FGM cylindrical shells surrounded by Pasternak elastic foundation in thermal environment considering fluid-structure interaction. Appl Math Model (2020) 78:550–75. doi:10.1016/j.apm.2019.10.023
9. Lihui X, Tao G, Wenquan W. Effects of vortex structure on hydraulic loss in a low head Francis turbine under overall operating conditions base on entropy production method. Renew Energy (2022) 198:367–79. doi:10.1016/j.renene.2022.08.084
10. Travis QB, Mays LW. Closure to “prediction of intake vortex risk by nearest neighbors modeling” by quentin B. Travis and larry W. Mays. J Hydraulic Eng (2012) 138(4):375–6. doi:10.1061/(asce)hy.1943-7900.0000534
11. Song X, Liu C. Experimental study of the floor-attached vortices in pump sump using V3V. Renew Energy (2021) 164:752–66. doi:10.1016/j.renene.2020.09.088
12. Zhao Y, Kim C-G, Lee Y-H. CFD study on flow characteristics of pump sump and performance analysis of the mixed flow pump. In: 6th International Conference on Pumps and Fans with Compressors and Wind Turbines. Purpose-Led Publishing (2013).
13. El-Shaikh S. CFD technique for solving low water level problem of axial flow pumps. Am J Water Sci Eng (2017) 3:34–44. doi:10.11648/j.ajwse.20170303.11
14. Zheng G, Gu Z, Xu W, Lu B, Li Q, Tan Y, et al. Gravitational surface vortex formation and suppression control: a review from hydrodynamic characteristics. Processes (2022) 11(1):42. doi:10.3390/pr11010042
15. Rajendran V, Patel V. Measurement of vortices in model pump-intake bay by PIV. J hydraulic Eng (2000) 126(5):322–34. doi:10.1061/(asce)0733-9429(2000)126:5(322)
16. Okamura T, Kamemoto K. CFD simulation of flow in model pump sumps for detection of vortices. In: Proceedings of the 8th asian international fluid machinery conference (2005).
17. Okamura T, Kamemoto K, Matsui J. CFD prediction and model experiment on suction vortices in pump sump. In: Proceedings of the 9th Asian international conference on fluid machinery (2007).
18. Chao L, Haojie L, Yan J, Fan Y, Feng C, Hua Y. PIV measurements of intake flow field in axial-flow pump. Nongye Jixie Xuebao/Transactions Chin Soc Agric Machinery (2015) 46(8).
19. Chong MS, Perry AE, Cantwell BJ. A general classification of three-dimensional flow fields. Phys Fluids A: Fluid Dyn (1990) 2(5):765–77. doi:10.1063/1.857730
20. Hite JJE, Mih WC. Velocity of air-core vortices at hydraulic intakes. J Hydraulic Eng (1994) 120(3):284–97. doi:10.1061/(asce)0733-9429(1994)120:3(284)
21. Zhang B, Cheng L, Zhu M, Jiao W, Zhang D. Numerical simulation and analysis of the flow characteristics of the roof-attached vortex (RAV) in a closed pump sump. Machines (2022) 10(3):209. doi:10.3390/machines10030209
22. Uruba V, Procházka P, Sedlář M, Komárek M, Duda D. Experimental and numerical study on vortical structures and their dynamics in a pump sump. Water (2022) 14(13):2039. doi:10.3390/w14132039
23. Ferreira RN, da Rosa LM, Janzen JG. Effect of 90° elbows on pump inlet flow conditions. Appl Water Sci (2020) 10(7):169–8. doi:10.1007/s13201-020-01255-7
24. Choi J-W, Choi YD, Kim CG, Lee YH. Flow uniformity in a multi-intake pump sump model. J Mech Sci Technology (2010) 24:1389–400. doi:10.1007/s12206-010-0413-5
25. Amin A, Kim BH, Kim CG, Lee YH. Numerical analysis of vortices behavior in a pump sump. In: 29th IAHR Symposium on Hydraulic Machinery and Systems. Purpose-Led Publishing (2019).
26. Arocena VM, Abuan BE, Reyes JGT, Rodgers PL, Danao LAM. Reduction of entrained vortices in submersible pump suction lines using numerical simulations. Energies (2020) 13(22):6136. doi:10.3390/en13226136
27. Kim J-H, Choi Y-S, Lee K-Y. A numerical study on the suction performance of a submerged cargo pump. The KSFM J Fluid Machinery (2008) 11(6):18–23. doi:10.5293/KFMA.2008.11.6.018
28. Johansson AE, Stacy PS, White DK, Lin F. Advancements in hydraulic modeling of cooling water intakes in power plants. In: ASME power conference (2005).
29. Kim H-J, Park SW, Rhee DS. Effective height of a floor splitter anti-vortex device under varying flow conditions. Sustainability (2017) 9(2):285. doi:10.3390/su9020285
30. Wang C-y., Wang F, Wang H, Zhao H, Yao Z, Xiao R. Computation method and control strategy of rotating separation flows in hydraulic machinery. J Hydrodynamics (2022) 34(6):1006–20. doi:10.1007/s42241-023-0089-9
31. Kabiri-Samani AR, Borghei SM. Effects of anti-vortex plates on air entrainment by free vortex. Scientia Iranica (2013) 20(2):251–8. doi:10.1016/j.scient.2012.10.041
32. Taghvaei SM, Roshan R, Safavi KH, Sarkardeh H. Anti-vortex structures at hydropower dams. Int J Phys Sci (2012) 7(28):5069–77. doi:10.5897/ijps12.387
33. Wu P, Guo Z, Qian Z, Wang Z, Chen F. Numerical simulation and experiment on free-surface air-entraining vortices in pump sump. Trans The Chin Soc Agric Machinery (2018) 49:120–5. doi:10.6041/j.issn.1000-1298.2018.02.016
34. Khadem Rabe B, Ghoreishi Najafabadi SH, Sarkardeh H. Numerical simulation of anti-vortex devices at water intakes. In: Proceedings of the institution of civil engineers-water management. Thomas Telford Ltd (2018).
35. Kim CG, Choi YD, Choi JW, Lee YH. A study on the effectiveness of an anti vortex device in the sump model by experiment and CFD. In: 26th IAHR Symposium on Hydraulic Machinery and Systems. Purpose-Led Publishing (2012).
36. Roshan R, Ghobadian R. The effect of reservoir geometry on the critical submergence depth in hydroelectric power plants intake. Appl Water Sci (2023) 13(7):155. doi:10.1007/s13201-023-01960-z
37. Roshan R, Sarkardeh H, Zarrati A. Vortex study on a hydraulic model of Godar-e-Landar Dam and hydropower plant. Comput Methods Multiphase Flow V (2009) 63:217–25. doi:10.2495/MPF090191
38. Mahdi AS, Reza ZA, Reza R, Hamed S. Surface vortex prevention at power intakes by horizontal plates. In: Proceedings of the institution of civil engineers-water management. Thomas Telford Ltd (2011).
39. Sarkardeh H, Zarrati AR, Roshan R. Effect of intake head wall and trash rack on vortices. J Hydraulic Res (2010) 48(1):108–12. doi:10.1080/00221680903565952
40. Monshizadeh M, Tahershamsi A, Rahimzadeh H, Sarkardeh H. Comparison between hydraulic and structural based anti-vortex methods at intakes. The Eur Phys J Plus (2017) 132:329–11. doi:10.1140/epjp/i2017-11608-4
41. Norizan TA, Reda E, Harun Z. Enhancement of vorticity reduction by floor splitter in pump sump to improve pump efficiency. Sustainable Energ Tech assessments (2018) 26:28–36. doi:10.1016/j.seta.2017.06.001
42. Park I, Kim HJ, Seong H, Rhee D. Experimental studies on surface vortex mitigation using the floating anti-vortex device in sump pumps. Water (2018) 10(4):441. doi:10.3390/w10040441
43. Echávez G, McCann E. An experimental study on the free surface vertical vortex. Experiments in Fluids (2002) 33(3):414–21. doi:10.1007/s00348-002-0463-2
44. Tahershamsi A, Rahimzadeh H, Monshizadeh M, Sarkardeh H. An experimental study on free surface vortex dynamics. Meccanica (2018) 53:3269–77. doi:10.1007/s11012-018-0878-3
45. Rabe BK, Najafabadi SHG, Sarkardeh H. Numerical simulation of air-core vortex at intake. Curr Sci (2017) 113:141–7. doi:10.18520/cs/v113/i01/141-147
46. Constantinescu G, Patel V. Numerical model for simulation of pump-intake flow and vortices. J Hydraulic Eng (1998) 124(2):123–34. doi:10.1061/(asce)0733-9429(1998)124:2(123)
47. Carregal-Ferreira J, Holzwarth A, Menter F, Luu A. Advanced CFD analysis of aerodynamics using CFX. Otterfing: AEA Technology GmbH (2002). p. 1–14.
48. Menter FR. Two-equation eddy-viscosity turbulence models for engineering applications. AIAA J (1994) 32(8):1598–605. doi:10.2514/3.12149
49. Huang P, Bardina J, Coakley T. Turbulence modeling validation, testing, and development. NASA Tech memorandum (1997) 110446:10–2514.
50. Soto-Valle R, Cioni S, Bartholomay S, Manolesos M, Navid Nayeri S, Bianchini A, et al. Vortex identification methods applied to wind turbine tip vortices. European Academy of Wind Energy (2021). p. 1–28.
51. Choi H, Moin P. Grid-point requirements for large eddy simulation: chapman’s estimates revisited. Phys Fluids (2012) 24(1). doi:10.1063/1.3676783
Keywords: axial pumps, anti-vortex devices, vorticity, swirl motion, CFD, modeling, and simulation
Citation: Alaboodi AS, Hussain Z, Abbas S, Rehman Mu and Zulfiqar A (2024) Mitigating surface vortex formation in pump sump intakes through anti-vortex devices: a comprehensive CFD study. Front. Phys. 12:1456256. doi: 10.3389/fphy.2024.1456256
Received: 28 June 2024; Accepted: 20 November 2024;
Published: 05 December 2024.
Edited by:
Alessandra Adrover, Sapienza University of Rome, ItalyReviewed by:
Hasan Shahzad, Dongguan University of Technology, ChinaTitus Ofei, Norwegian University of Science and Technology, Norway
Copyright © 2024 Alaboodi, Hussain, Abbas, Rehman and Zulfiqar. This is an open-access article distributed under the terms of the Creative Commons Attribution License (CC BY). The use, distribution or reproduction in other forums is permitted, provided the original author(s) and the copyright owner(s) are credited and that the original publication in this journal is cited, in accordance with accepted academic practice. No use, distribution or reproduction is permitted which does not comply with these terms.
*Correspondence: Zahid Hussain, emFoaWQuaHVzc2FpbkB1ZXQuZWR1LnBr; Masood ur Rehman, bWFzb29kc2FxaUBnbWFpbC5jb20=
 Abdulaziz S. Alaboodi1
 Zahid Hussain
 Saqlain Abbas
