- 1College of Mechanical and Electrical Engineering, China Jiliang University, Hangzhou, China
- 2School of Electrical Engineering, Zhejiang University of Water Resources and Electric Power, Hangzhou, China
- 3Joint Laboratory of Intelligent Equipment and System for Water Conservancy and Hydropower Safety Monitoring of Zhejiang Province and Belarus, Hangzhou, China
- 4School of Electrical and Control Engineering, North University of China, Taiyuan, China
- 5School of Electrical Engineering, Xi’an Shiyou University, Xi’an, China
This study presents a novel refractive index sensor based on Fano resonance, incorporating a metal-insulator-metal (MIM) waveguide coupled with a circular ring structure (CRC). Using finite element method analysis, we investigated the propagation properties of the sensor. To evaluate their influence on sensor performance, we systematically varied the parameters of each Circular Resonant Cavity structure component, including the refractive index, employing a controlled variable approach. At its optimal configuration, the sensor achieves a maximum sensitivity of 3,240 nm/RIU and a figure of merit (FOM) of 57.9. With its high sensitivity, straightforward design, and suitability for temperature detection, the refractive index sensor holds promise for diverse applications.
1 Introduction
A surface plasmon polariton is a quantum state formed by the interaction of an electromagnetic wave with a surface charge oscillation on the surface or interface of a material. This exciton forms at the interface of a metal or conductive medium and a non-conductive medium as a result of a charge distribution change. It results from light waves interacting with free electrons on the metal’s surface. When a light wave strikes a metal surface, it can trigger free electron oscillations on the surface, resulting in a composite wave called a surface plasma wave [1]. In this phenomenon, the electric field energy is concentrated near the medium’s surface, resulting in heightened interaction between the electromagnetic wave and the surface electrons, which leads to the formation of a new excited state, the surface plasmon-polariton. Such polaritons have essential applications in optics, nanophotonics, and sensors, since they provide super-optical resolution and enhanced light fields, hence improving the performance of many optical systems.
This complex wave can propagate at the interface, concentrating the majority of the field energy there, while its strength rapidly diminishes vertically [2–4]. SPPs have significant application potential at the nanoscale since their wavelength is relatively shorter than that of traditional optical waves. To achieve control and use of the SPP, the type, thickness, and surface shape of the metal can be changed, as well as the frequency, propagation length, and coupling efficiency. In the field of nanooptics, a variety of nanostructures, including nanopore arrays, nanotroughs, nanospheres, and nanorods, have been designed using SPPs. These nanostructures can be used in surface-enhanced spectroscopy, nanomanipulation, nanosensing, and photonics devices, in addition to being able to manipulate the properties of SPPs and achieve local light field enhancement effects [5].
As a result of ongoing research and development, a diverse range of metal and insulator waveguides including configurations such as metal–dielectric–metal waveguides [6] and medium–metal–dielectric waveguides [7], have been demonstrated to effectively excite Surface Plasmon Polaritons (SPPs). Furthermore, SPPs can also be induced at interfaces where metal and media come into contact. Among the various types, Metal-Insulator-Metal (MIM) waveguides have been noted for their ability to achieve longer distances of SPPs transmission within very compact dimensions. Additionally, MIM waveguides are characterized by reduced ohmic losses and enhanced confinement of SPPs [8]. This set of advantages has facilitated the development of various innovative coupling cavities utilizing MIM waveguide structures. These include designs such as semi-annular, oblique pitch, bisymmetric rectangle, cross-shaped, and split-toroidal configurations [9–13], each offering unique benefits in the manipulation and control of SPPs.
In plasma waveguide-coupled systems, numerous optical phenomena, including Fano resonance, have been reported [14]. The Fano resonance phenomenon, which occurs when continuous bands and discrete energy levels interact in atomic systems, causes zero absorption at particular light frequencies [15–18]. Fano resonance in SPPs originates from a mechanical principle: a directly coupled differential clear-state superradiation mode results in a relatively flat line when light impinges upon the MIM linear waveguide. However, certain metal nanoparticles necessitate the coupling of light modes—referred to as the dark subradiation mode—with a narrower, sharper line shape for activation, as they cannot be directly stimulated by light. The phenomenon of Fano resonance, characterized by a steep and asymmetrical curve, emerges when these two radiation states overlap and interact with each other [19]. Fano resonance is the asymmetry of spectral lines caused by zero absorption at a particular light frequency. Fano resonance is a unique optical phenomenon that happens at a specific light frequency, causing light absorption by a material to drop to zero and producing an asymmetric effect of spectral lines. Fano resonance’s transmission spectrum is narrower than that of standard plasmon resonance, making it more sensitive to changes in the structure of the material and its surroundings. Furthermore, the Fano resonance generates a stronger local electromagnetic field, which increases sensitivity [9, 20].
This research introduces a novel design for a nanoscale refractive index sensor that incorporates an annular cavity within a circular structure, which is further embedded into a ring connected to a Metal-Insulator-Metal (MIM) waveguide. The design’s focus is on how to effectively manipulate light at the nanoscale using the coupled mode theory (CMT) [21] and the finite element method (FEM) [22] to analyze the propagation characteristics of the proposed structure.
The simulation findings reveal a phenomenon: the circular and L structures on the ring interact with one another, producing asymmetric resonant waveforms from the discrete narrowband modes generated by the CRC structure. This interaction leads to unique sensing capabilities by affecting the waveform in response to changes in the refractive index.
Additionally, the investigation explores the fine-tuning of the sensor’s performance through adjustments to specific geometric parameters of the CRC structure. These parameters encompass the side length (L1) of the L structure situated in the lower-left corner, the outer radius (R1) of the CRC, the radius (R2) of the circular structure in the upper right corner, and the coupling gap (g) between the MIM waveguide and the CRC structure. The sensitivity of the CRC’s resonance spectrum to these parameters allows for a highly customizable sensor design, enabling precise control over the propagation characteristics essential for various nanoscale sensing applications. This approach underscores the intricate balance between geometry and optical properties in designing effective nanoscale sensors.
2 Structure and methodology
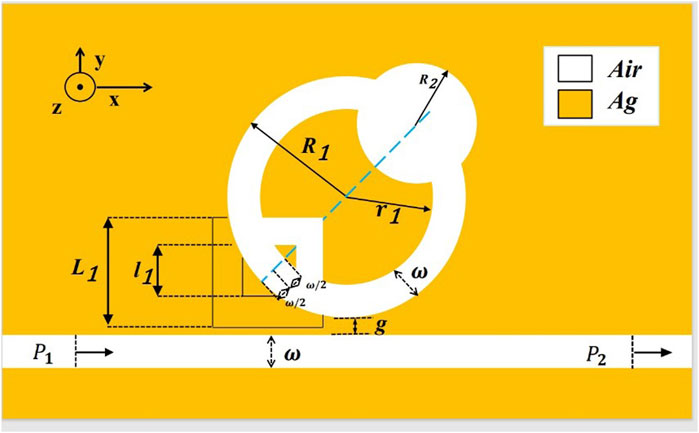
Figure 1 displays the schematic diagram of this design’s fundamental structure. The 2D model can be used to approximate the 3D model because it has lower hardware configuration and meshing requirements than the 3D model, and because the 3D structure’s magnetic field characteristics are similar to those of the 2D structure. R2 is the radius of the ring in the upper right corner. The centers of the circular structure located in the upper right corner and the square structure located in the lower left corner are first located on the diagonal dividing line of the circle 45° to the right, and then in the middle of the cavity. R1 and r1 represent the outer and inner circle radii of the CRC structure, respectively. The radius of r1 is 50 nm different from the radius of R1 and concentric L1 and l1 are the side lengths of the outer and inner squares with a 100 nm difference in the side length of the lower left corner, respectively. The width of the toroidal cavity and L-cavity and the waveguide in the CRC structure is denoted by
In Equation 1, the conductivity of Ag is denoted as
Where k signifies the wave vector in the waveguide and is specified as
Three key parameters are recommended for evaluating the performance of sensor characteristics: Half-width (FWHM), Sensitivity (S), and Figure of Merit (FOM). Specifically, the parameter S is employed to assess the sensitivity of the sensor, quantifying how responsive it is to changes in its environment. The FOM provides a comprehensive evaluation by considering both the half-width and sensitivity, offering a holistic measure of the sensor’s effectiveness. The FWHM parameter is crucial for evaluating the sharpness of the spectral line. It quantifies the width of the spectral line at half of its maximum height in the trough, thereby indicating the precision of the sensor’s spectral response. The researchers used Equation 3 and Equation 4 for the assessment, as detailed in references [16, 25]:
The geometry of the sensor system was modeled in COMSOL Multiphysics 5.4a, where ∆λ and ∆n denote wavelength and refractive index changes, respectively. A precisely matched layer is formed to absorb the light reflected to the exterior. To ensure the accuracy of the computational results, we utilize a super-triangular mesh in the MIM waveguide and CRC structures, effectively capturing nanoscale details and boundary effects with mesh sizes ranging from nanometers to sub-nanometers, varying according to the structure. Specifically, the grid size is finer in areas with smaller intervals and coarser in regions with larger intervals. Additionally, we establish boundary conditions where the scale lines on our dials perfectly match those on the scale. We also implement boundary conditions at the top and bottom of the structure to absorb incident light on the simulation boundaries, minimizing the impact of boundary reflections on the simulation results. This setup ensures a smooth transition with the waveguide structure boundary, preventing discontinuities or interference. Next, to fully investigate the optical response of the sensor system, a 1 nm step-by-step simulation was performed over the wavelength range of 1800 nm–3,000 nm. Such an analog configuration offers a thorough insight of the sensor’s performance and guarantees that any potential optical effects are captured over a wide wavelength range.
3 Simulation results and analysis
The CRC structure was divided, and the parameters of each component were changed independently to examine their impact on sensor performance. Additionally, the effects of the parameters between the CRC structure and the waveguide were examined. Following comparison, it was discovered that the CRC structure had a higher FOM value and was around 600 more sensitive in the given refractive index range than the single-ring structure. As a result, CRC was chosen for additional research.
The sensor’s initial structural parameters are as follows: g = 10 nm, L1 = 240 nm, R1 = 240 nm, and R2 = 100 nm. The simulated split CRC structure and the simulated single rectangular baffle structure were done in order to have a better understanding of the Fano resonance production process and the propagation characteristics of the overall structure Figure 2. The transmission spectra of waveguide only a single ring, a ring and a square structure, a ring and a small circular structure, and a CRC structure are represented by the red, blue, green, and purple lines, in that order. Interference occurs between the background state (continuous mode) of the Fano resonance, i.e., the continuous distribution curve produced by the single waveguide structure, and the defect state (discrete mode), i.e., the discrete spectrum produced by the addition of the square and tiny circular structures, and the asymmetric line shapes produced by the interference can be seen in the spectral response plots of Figure 2. This results in an asymmetrical and sharply defined feature in the transmission spectrum of the system. In contrast, a single rectangular baffle structure exhibits a transmission spectrum characterized by a straight line with a slight downward slope. A continuous broadband mode is thought to exist at the spots on the line with higher transmittance. Straight waveguide linked CRC’s transmission spectral structure displays symmetrical troughs, a feature common to Lorentz resonance, which is seen as a distinct narrow-band mode that generates the Fano resonance.
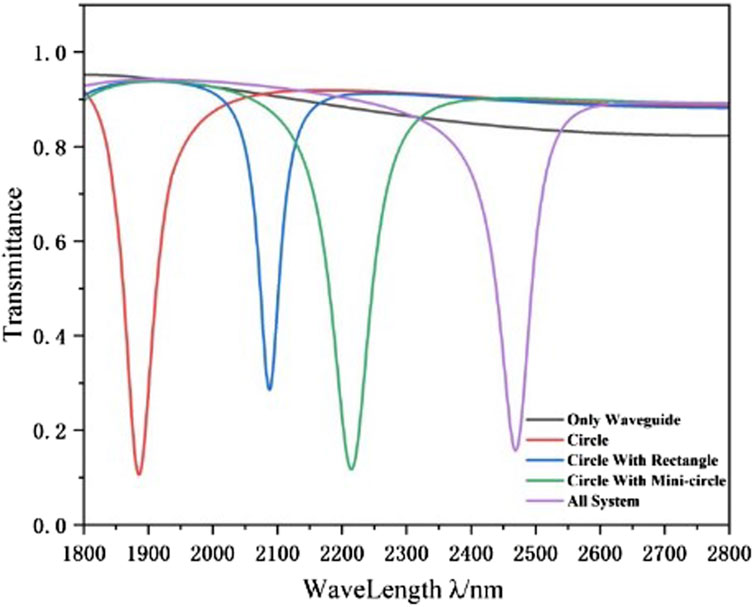
Figure 2. Transmission spectra of single ring (red line), ring and square structure (blue line), ring and small circular structure (green line), and CRC structure (purple line),waveguide only (brown line).
To better understand the generation process of Fano resonance, the magnetic field distributions of single ring, ring and square structure, ring and Small round structures, and CRC structure (λ = 2,469 nm) were examined (Figures 3A–D, respectively). It is discovered that the SPPs in all four structures can flow through the waveguide and couple into the four structures. As shown in Figure 3A, although the total magnetic field is weak, especially in the bus waveguide, the normalised magnetic field is mainly dispersed in the upper and lower regions of the ring, with a sensitivity S of 2,320 nm/RIU. In Figure 3B, the addition of the tiny ring structure serves as a convergence of the magnetic field, so that the SPPs converge more in the ring cavity, which improves the performance of the sensor, and the sensitivity reaches 3,000 nm/RIU. In Figure 3C, although the separate square structure improves the transmittance, the straight waveguide is able to conduct the optical signal efficiently and reduce the optical loss. In Figure 3D, the normalised magnetic field is mainly dispersed in the CRC structure, with only a small portion present in the waveguide, which suggests that the resonance is strong, and the sensitivity S finally reaches 3,240 nm/RIU. The CRC’s magnetic field is spread in the upper right and lower left, and it is reversed. After combining the two structures, the magnetic field distribution converges in the symmetrical direction, and the coupling strength improves dramatically.

Figure 3. Normalized magnetic field distributions at λ = 2,469 nm of (A) the single ring; (B) ring and small circular structure; (C) ring and square structure; (D) CRC structure First, the refractive index is added from 1.00 to 1.05 in 0.01 steps on the basis of the fixed structural parameters R1 = 240 nm, R2 = 100 nm, L1 = 240 nm, g = 10 nm, ω = 50 nm to investigate the effect of refractive index on the performance of CRC structural sensors, and the results are given in Figures 4A, B. Figure 4A illustrates that when the refractive index increases, the transmission spectrum shifts practically evenly. The refractive index change solely affects the transmission spectrum’s position spectrum, not its overall waveform trend. As illustrated in Figure 4B, the wavelength shift of the inclination angle varies linearly with refractive index. Based on this feature, the proposed structure can function as a refractive index sensor. Calculating the slope of the fitting line yields the sensor’s sensitivity of 3,240 nm/RIU, with the ideal value of 57.9 being the best parameter for the structure.
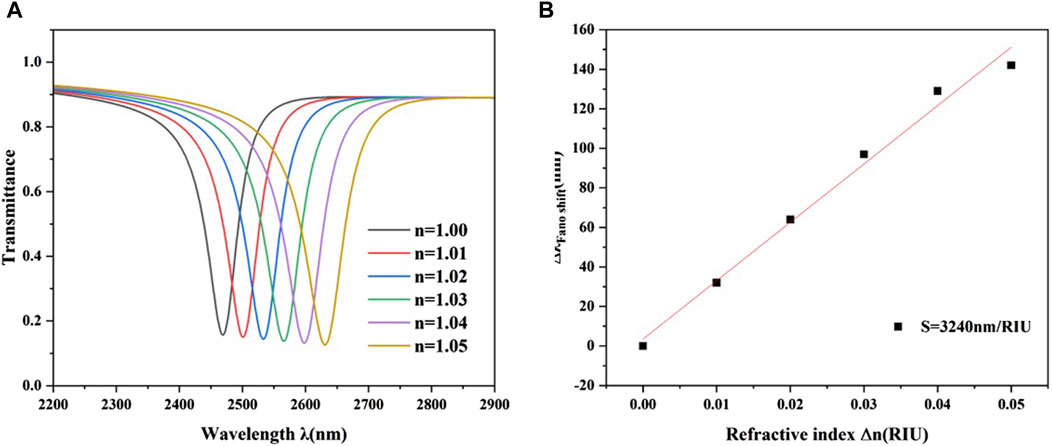
Figure 4. (A) Transmission spectra with different refractive indices. (B) Fitting line of inclination wavelength as a function of refractive index.
Due to the significant influence of the geometric features of the structure on Fano resonance, we extensively investigated the impact of various parameters on the Fano resonance transmission spectrum. Initially We investigated the effect of the outer radius of the CRC structure on the Fano resonance. The outer radius R1 was tuned from 240 nm to 280 nm at 10 nm intervals, while keeping the remaining parameters constant. As depicted in Figure 5A, the transmission spectra at different outer radii show a slight increase in transmittance at the dip angle as R1 increases. Moreover, a notable redshift in the curve is observed with increasing radius R1, indicating that R1 plays a crucial role in determining the wavelength of the Fano resonance band. Figure 5B displays the sensitivity for various radii, calculated using linear fitting. It can be observed that the sensitivity increases from 1951 nm/RIU to 2,469 nm/RIU as the outer radius of the CRC structure grows. Thus, in practical applications, the appropriate radius can be selected based on the desired sensitivity requirements.
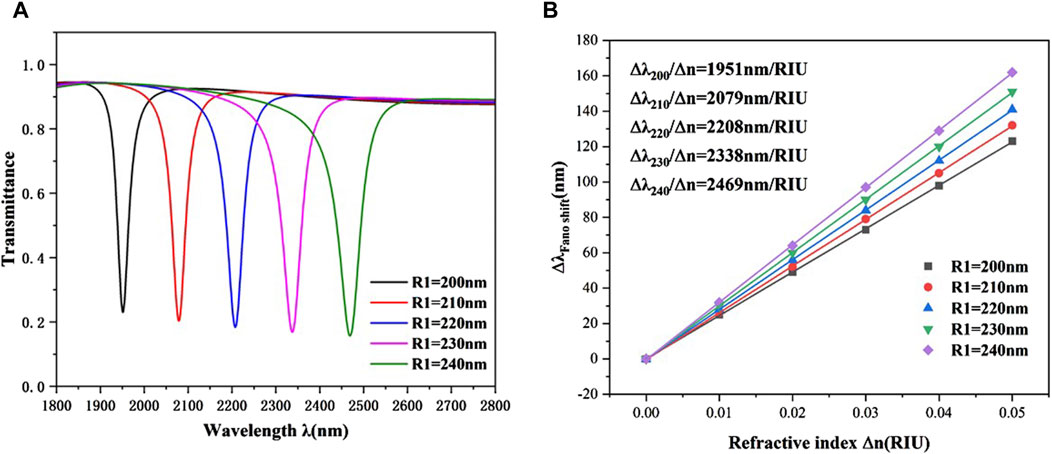
Figure 5. (A) Transmission spectra of the whole structure at different radii R1. (B) Sensitivity fitting lines at different R1.
The influence of another CRC structural component, the lower left square, on the sensor’s propagation performance was then investigated. The lower right square is shifted from 240 nm to 280 nm, while the other parameters stay constant. Figures 6A,B show the simulation results and sensitivity fit lines, respectively. As L1 increases, the transmission spectrum exhibits a small redshift. However, the transmission spectrum’s structure has remained substantially unaltered. Figure 6B shows that increasing the side length L1 improves the overall system’s sensitivity marginally. Therefore, as shown in Figure 6, when the edge length of a square structure is appropriately modified, it does not have much effect on sensitivity.
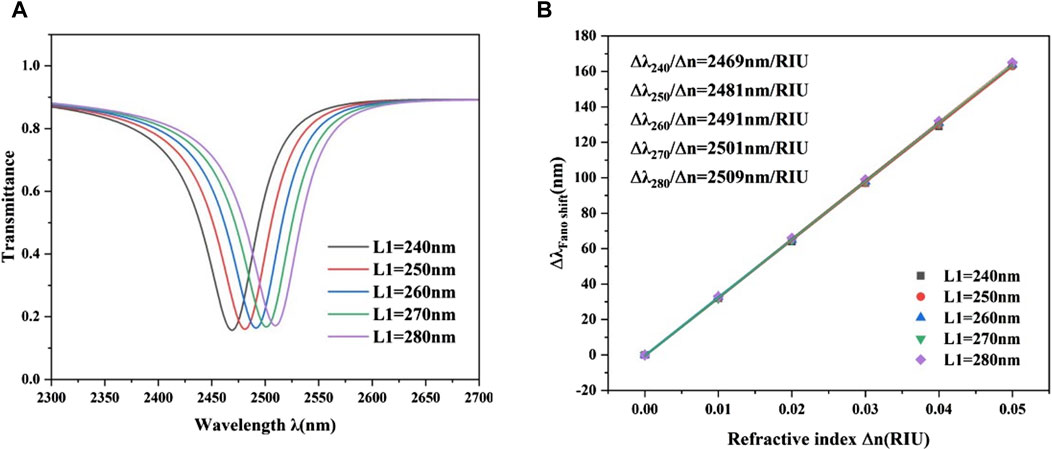
Figure 6. (A) Transmission spectrum of CRC structure with different square side lengths L1 in the lower left corner. (B) Fitting sensitivity lines for L1 with different side lengths.
The influence of another CRC structural feature on the sensor’s transmission characteristics was then examined. The radius of the circular structure in the upper right corner was changed from 60 nm to 100 nm, while the other parameters remained constant. Figures 7A,B show the simulation results and the sensitivity fit lines. Figure 7A displays the transmission spectra created at different exterior radii. As R2 grows, the transmittance at the inclination increases little. Furthermore, when radius R increases, the curve shows a little redshift, showing that radius R2 influences the wavelength of the Fano resonance band. When seen in the picture, the refractive index increases from 2,211 nm/RIU to 2,469 nm/RIU when the outer radius of the CRC structure grows. Thus, in real applications, the proper radius can be chosen based on the sensitivity requirements.
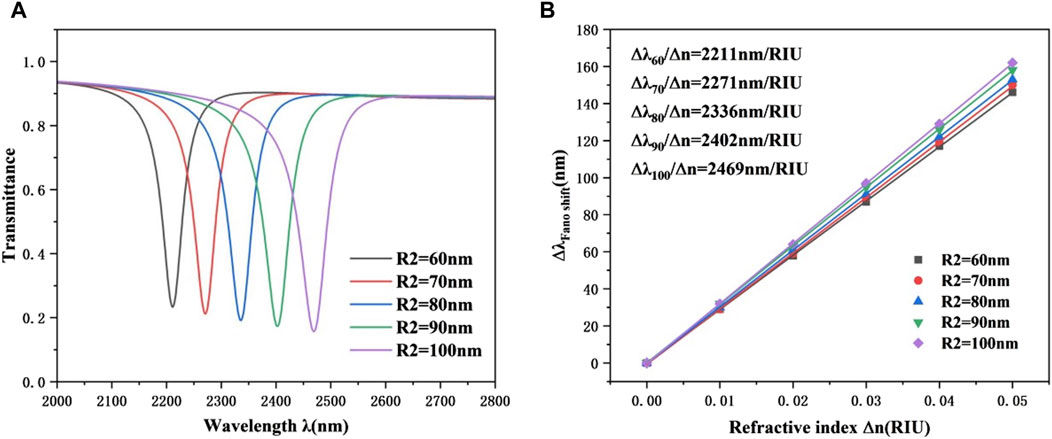
Figure 7. (A) Transmission spectra of CRC structures with different radius R2 in the upper right corner. (B) Fitting sensitivity lines for R2 of different circular structures.
Finally, we investigate the effect of the coupling gap between the waveguide and the CRC structure on the performance. While keeping the other parameters constant, g is varied between 5 and 25 nm. Figure 8A illustrates a significant blue shift in the curve, accompanied by changes in transmittance with the alteration of the coupling gap. Additionally, Figure 8B indicates a dramatic narrowing of the FWHM as g increases from 5 nm to 25 nm. This suggests a weakening interaction between surface plasmon polaritons (SPPs) and the CRC structure with increasing g. Figure 8C displays sensitivity curves for different coupling gaps. Sensitivity decreases as the coupling gap widens, peaking at 2,515 nm/RIU when g = 5 nm. However, at g = 10 nm, the difference in FWHM values compared to g = 10 nm is excessively significant, resulting in a relatively modest FOM value. Therefore, the system’s sensing performance is optimal at g = 10 nm. At this point, sensitivity is 3,240 nm/RIU, with an FOM of 57.9, which is better than many existing parameters listed in Table 1.
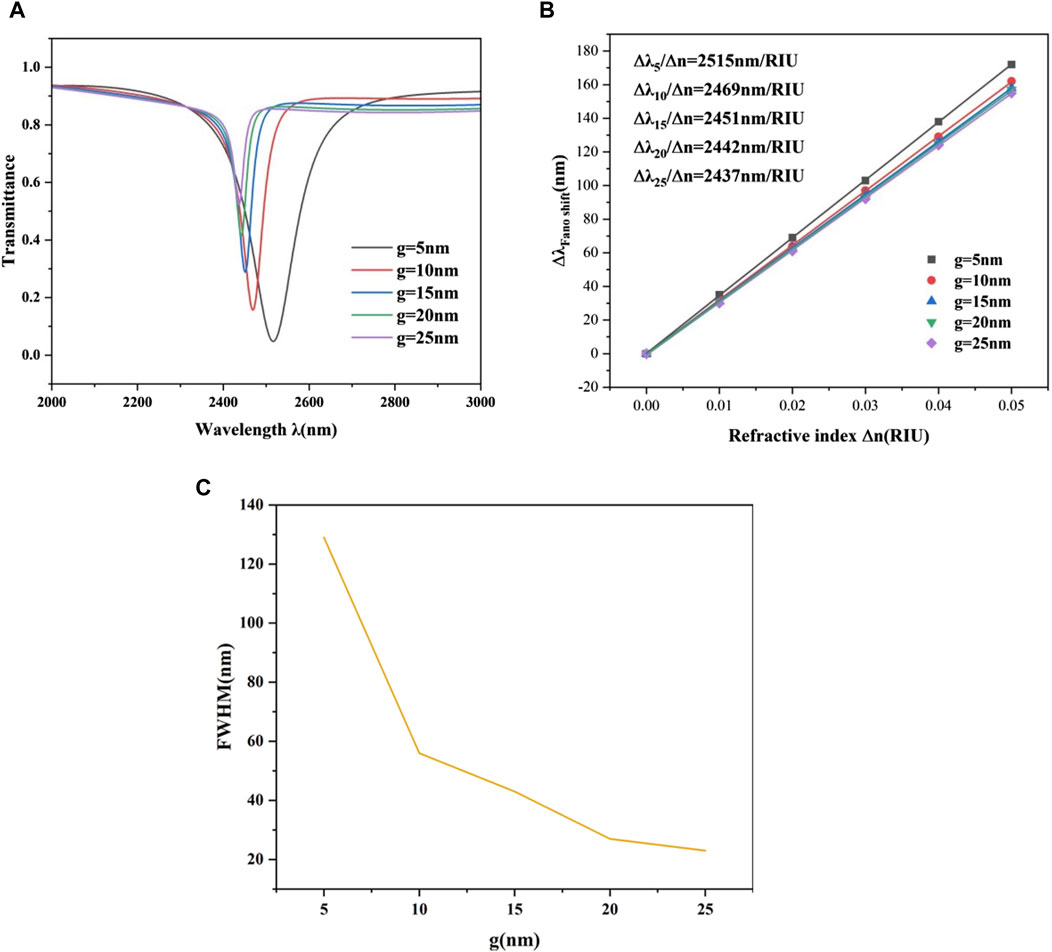
Figure 8. (A) Transmission spectra at different coupling gaps. (B) Sensitivity fitting lines at different coupling gaps. (C) Sensitivity curves at different coupling degree gaps.
4 Application in Temperature Sensing
Given the specific requirements of the CRC(Circular Resonant Cavity) structure, ethanol was chosen as the ideal filler ingredient due to its notable refractive index temperature coefficient of 3.94 × 10⁻⁴ (°C−1). This value indicates a high degree of sensitivity and stability, making the structure particularly suited for temperature sensing applications. In comparison, silver and quartz exhibit much lower refractive index temperature coefficients, at 8.60 × 10⁻⁶ (°C−1) and 9.30 × 10⁻⁶ (°C−1) respectively. Such low coefficients mean that variations in temperature have a negligible impact on their refractive indices, thus making them less suitable for this specific application.
The selection of ethanol enhances the CRC structure’s efficiency and reliability in temperature sensing. This is due to ethanol’s refractive index being linearly proportional to temperature across a wide range, from its melting point at −144°C to its boiling point at 78°C. This proportionality allows for precise and accurate temperature measurements within this range, which is crucial for applications where exact temperature monitoring is essential. Equation 5 can be used to express the refractive index of ethanol as a function of temperature [32]:
T denotes the ambient temperature and the reference temperature T0 is set to 20°C. Determine the operating temperature of this sensor to be −80°C–70°C. In order to ensure the detection effect, we determined that the limited detection upper limit is 130°C.Nevertheless, When the sensor is operating in the environment exceeds this range, the sensor’s measurement accuracy diminishes, leading to increased measurement errors. The structural parameters are as follows: g = 10 nm,R1 = 240 nm, R2 = 100 nm, L1 = 240 nm,
Based on the specified test temperature range, the temperature change (
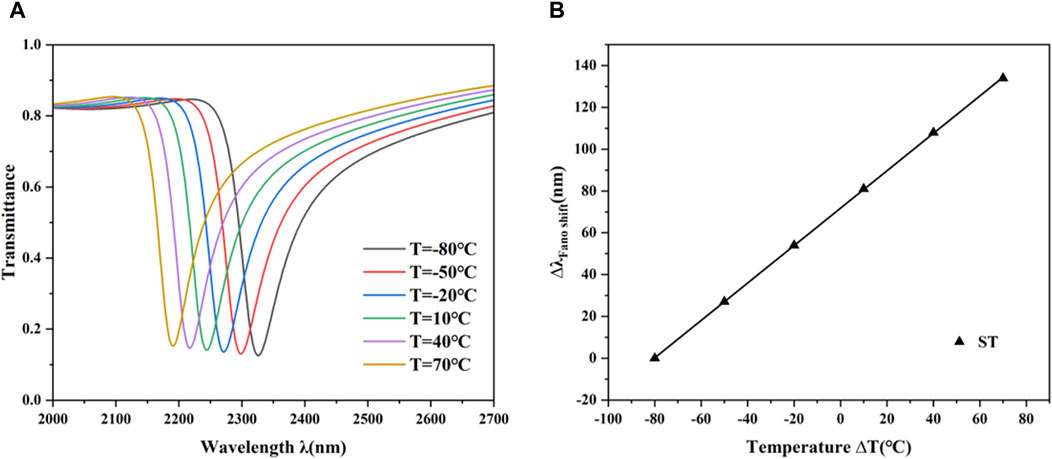
Figure 9. (A) Transmittance curve at temperatures from −80°C to 70°C. (B) Sensor sensitivity fitting curve.
Furthermore, Figure 9B presents the sensor’s sensitivity fitting line, where linear fitting is applied to ensure the accuracy of measurements. This method of linear fitting is instrumental in deriving the sensor’s sensitivity, which is determined to be 0.9 nm/°C. This sensitivity value is crucial for the sensor’s ability to provide precise and reliable temperature readings, particularly in environments where exact temperature monitoring is essential.
5 Conclusion
In this research, we devised a nanoscale refractive index sensor utilizing Fano resonance. This resonance arises from the coupling of an MIM waveguide structure with a CRC structure. We examined how the refractive index and geometric parameters of both the CRC and MIM waveguide affect the sensor’s overall sensing characteristics using the finite element method. During incremental modifications to the CRC structure’s parameters, we observed that the impact of different parameters on final sensitivity varied significantly in a step-like pattern. Specifically, the wavelength of the Fano resonance shifts towards redshift as the refractive index (n), the radius of the outer circle (R1), the radius of the upper-right circular structure (R2), and the side length of the lower-left L structure (L1) increase. However, when g increases, the Fano resonance wavelength exhibits a significant blue shift,and sensitivity increases. The highest sensitivity occurs at a gap of 5 nm, but this configuration is impractical due to its excessively large FWHM, resulting in a substantial reduction in the final figure of merit (FOM). Upon analyzing the structure, optimal sensing performance is achieved when the parameters are set to R1 = 240 nm, R2 = 100 nm, L = 240 nm,
Data availability statement
The original contributions presented in the study are included in the article/Supplementary Material, further inquiries can be directed to the corresponding author.
Author contributions
HC: Conceptualization, Data curation, Formal Analysis, Investigation, Methodology, Software, Writing–original draft, Writing–review and editing. SY: Funding acquisition, Investigation, Project administration, Resources, Supervision, Validation, Writing–original draft, Writing–review and editing. YC: Data curation, Software, Supervision, Visualization, Writing–original draft. WJ: Data curation, Formal Analysis, Visualization, Writing–review and editing. XY: Conceptualization, Supervision, Writing–review and editing. CW: Software, Supervision, Writing–review and editing. GL: Conceptualization, Supervision, Writing–review and editing. AX: Project administration, Supervision, Writing–review and editing. TW: Supervision, Writing–review and editing. YL: Supervision, Writing–review and editing, Validation.
Funding
The author(s) declare that financial support was received for the research, authorship, and/or publication of this article. The work was supported in part by the National Natural Science Foundation of China under Grant No.62374148, in part by the Zhejiang Provincial Natural Science Foundation of China under Grant No. LD21F050001, the Key Research Project by Department of Water Resources of Zhejiang Province under Grant No. RA2101, the Key Research and Development Project of Zhejiang Province under Grant No. 2021C03019, and the Funds for Special Projects of the Central Government in Guidance of Local Science and Technology Development under Grant No. YDZJSX20231A031.
Acknowledgments
The authors are grateful to other colleagues in the laboratory for their understanding and help. They are also grateful to their affiliates for providing research platforms and to their sponsors for providing them with financial support.
Conflict of interest
The authors declare that the research was conducted in the absence of any commercial or financial relationships that could be construed as a potential conflict of interest.
Publisher’s note
All claims expressed in this article are solely those of the authors and do not necessarily represent those of their affiliated organizations, or those of the publisher, the editors and the reviewers. Any product that may be evaluated in this article, or claim that may be made by its manufacturer, is not guaranteed or endorsed by the publisher.
References
1. Bv NN, Khanna A, Singh M. Aperture-coupled plasmonic ring resonator-based temperature sensor: 3-D FEM modeling. IEEE Trans Plasma Sci (2024) 1–8. doi:10.1109/tps.2024.3403677
2. Raether H. Surface plasmons on gratings. Surf plasmons Smooth rough Surf gratings (2006) 91–116. doi:10.1007/bfb0048323
3. Liu L, Han Z, He S. Novel surface plasmon waveguide for high integration[J]. Optics Express, 2005, 13(17): 6645-6650.
4. Zayats A V, Smolyaninov I I, Maradudin A A. Nano-optics of surface plasmon polaritons[J]. Physics reports, 2005, 408(3-4): 131-314.
5. Iida Y, Nikaido S, Miyaji G. Sub-100-nm periodic nanostructure formation induced by short-range surface plasmon polaritons excited with few-cycle laser pulses[J]. Journal of Applied Physics, 2021, 130(18).
6. Gramotnev D.K., Bozhevolnyi S.I. Plasmonics beyond the diffraction limit. Nat. Photonics 2010, 4, 83–91.
7. Dai M., Chen Z., Zhao Y., Gandhi M., Fu H. State-of-the-Art Optical Microfiber Coupler Sensors for Physical and Biochemical Sensing Applications. Biosensors 2020, 10, 179.
8. Veronis G., Fan S.H. Crosstalk between three-dimensional plasmonic slot waveguides. Opt. Express 2008, 16, 2129–2140.
9. Chen J, Li J, Liu X, et al. Fano resonance in a MIM waveguide with double symmetric rectangular stubs and its sensing characteristics[J]. Optics communications, 2021, 482: 126563.
10. Yang Q, Liu X, Guo F, et al. Multiple Fano resonance in MIM waveguide system with cross-shaped cavity[J]. Optik, 2020, 220: 165163.
11. Chen J, Yang H, Fang Z, et al. Refractive index sensing based on multiple fano resonances in a split-ring cavity-coupled MIM waveguide[C]//Photonics. MDPI, 2021, 8(11): 472.
12. Liu X, Li J, Chen J, et al. Independently tunable triple Fano resonances based on MIM waveguide structure with a semi-ring cavity and its sensing characteristics[J]. Optics express, 2021, 29(13): 20829-20838.
13. Pang S, Huo Y, Xie Y, et al. Fano resonance in MIM waveguide structure with oblique rectangular cavity and its application in sensor[J]. Optics Communications, 2016, 381: 409-413.
14. Mahboub O, El Haffar R, Farkhsi A. Optical Fano resonance in MIM waveguides with a double splits ring resonator[J]. J. New Front. Spatial Concepts, 2018, 13: 181-187.
15. Pathak A.K., Singh V.K. SPR Based Optical Fiber Refractive Index Sensor Using Silver Nanowire Assisted CSMFC. IEEE Photonics Technol. Lett. 2020, 32, 465–468.
16. Zafar R, Salim M. Enhanced figure of merit in Fano resonance-based plasmonic refractive index sensor[J]. IEEE Sensors Journal, 2015, 15(11): 6313-6317.
17. Sharma Y, Zafar R. Fano Resonance enhanced Refractive Index sensing using Arc based Plasmonics Resonator[J]. IEEE Sensors Letters, 2023.
18. Adhikari R, Chauhan D, Mola G T, et al. A review of the current state-of-the-art in Fano resonance-based plasmonic metal-insulator-metal waveguides for sensing applications[J]. Opto-Electronics Review, 2021, 29.
19. Cennamo N, Del Prete D, Arcadio F, et al. A temperature sensor exploiting plasmonic phenomena changes in multimode POFs[J]. IEEE Sensors Journal, 2022, 22(13): 12900-12905.
20. Zhu J, Wu C. Optical refractive index sensor with Fano resonance based on original MIM waveguide structure[J]. Results in Physics, 2021, 21: 103858.
21. Zeng W, Liu G R. Smoothed finite element methods (S-FEM): an overview and recent developments[J]. Archives of Computational Methods in Engineering, 2018, 25(2): 397-435.
23. Li S., Wang Y., Jiao R. Fano resonances based on multimode and degenerate mode interference in plasmonic resonator system. Opt. Express 2017, 25, 3525–3533.
24. Kekatpure R.D., Hryciw A.C., Barnard E.S., Brongersma M.L. Solving dielectric and plasmonic waveguide dispersion relations on a pocket calculator. Opt. Express 2009, 17, 24112–24129.
25. Markevich N, Gertner I. Comparison among methods for calculating FWHM[J]. Nuclear Instruments and Methods in Physics Research Section A: Accelerators, Spectrometers, Detectors and Associated Equipment, 1989, 283(1): 72-77.
26. Zhang X, Cui J, Liu J, et al. A window-shaped resonator nanostructure based on an MIM waveguide for refractive index sensing[C]//2022 4th International Conference on Intelligent Control, Measurement and Signal Processing (ICMSP). IEEE, 2022: 451-454.
27. Zafar R, Nawaz S, Singh G, et al. Plasmonics-based refractive index sensor for detection of hemoglobin concentration[J]. IEEE Sensors Journal, 2018, 18(11): 4372-4377.
28. Li Z., Wen K., Chen L., Lei L., Zhou J., Zhou D., Fang Y., Wu B., “Refractive index sensor based on multiple Fano resonances in a plasmonic MIM structure,” Appl. Opt., 2019, 58, 4878–4883.
29. Xie Y., Huang Y., Zhao W., Xu W., He C., “A novel plasmonic sensor based on metal–insulator–metal waveguide with side-coupled hexagonal cavity,” IEEE Photon. J., 2015, 7, 4800612.
30. Zhao J, Fan X, Fang W, et al. High-Performance Refractive Index and Temperature Sensing Based on Toroidal Dipole in All-Dielectric Metasurface[J]. Sensors, 2024, 24(12): 3943.
31. Butt M A, Kazanskiy N L, Khonina S N. Highly sensitive refractive index sensor based on plasmonic bow tie configuration[J]. Photonic sensors, 2020, 10: 223-232.
32. Bian Z Y, Liang R S, Zhang Y J, et al. Multifunctional disk device for optical switch and temperature sensor[J]. Chinese Physics B, 2015, 24(10): 107801.
Keywords: MIM, Fano resonance, CRC structure, FEM, SPPs
Citation: Chen H, Yan S, Cao Y, Jiang W, Yan X, Wang C, Liu G, Xu A, Wu T and Li Y (2024) Nanoscale temperature sensors based on MIM waveguide coupling and ring-embedded nanostructures. Front. Phys. 12:1456177. doi: 10.3389/fphy.2024.1456177
Received: 28 June 2024; Accepted: 02 August 2024;
Published: 20 August 2024.
Edited by:
David McIlroy, Oklahoma State University, United StatesReviewed by:
Mandeep Singh, National Institute of Technology, Karnataka, IndiaJun Zhu, Guangxi Normal University, China
Copyright © 2024 Chen, Yan, Cao, Jiang, Yan, Wang, Liu, Xu, Wu and Li. This is an open-access article distributed under the terms of the Creative Commons Attribution License (CC BY). The use, distribution or reproduction in other forums is permitted, provided the original author(s) and the copyright owner(s) are credited and that the original publication in this journal is cited, in accordance with accepted academic practice. No use, distribution or reproduction is permitted which does not comply with these terms.
*Correspondence: Shubin Yan, eWFuc2hiQHpqd2V1LmVkdS5jbg==
 Hongfu Chen1,2,3
 Shubin Yan
 Aiwei Xu