 Yuanyuan Wang1*
 Shaofeng Yan1
 Hauwa Suleiman Abdullahi1Shangbing Gao1Haiyan Zhang1Xiuchuan Chen1Hu Zhao2
- 1School of Computer and Software Engineering, Huaiyin Institute of Technology, Huai’an, Jiangsu, China
- 2Jiangsu Kesheng Xuanyi Technology Co., Ltd., Huai’an, Jiangsu, China
Introduction: Chemical special steels are widely used in chemical equipment manufacturing and other fields, and small defects on its surface (such as cracks and punches) are easy to cause serious accidents in harsh environments.
Methods: In order to solve this problem, this paper proposes an improved defect detection algorithm for chemical special steel based on YOLOv8. Firstly, in order to effectively capture local and global information, a ParC2Net (Parallel-C2f) structure is proposed for feature extraction, which can accurately capture the subtle features of steel defects. Secondly, the loss function is adjusted to MPD-IOU, and its dynamic non-monotonic focusing characteristics are used to effectively solve the overfitting problem of the bounding box of low-quality targets. In addition, RepGFPN is used to fuse multi-scale features, deepen the interaction between semantics and spatial information, and significantly improve the efficiency of cross-layer information transmission. Finally, the RexSE-Head (ResNeXt-Squeeze-Excitation) design is adopted to enhance the positioning accuracy of small defect targets.
Results and discussion: The experimental results show that the mAP@0.5 of the improved model reaches 93.5%, and the number of parameters is only 3.29M, which realizes the high precision and high response performance of the detection of small defects in chemical special steels, and highlights the practical application value of the model. The code is available at https://github.com/improvment/prs-yolo.
1 Introduction
As a key element of the stable operation and safety guarantee of chemical equipment, chemical special steel [1] has excellent corrosion resistance and high temperature and high pressure resistance, and its application value under extreme conditions is incomparable. Whether it's a delicate chemical reactor or a transport line in a harsh environment [2], these steels are essential for efficient and safe industrial production [3]. However, it is precisely this high-intensity application environment that makes even the smallest surface defects, such as small cracks or hidden holes [4], enough to become a potential danger to major safety accidents, directly threatening human safety and environmental protection. Therefore, the development of efficient and accurate defect detection technology has become an urgent problem to be solved, and its urgency and importance are self-evident.
In recent years, the vigorous development of deep learning technology has brought innovation to traditional industries, among which the combination of image recognition technology and deep neural networks is gradually penetrating and reshaping the detection standards of the chemical industry [5]. Given the special complexity of the application scenarios of chemical special steel and the strict requirements for safe production, it is particularly critical to achieve high accuracy in the detection of various minor defects [6]. In practical applications, we have evaluated the existing detection methods (infrared detection method, magnetic flux leakage detection method, etc.), especially in the complex and drastically changing working environment, the missed detection rate of small size defects by traditional means is as high as 30%, and even for small defects less than 1 mm, the missed detection rate rises to nearly 50%. In addition, the traditional method cannot meet the inspection needs of more than 10 workpieces per second in the high-speed production line due to the limitation of reaction speed, which increases the risk of missed detection [7]. This situation cannot meet the needs of high-precision detection, a high recall rate, or accurate positioning for all types of defects in chemical special steel. Therefore, given the limitations and challenges mentioned above, we designed a detection algorithm that can accurately identify a variety of small defects in chemical special steels. This algorithm has high detection accuracy, achieves real-time response and fully meets the comprehensive performance requirements of high identification accuracy, high recall rate, and accurate positioning proposed for defect detection in the field of chemical special steels [8].
In summary, this paper proposes the YOLOv8-based steel defect detection algorithm PRS-YOLO (ParC2Net-RepGFPN-RexSE-Head-YOLO). The contributions of this paper are listed as follows.
• A novel ParC2Net parallel substructure is proposed, which can effectively enhance the capture of local detail features and global information of the target by the backbone network, and improve the detection ability of the model on dense targets on chemical special steels.
• The efficient feature fusion network RepGFPN is adopted, which not only promotes the full interaction between high-level semantic information and low-level spatial information, but also greatly optimizes the transmission efficiency of defect information between various layers and reduces the inference time of the model.
• The MPD-IoU loss function is fused, which optimizes the processing of targets with significant size variation and complex attitude in chemical special steels, effectively enhances the generalization ability of the algorithm, and ensures the high-precision recognition and evaluation performance of the model in complex scenarios.
• A RexSE-Head detection head mechanism is designed, which weights the channel information while improving the parallel processing capability of the detection head, which effectively enhances the sensitivity of the network to small target detection.
2 Related
2.1 Target detection method
At present, defect identification methods can be summarized into two main categories according to the characteristics of object detection models: one-stage detection and two-stage detection algorithms [9]. The one-stage method, represented by YOLO [10] and SSD [11], has been widely used in industrial defect detection due to its efficient real-time processing speed and practicability. YOLO is particularly suitable for rapid production line monitoring [12] because of its limitations in the identification of small defects and the fact that the positioning accuracy of the bounding box is slightly inferior to that of Faster R-CNN [13]. SSDs improve the detection ability of defects of different sizes by fusing multi-scale feature maps, but their positioning accuracy still faces challenges in the face of extremely small or complex defects, especially in low-contrast backgrounds. On the other hand, the two-stage algorithms, including the R-CNN series and the Mask R-CNN [14], have excellent performance in the accuracy and recall of defect identification due to their step-by-step processing strategies, especially the Faster R-CNN effectively enhances the detection ability of multi-scale defects through RPN [15]. Mask R-CNN introduces instance segmentation on this basis, which greatly improves the depiction accuracy of complex and unknown defect contours, but this improvement in fineness is accompanied by a significant increase in computational cost, which limits its application in scenarios with strict real-time requirements.
In recent years, innovative detection methods have emerged one after another to solve the problem of small target detection, surpassing the traditional two-stage framework, and emerging anchor-free deep models such as PP-YOLOE [16] and Gold YOLO [17], as well as DETR [18] using Transformer architecture. PP-YOLOE optimizes the YOLO design to improve the detection performance of small targets. Gold YOLO’s distribution mechanism strengthens the real-time detection accuracy and refreshes the perspective of industrial defect identification. DETR abandons sliding windows and anchor frames to achieve efficient object detection in an end-to-end manner, especially in dense target and long-distance correlation analysis, opening up a new path for small object detection. These cutting-edge technologies not only enrich the inspection methods of chemical specialty steels, but also clarify the future research trend: on the basis of ensuring accuracy, accelerate inspection and save computing resources, and meet the high standards of industrial-grade applications.
In view of the fact that this study focuses on practical application requirements, especially in environments that require fast response and limited hardware resources, the one-stage model is preferred due to its high efficiency. Therefore, the follow-up discussion will deepen the exploration of the optimization path of these models, reveal their potential performance improvement in small object detection through empirical analysis, and integrate the cutting-edge methods mentioned above, such as the anchor-free mechanism based model and high-performance variants, in order to bring more comprehensive and in-depth insights to defect detection technology.
2.2 Improved target detection method
In practical application scenarios, in order to achieve efficient, accurate and rapid response detection of small defects (such as cracks, punching, etc.) in chemical special steels, Therefore, to achieve good results with high detection accuracy and a fast response for small defects such as cracks and punching, it is necessary to carry out targeted optimization of existing defect detection algorithms. Wang et al. [19] adopted the fully convolutional YOLO detection network to conduct an in-depth study of strip surface defects and achieved efficient end-to-end detection. However, with the deepening of the network hierarchy and the application of down sampling operations such as pooling layers, a fully convolutional network may lose some of its spatial position details, resulting in a decrease in the accuracy of fine segmentation of small objects or boundaries. Akhyar et al. [20] optimized the SSD model to identify possible defects on steel surfaces and introduced the RetinaNet method for defect classification. Nevertheless, the SSD model is not ideal for detecting small defects. The default anchor boxes often have difficulty accurately covering and identifying such small targets after multistage down sampling. Xia et al. [21] innovatively improved the YOLO algorithm by adding a coordinate attention mechanism and constructing a feature fusion structure using a multipath spatial pyramid pooling module. Although this improvement enhances the sensitivity of the model to the target position and the detection performance of small targets, it still has the problem of insufficient detection accuracy when facing targets of different scales, complex backgrounds, and sizes.
Kou et al. [22] improved the YOLOv3 algorithm and improved the detection accuracy by introducing a frameless mechanism to improve the detection speed and designing a dense convolutional module to enrich the feature information. Although dense convolutional blocks improve the depth and breadth of feature learning by the model, they also increase the computational complexity and the number of model parameters, which not only consume more storage resources but also may prolong the inference time, especially in the deployment environment of embedded systems with limited resources. In addition, Jiang et al. [23] carefully optimized the YOLOv5 algorithm by using a K-means clustering algorithm to reconfigure the preset anchor parameter to fit the features of actual data samples and added an MA attention mechanism to enhance feature extraction. In addition, the BiFPN module was used to replace the PANet structure in the neck part to achieve comprehensive multiscale feature fusion. These changes improved the detection accuracy by 2.9% while maintaining the lightweight model. However, poor matching between the preset frame and the real target shape can cause defects that cannot be effectively located and identified.
Recent studies, such as the comparative study of automatic image detection and transfer learning [24] and image learning algorithms for small datasets [25], provide valuable references, especially in extracting key features from images and processing small datasets and complex image features.
In view of the existing challenges in the field of defect detection in chemical special steels, especially the limitations of small defect identification, this study innovatively constructs a high-precision multi-category defect detection model, focusing on the accurate detection of subtle defects. By innovating feature extraction, optimizing feature fusion and detection architecture, the model’s ability to capture micro-defects and interact with deep features is greatly improved, ensuring excellent positioning and identification performance when dealing with complex defects such as microcracks and fine holes, and fully meeting the high-precision standards for micro-defect detection of special steel in actual production.
3 Methodology
While maintaining the advantages of YOLOv5, YOLOv8 is committed to model lightweight and accurate upgrades to adapt to various real-time applications. In this design, the C3 module is abandoned, the C2f module is adopted to strengthen feature extraction and target positioning, and the performance is significantly improved by optimizing the internal integration mechanism [26]. The “head” of the model adopts a decoupled-head design to separate classification and boundary box regression tasks. In the regressive head part, the number of 4*reg_max channels is set by the DFL strategy to enhance the accuracy of position and size prediction and effectively promote the overall prediction efficiency.
Although YOLOv8 has demonstrated powerful real-time detection capabilities in many scenarios, it faces limitations in detecting microscopic defects (such as cracks and punching) in chemical specialty steels. The inherent hierarchical feature extraction mechanism has limited ability to capture small features in low-resolution images, insufficient mining of defect fine morphology and texture information, coupled with the risk of overfitting in cases of strong variability and data scarcity, and the low attention of loss function and optimization strategy to such defects, resulting in limited detection sensitivity and accuracy in this application [27].
To this end, this paper proposes a defect detection model for chemical special steel based on YOLOv8 architecture: PRS-YOLOv8. In response to the complexity of chemical specialty steel defect detection, we adopted histogram equalization, ParC2Net feature extractor, efficient RepGFPN to fuse multi-scale features, and innovative RexSE-Head inspection head design, a series of strategies to ensure that the model can still show excellent real-time inspection accuracy and efficiency in harsh industrial sites. Figure 1 illustrates the comprehensive network architecture design of the PRS-YOLOv8 model.
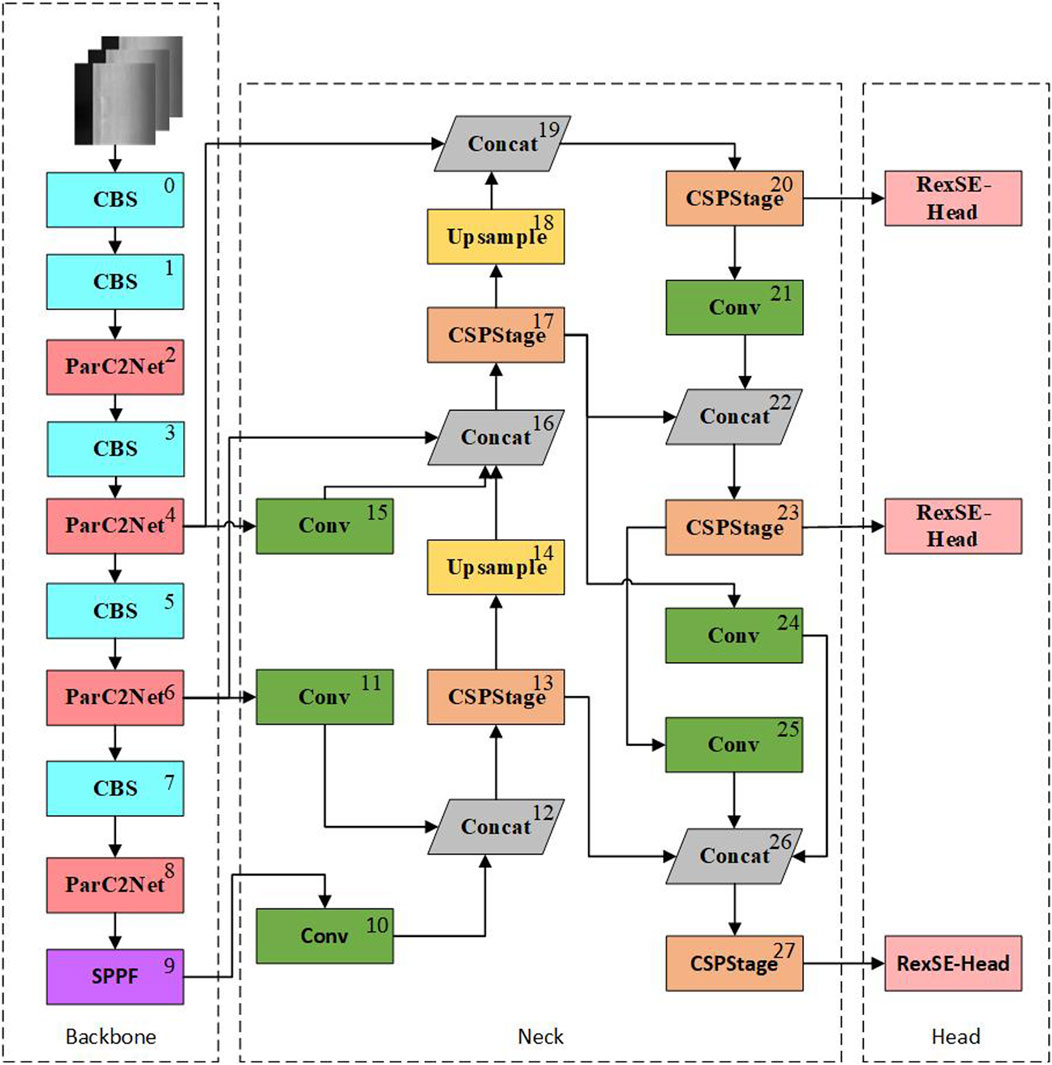
Figure 1. PRS-YOLO network structure. The structures of ParC2Net, RexSE-Head, and CSPStage in the neck are explained in detail in 3.2–3.4.
3.1 Data preprocessing
In order to enhance the generalization performance and robustness of the model in complex scenes, we adopted a series of image preprocessing strategies. Firstly, the representation of defects under different viewing angles and sizes is simulated by random scaling, combined with image flipping to reveal the anisotropic characteristics of defects, which effectively alleviates the problem of overfitting and promotes the extensive identification ability of the model. Secondly, the adaptive histogram equalization technology [28] was applied to dynamically optimize the brightness and contrast of the image, especially for the uneven illumination, and effectively suppress the background noise. Unlike the global approach, adaptive equalization processes image areas separately to improve overall image quality while maintaining local contrast, making detailed features more prominent, which is essential for defect detection.
Figure 2 below shows an example of an image after adaptive histogram equalization in the algorithm, which intuitively reflects the role of the technology in enhancing the visual effect of the image and improving the visibility of key details.
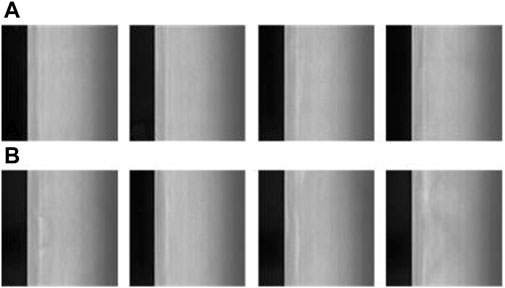
Figure 2. Illustration of the effect of adaptive histogram equalization: (A) raw image and (B) image after adaptive histogram equalization.
3.2 Backbone
In the YOLOv8 framework, the backbone component is responsible for extracting key features from the image data, a process that is critical for subsequent defect detection [29]. Although the classical C2f architecture effectively promotes the deep expression of features through the bottleneck building blocks, which integrates the double-layer 3 × 3 convolution and activation function, and enhances the learning potential of the model through residual connection, its understanding of global semantics may inadvertently weaken the focus on subtle local features, which poses an obstacle to the accurate identification of fine defects such as microcracks and punching in chemical special steels, and affects the accuracy of positioning accuracy [30]. In response to this limitation, we innovatively designed the ParC2Net parallel substructure, which is designed to capture multi-scale image details while maintaining the real-time performance of the system.
Specifically, by replacing the bottleneck convolution in the original C2f module with the ParNet architecture, we use its unique parallel flow design to dynamically adjust the size of the receptive field, so as to delicately grasp the local characteristics and global structure information of the defect without sacrificing speed. This dynamic adaptation mechanism of ParNet enables the model to accurately focus on the key regions containing complex details and macrostructure information, which is particularly important for identifying cracks and punching defects with fine local morphology and macrostructure associations. ParNet’s core innovation also includes the integrated SSE (Channel Squeeze and Spatial Excitation) attention mechanism [31], which is an advanced feature recalibration strategy. By adaptively learning the weights of different feature channels, the SSE mechanism can enhance the feature expression that is crucial to the detection task, while suppressing irrelevant information, ensuring that the model can clearly distinguish and highlight the decisive features of microscopic defects even in a visually complex background, which greatly improves the feature expression ability and the accuracy of defect detection of the model [32].
As shown in Figure 3, the integration of ParNet not only optimizes the feature extraction process, but also promotes the efficient fusion of feature maps at different levels, realizes cross-scale and multi-dimensional feature capture, and significantly enhances the comprehensiveness and depth of feature extraction. What’s more noteworthy is that ParC2Net’s simplified architecture design not only ensures high detection accuracy, but also effectively reduces the computing burden and memory occupation, accelerates the inference speed, and ensures that the model can still run efficiently in a resource-limited environment. This feature enables ParC2Net to demonstrate excellent performance stability and adaptability in practical applications dealing with large-scale datasets or hardware resource constraints.
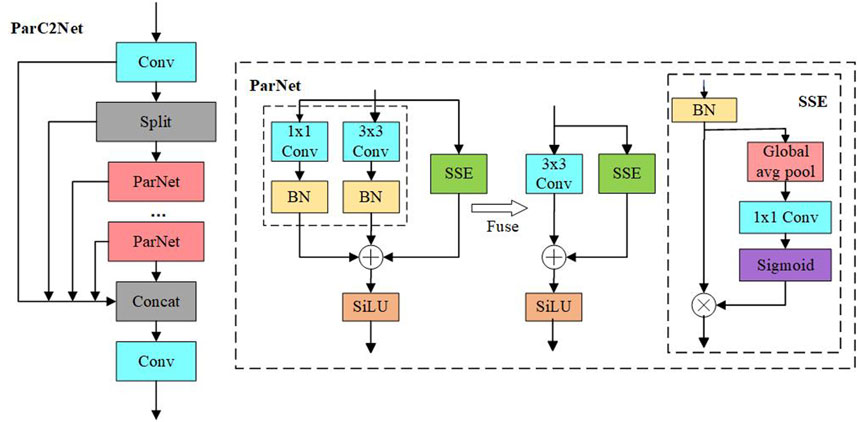
Figure 3. ParC2Net network structure. The deep network is built by stacking ParNet Bottleneck modules, and the key features are strengthened with the SSE attention mechanism.
3.3 Neck
The neck is the feature pyramid network (FPN), which is responsible for fusing multiscale features from the backbone [33]. By constructing a multiscale feature representation structure, the FPN effectively improves the algorithm’s detection performance for objects of different sizes and the model’s ability to understand semantic information in complex scenes. However, there are some limitations in the transmission of the one-way information flow of the FPN. To improve the chemical detection ability for dense small target defects in steel, such as cracks and punching, we used RepGFPN [34] to fuse and transmit defect information.
Compared with the traditional FPN structure, the multiscale features of RepGFPN are fused in the two levels of the previous layer and the current layer, which can fully exchange high-level semantic information and low-level spatial information. More importantly, the jump connection of the residual layer provides more efficient information transmission, which can transfer shallow information to deeper structural layers, The architectural details of this process can be clearly seen in Figure 4, which illustrates how RepGFPN optimizes information flow and feature fusion. In the feature fusion process of the neck, the number of channels in different dimensions corresponding to the feature maps of different sizes is set. By flexibly controlling the number of channels at different scales, higher precision can be achieved by sharing the same channel of all sizes. In the feature fusion module, the CSP stage is used to replace the original feature fusion based on 3x3 convolution. Next, the CSP stage is connected by integrating the heavy parameterization mechanism and the efficient layer aggregation network (ELAN), which achieves higher accuracy without imposing a large additional computational burden. Because small steel targets are usually small in size, subtle in detail, and susceptible to background interference, RepGFPN improves the capture and differentiation of small target features through better feature aggregation capabilities, improving the accuracy of small target detection. Because RepConv uses structural reparameterization, three branches are used for training, and three branches are fused for inference, greatly reducing the inference time. In real-time scenarios, RepGFPN not only achieves efficient frame rates but also improves detection performance, which is particularly important in industrial inspection environments, especially when it is necessary to accurately detect small, fast-moving targets on the production line.
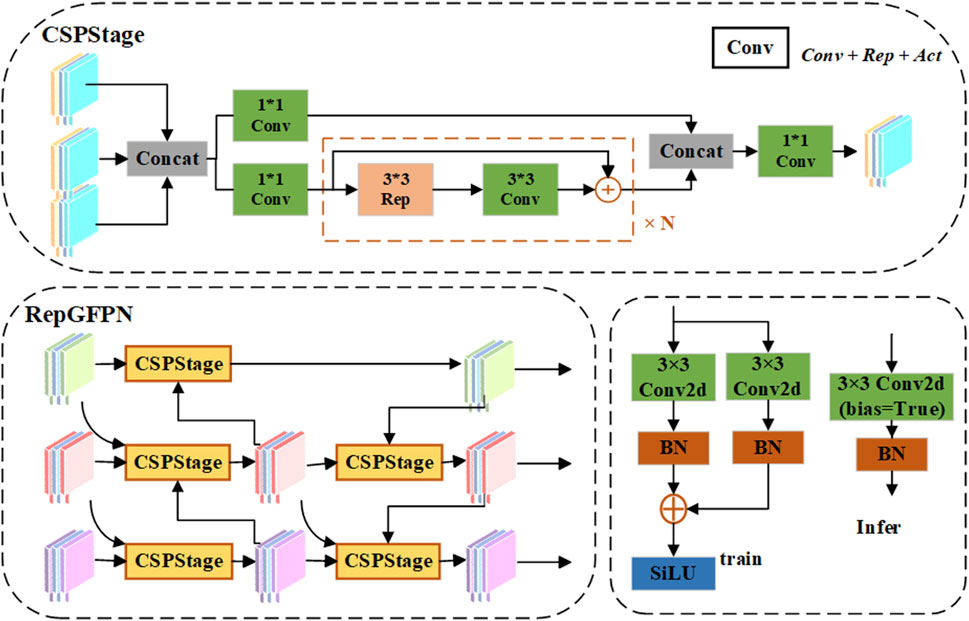
Figure 4. RepGFPN structure diagram. The feature information extracted from the backbone network is input to CSPStage, which includes branch, fusion and convolution operations. The Rep module implements the basic RepBlock in the RepVGG and includes training and deployment states.
3.4 Head
The head is responsible for generating target detection results based on the fused feature map. The head of YOLOv8 consists of multiple output layers, each of which is responsible for detecting objects of different sizes. Due to the low accuracy of defect recognition with small and inconspicuous features, it is necessary to replace the detection head with a more suitable head on a dataset rich in small defects. The RexSE-Head head proposed in this paper improves the detection ability of the model for dense and small targets, especially in scenes where precise capture of microdefects, such as the surface of chemical special steel, is needed.
The core of the RexSE-Head detection head architecture is that the head structure incorporates the ResNeXt [35] and squeeze-and-excitation (SE) attention mechanisms [36]. The specific structure is shown in Figure 5. First, ResNeXt increases the number and width of parallel paths in the network through packet convolution, which improves the parallel processing capability of the detection head and reduces the consumption of computing resources while maintaining high precision. Second, the SE module weights the channel features after each residual block, generates the attention weights of each channel by global average pooling of the feature map, and then learns and adjusts these weights using a two-layer fully connected network. In this way, the model can dynamically adjust the channel contribution degree of the feature graph according to the importance of different parts of the input data, which is conducive to strengthening the attention given to the subtle characteristics of chemical special steel defects and improving the detection performance.
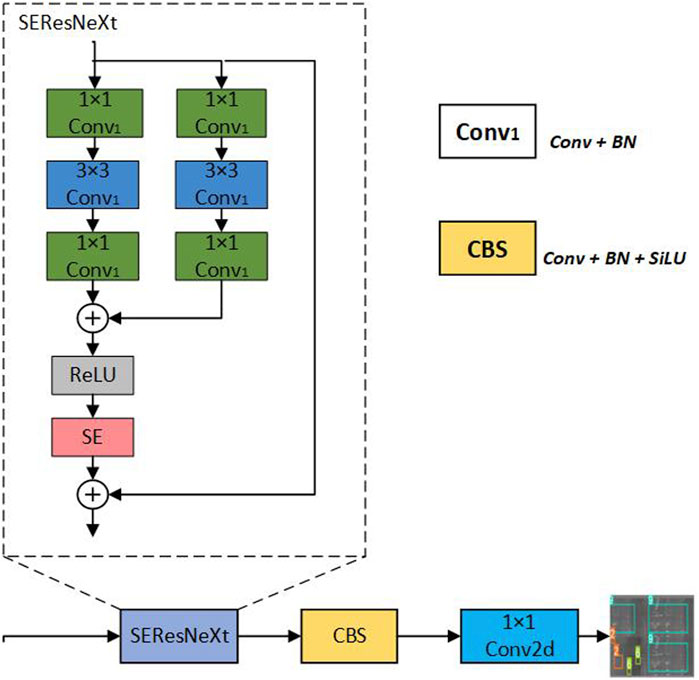
Figure 5. RexSE-Head network structure. RexSE-Head is a detection head that is specially designed for chemical special steel defect detection models. RexSE-Head integrates the above ResNeXt bottleneck layer structure with the SE module to improve the network’s ability to learn the interactive information between channels to improve the model performance.
3.5 Loss function
The loss function is the core of model training, which quantifies the difference between the predicted output of the model and the actual label, and guides the optimization direction of the model parameters. Specifically, we use a loss function that takes into account a number of key aspects, and its overall framework is defined by Equation 1:
Among them,
Confidence loss (
ification loss (
In the regression loss (
Among them, (
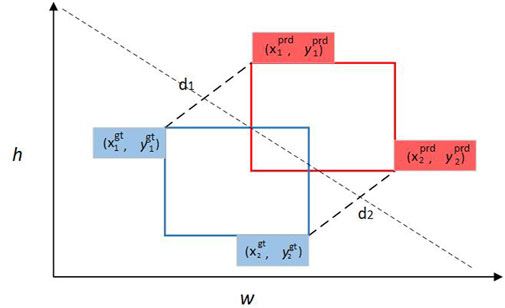
Figure 6. Border box crossover ratio -MPDIou.
Compared to the standard IoU, MPDIOU is unique in its mathematical form of non-monotonic focusing, which not only takes into account the measurement of overlapping regions, but also dynamically emphasizes the importance of differences between bounding boxes of different sizes and shapes through the introduction of distance terms. This design allows the loss function to pay more attention to the difficult-to-classify bounding boxes (especially the low-quality target boxes, such as extreme tilt or partial occlusion) during the training process, and effectively alleviates the overfitting problem through a non-uniform loss allocation strategy. Specifically, when the prediction box deviates greatly from the actual box, the
4 Experimental results and analysis
4.1 Experimental dataset
In order to ensure the rigor and reliability of the experimental results, the public dataset GC-DET10 was selected as the benchmark for defect detection of chemical special steels. The dataset contains more than 6,500 images, covering a wide range of defect sizes and balanced number of categories, from tiny defects of less than 1 mm to more obvious damages, while also considering the orientation and orientation of different defects to ensure the diversity of the dataset. The images cover ten common micro-defect types, including Punching (Pu), Weld Line (Wl), Crescent-shaped Gap (Cg), Water Spot (Ws), Oil Stain (Os), Striae (Ss), Inclusions (In), Rolling Pits (Rp), Crease (Cr), and Waist Fold (Wf). It is worth noting that the shape, size and distribution location of defects in the dataset are different, which puts forward high requirements for defect detection algorithms, which need to have excellent generalization ability and robustness to effectively cope with the complex changes of defects under actual working conditions.
In addition, considering the complex lighting conditions that may be encountered in the actual production environment and to further enhance the robustness of the model, we used a variety of data augmentation techniques during the training process. These techniques include, but are not limited to, random rotation, flipping, color dithering, brightness adjustment, and scale shifts to simulate the changes that may be encountered in a real-world production environment. These measures help the model better understand the nature of defect features and maintain high detection accuracy even on unseen samples.
The dataset is scientifically divided into a training set, a validation set, and a test set, with a ratio of 8:1:1, which ensures the rationality of model training, adjustment, and evaluation. Figure 7 visualizes example images of the multiple defect types in the dataset.
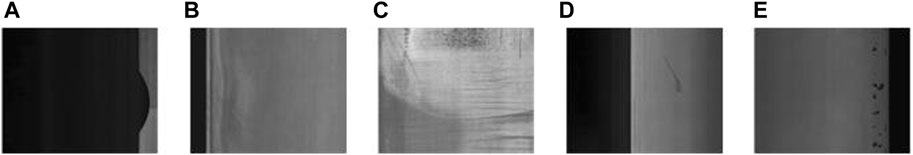
Figure 7. Partial types of defects in the dataset: (A) half-moon defect, (B) inclusions, (C) wear defect, (D) scratch defect, and (E) pitting defect.
4.2 Experimental setup
This study relies on a deep learning environment based on a cloud server, with Linux operating system, RTX A6000 GPU, and 51 GB of video memory. The deep learning framework used is Pytorch 2.0, the coding environment runs on Ubuntu 18.04, uses Python 3.10, and uses CUDA version 11.3.
Refer to the official guide of YOLOv8 for the experimental setup, and adopt the free anchor strategy. Table 1 shows the specific parameters.
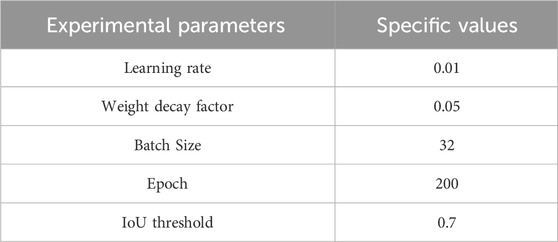
Table 1. Experimental parameter settings.
For the training strategy, we set the initial learning rate to be 0.01, the weight attenuation coefficient to be 0.05, the maximum number of iterations to be 32, and the intersection and union threshold (IoU) to be 0.7. The training process is extended to 200 iterations, and the system automatically performs performance evaluation on the validation set for each epoch learned, so as to continuously monitor the progress of the model and guide the optimization path.
At the same time, in order to ensure the reliability of the training results and effectively reduce the potential bias caused by the randomness of a single experiment, we adopted the following strategies: firstly, the dataset was randomly divided multiple times to generate multiple independent training/validation set combinations; Subsequently, for each division, a complete experimental process and evaluation are rigorously implemented. Finally, the evaluation indicators obtained from each experiment were summarized, and the average value was calculated to obtain a more robust and representative final evaluation result, so as to significantly improve the credibility of data evaluation.
4.3 Evaluation metrics
In this article, two key metrics are used to measure model performance: detection accuracy and model size. A number of criteria are used to evaluate detection accuracy, including Recall (R), Precision (P), Average Precision (AP), and mean Average Precision (mAP). Among them, the recall rate reflects the ratio of the identified target to the actual total, The specific mathematical expression is shown in Equation 8:
Here, TP refers to the number of positive samples that are correctly identified (true positives), while FN means the number of positive samples that are not detected (false negatives).
Precision measures the accuracy of a positive sample in a test result and is calculated as shown in Equation 9:
TP is still a true positive, while FP is a negative sample that has been incorrectly classified as a positive sample (false positive).
Average precision (AP) is a comprehensive measure of accuracy at different recall levels, which is obtained by integrating the accuracy within the recall interval, as shown in Equation 10:
where P(R) represents the precision of a particular recall level R and dR represents the increment of the recall rate. The process involves determining precision and recall one by one at multiple confidence thresholds, then plotting an accuracy-recall curve and comprehensively evaluating model performance by integrating the region below the curve.
mAP further expands the concept of AP by calculating the arithmetic average of AP values across all classes, ensuring consistency of performance across classes and the validity of the overall evaluation, It is calculated as shown in Equation 11:
Here, N stands for the number of categories, emphasizing consistency and overall effectiveness of performance across categories.
F-Score is a commonly used performance metric for detection models, which is designed to combine precision and recall metrics. Provide a score that balances the performance of both. It is calculated as shown in Equation 12:
Here, Precision and Recall represent the accuracy of predicting as positive examples and the ability of the model to capture all positive examples, respectively. The F-Score is placed between 0 and 1, and the closer the value is to 1, the better the overall performance of the model.
In addition to evaluating detection accuracy, this paper examines a number of key performance and efficiency metrics such as model size, computational requirements (as measured by Flops), and frame processing speed (Fps). These multiple evaluation dimensions provide valuable insight into the complexity of the model, its computational burden, and its ability to make real-time inferences. In the experimental section of this paper, the methods adopted and the results obtained are described, and the indicators of the model are analyzed and verified.
4.4 Test results analysis
4.4.1 Model training
During model training, the convergence speed of the loss function slightly represents the performance of the model. We compare the loss function fitting between PRS-YOLOv8 and YOLOv8, and the comparison curves of the two models are shown in Figure 8. With an increase in the number of training iterations, the training curve of the PRS-YOLOv8n model is relatively smooth and can converge to a lower loss level at a faster rate with the same number of iterations. When the loss function value does not change, the training ends, and the loss value of the PRSYOLOv8n model is lower than that of the YOLOv8 model. This finding indicates that the improved model in this paper has better performance than the original model and can more accurately locate and identify target defects.
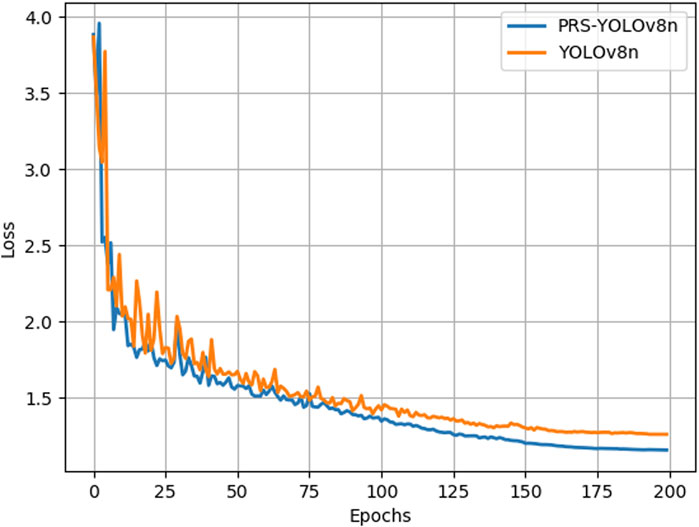
Figure 8. Line chart of training loss of PRS-YOLOv8n and YOLOv8n models.
In order to compare the performance of the model before and after the improvement more clearly, we observed the change trend of Precision, bUFQQDAuNQ==, Recall, and bUFQQDAuOTU= performance indicators with the progress of the training epoch in real time. As shown in Figure 9, the PRS-YOLOv8n has increased accuracy and recall, meaning that it is both accurate and broadly covered when identifying targets, avoiding missed detections. In addition, the significant improvement of the model on mAP, whether it is within the IoU threshold of 0.5 or the range of 0.5–0.95, confirms that the model can still maintain excellent detection effect under the diverse matching rigor, highlighting the strong adaptability of the model to scenarios with different accuracy requirements, especially in the early and middle stages of the training cycle, and the superiority of PRS-YOLOv8n is more prominent.
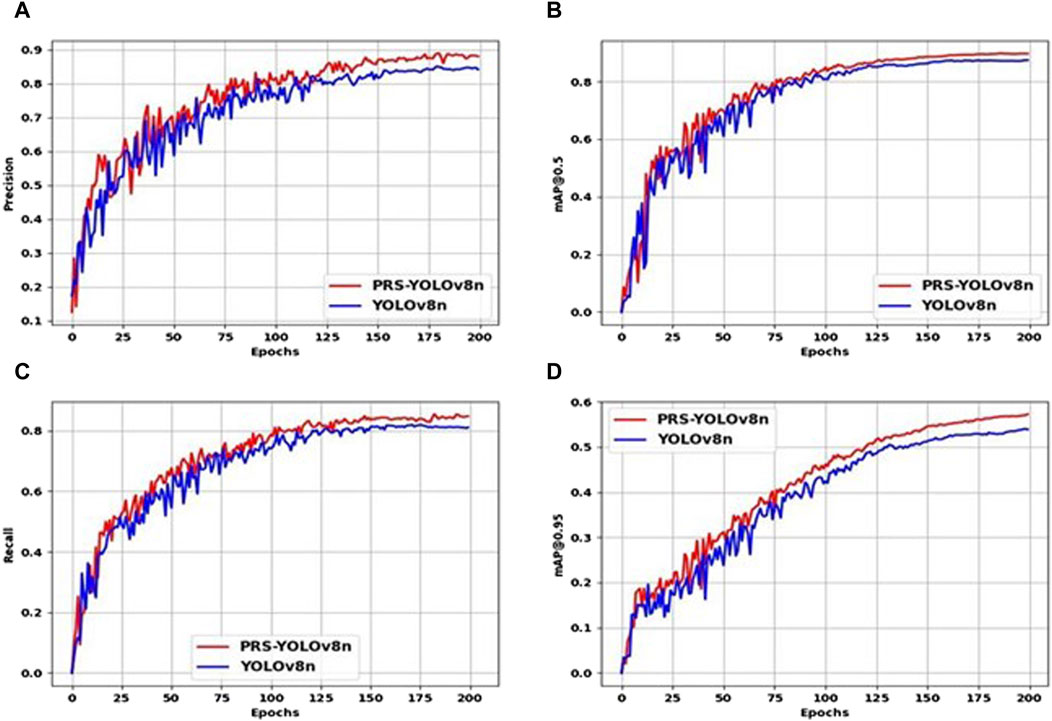
Figure 9. Comparison chart of the real-time performance of YOLOv8n and PRS-YOLOv8 training. (A) Precision comparison chart. (B) bUFQQDAuNQ== Comparison chart. (C) Recall comparison chart. (D) Comparative chart bUFQQDAuOTU=.
In general, the improved YOLOv8n detection model in this paper has high accuracy and good detection performance, which can better meet the application requirements of chemical special steel defect detection.
4.4.2 Detection effect of different defects
To verify the ability of the model to detect ten common minor defects in chemical special steel, the performances of the YOLOv8 model and PRSYOLOv8 model were evaluated in terms of the bUFQQDAuNQ==, precision, bUFQQDAuOTU=, and recall. A comparison of the performances of the two models is shown in Figure 10.
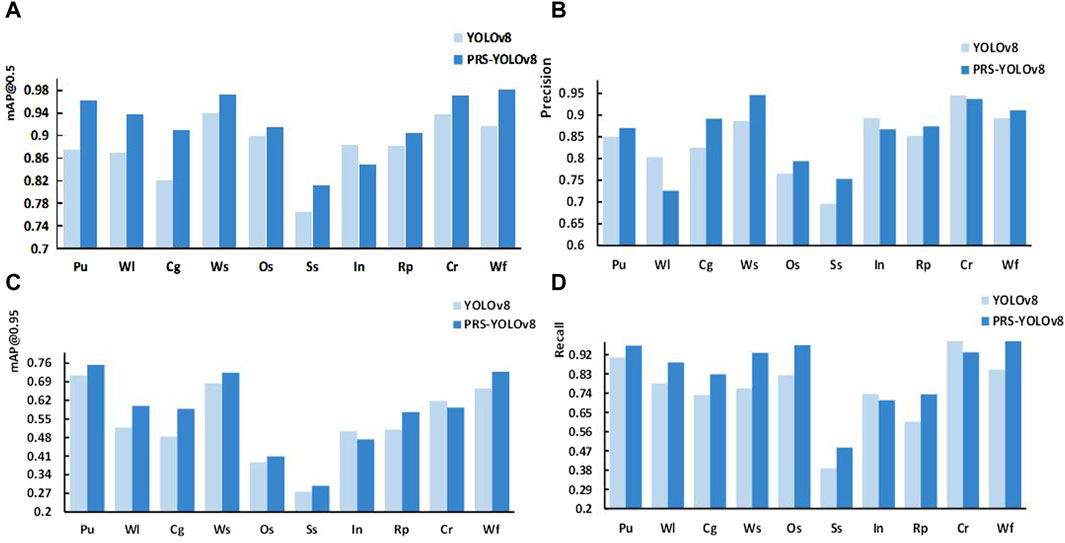
Figure 10. Comparison of the detection results for different types of defects between YOLOv8 and PRS-YOLOv8: (A) comparison chart of bUFQQDAuNQ==, (B) precision comparison chart, (C) bUFQQDAuOTU= precision chart, and (D) recall comparison chart.
Experiments show that compared with the YOLOv8 model, PRS-YOLOv8 can significantly improve the precision and recall of punching, crescent-shaped gap, water spot, waist fold, and other small target defects. This finding indicates that the PRS-YOLOv8 model has greater localization and recognition ability for small target defects in chemical special steel. When dealing with defect categories with high texture similarity, such as Oil Stain and Striae, the model shows a significant improvement in detection accuracy, which strongly proves that it has stronger resolution and accuracy in the recognition and classification of defects of the same nature. This improvement not only improves the accuracy of the detection algorithm, but also demonstrates the excellent performance of the model in complex texture recognition and fine classification.
4.4.3 Ablation experiment
To verify the validity of each component of the proposed method, corresponding ablation experiments are performed on each branch in this paper. The experimental results are shown in Table 1, among which ParC2Net represents the designed parallel architecture, RepGFPN represents the feature pyramid network used by the neck, and RexSE-Head represents the designed detection head mechanism. The baseline network model that was adopted is the YOLOv8n network.
Table 2 shows that the proposed method significantly improves the detection performance when it gradually introduces the ParC2Net, RepGFPN, and RexSE-Head structures. Compared with that of YOLOv8n, the precision of ParC2Net increases by 3.7%, indicating that the parallel flow design of this structure can improve the backbone network’s ability to extract minor defect information by 1.2% bUFQQDAuNQ==% and 2.1% bUFQQDAuOTU=. This finding indicates that the average precision of the model increased under different IoU thresholds, especially the high threshold, confirming that ParC2Net can improve the model’s ability to identify and locate small targets by increasing attention to important features. Second, when the RepGFPN module is introduced, the recall rate is increased by 3.1%, and the precision is increased by 1.9%, which indicate that the deep fusion of semantic information can effectively reduce the probability of missing small and medium defects of chemical special steel and has a positive effect on improving the identification accuracy of the detection model. The application of the RexSE-Head detection head achieved a performance improvement with an accuracy of 1.2% and a recall rate of 2.3%, which highlighted the ability of the algorithm to efficiently capture targets of different scales, especially small defects, and confirmed that by widening the parallel path and adjusting the weight of the output feature channel, the algorithm can effectively improve the accuracy of locating and classifying defects. Combining the two indices bUFQQDAuNQ== and bUFQQDAuOTU=, the three modules increase bUFQQDAuNQ== by 1.2%, 1.7%, and 0.9% and bUFQQDAuOTU= by 2.1%, 2.2%, and 1.1%, which proves the effectiveness of these components once again.
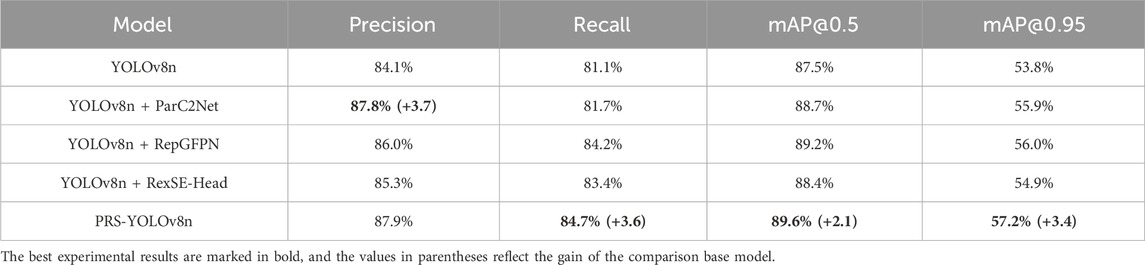
Table 2. Results of the ablation experiment.
To further understand how these components affect model performance, we used Grad-CAM technology to visualize the key areas of focus of the model. Figure 11 shows the Grad-CAM heat map, where the red areas indicate the parts of the model that are of focus when performing small defect detection. From these heat maps, we can observe how ParC2Net, RepGFPN, and RexSE-Head work together to guide the model to focus on those feature regions that are critical for small object detection.
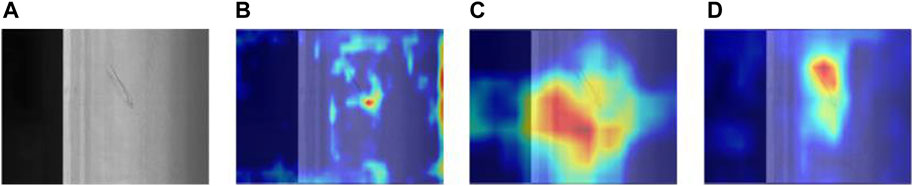
Figure 11. The area of focus for each component when detecting small defects. (A) Original image of steel Striae. (B) Feature heat map using ParC2Net. (C) Characteristic heat map using RepGFPN. (D) Feature heat map using RexSE-Head.
From these heat maps, it can be seen that the ParC2Net structure can effectively capture the subtle features around the defect, the RepGFPN module helps the model understand the global context of the defect, and the RexSE-Head strengthens the model’s ability to identify the key features of the defect. These heat maps provide visual evidence of the important role these three components play in improving small defect detection performance.
4.4.4 Comparative test
To evaluate the defect detection performance, the PRS-YOLOv8 algorithm is compared with five target detection algorithms: SSD, YOLOv5, YOLOXs, DETR, and Faster R-CNN. To verify the superiority of the model from multiple angles, the experiment adopts three model sizes of n, s, and m for comparison. Standard evaluation indices such as parameter number, average accuracy (mAP), recall, and FPS were selected to comprehensively evaluate the performance of different algorithms in chemical steel defect detection. The hardware facilities and datasets used were consistent. The final experimental results are shown in Table 3.
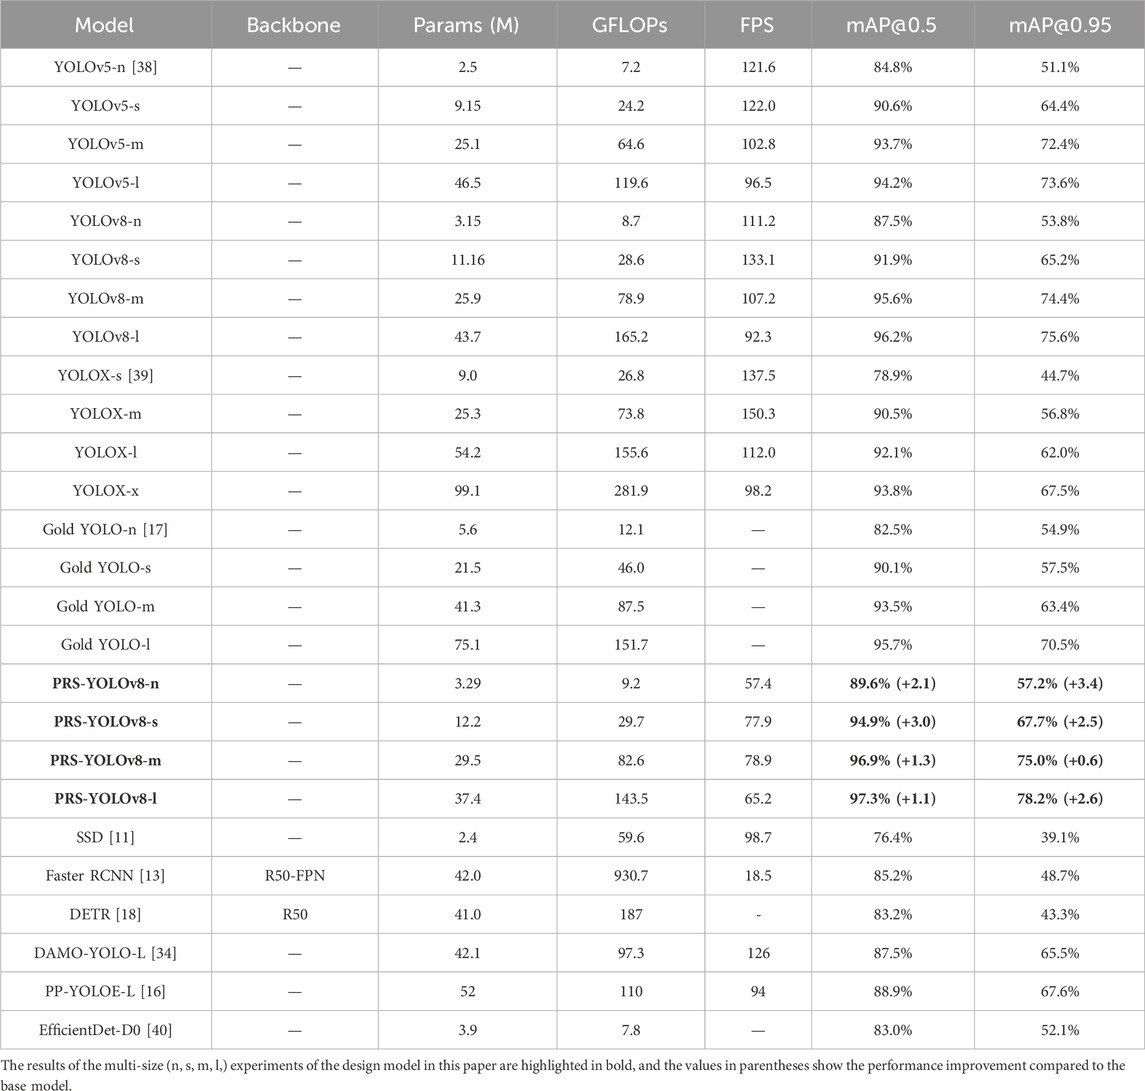
Table 3. Comparative experimental results.
The experimental data show that compared with common target detection algorithms, the PRS-YOLOv8 model has distinct advantages in defect detection for chemical special steel. First, compared with that of YOLOv8n, the parameter number of PRS-YOLOv8n increased by only approximately 0.14 M, but the index of bUFQQDAuNQ== increased by 2.1%. Notably, when the IoU threshold is 0.95, the mAP increases by 3.4%. This finding indicates that the improved model not only achieves higher detection accuracy with a small number of parameters but also greatly improves the detection and positioning accuracy of small objects.
Secondly, as shown in Figure 12, in the horizontal comparison of various size models, the PRS-YOLOv8 series designed by us surpasses the basic YOLOv8 model in the n, s, m, and l versions, demonstrating better mAP performance. Although PRS-YOLOv8 has made some concessions in terms of operating speed (FPS), it still has a significant advantage in competition with traditional algorithms such as Faster R-CNN, and has achieved significant growth in the high-precision standards, namely, bUFQQDAuNQ== and bUFQQDAuOTU=, which highlights the deep optimization of detection accuracy by PRS-YOLOv8 while maintaining efficient inference rates. In order to further verify the advantages of the PRS-YOLOv8 model over other advanced object detection algorithms, we compare it with recent algorithms designed for small object detection, including Gold YOLO [17], EfficientDet-D0 [40], and the latest DAMO-YOLO-L [34] and PP-YOLOE-L [16] models. A relatively low computational complexity (measured in GFLOPs) is maintained. This means that PRS-YOLOv8 can achieve better detection results with lower resource overhead in actual deployment scenarios, which undoubtedly lays a solid foundation for its application in resource-constrained environments, and fully reflects the excellent design of the model in terms of balance between efficiency and accuracy.
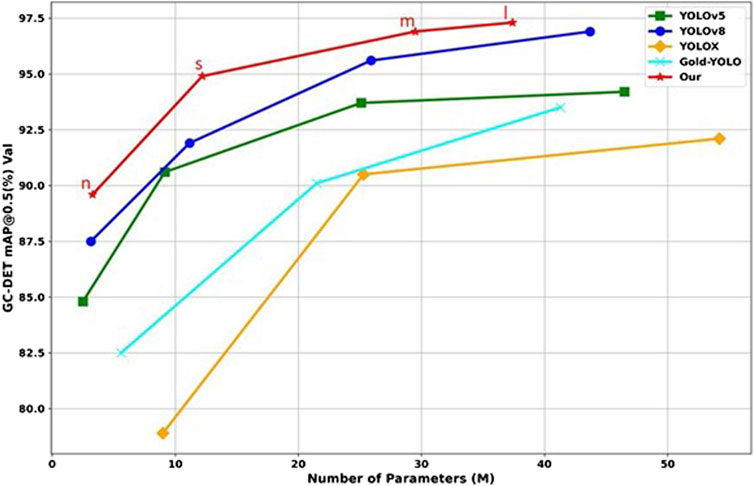
Figure 12. This article compares the model with the most advanced real-time object detectors.
In summary, the PRS-YOLO model has shown strong competitiveness and wide application potential in defect detection of chemical special steel products from the perspective of detection accuracy, computational complexity, and real-time performance.
4.4.5 Visual result analysis
In this study, a heat map was utilized to visualize the results of defect detection. By observing the highlighted areas in the heat map, you can visually assess the detection capability of the model and the accuracy of target positioning. The experimental results are shown in Figure 13.
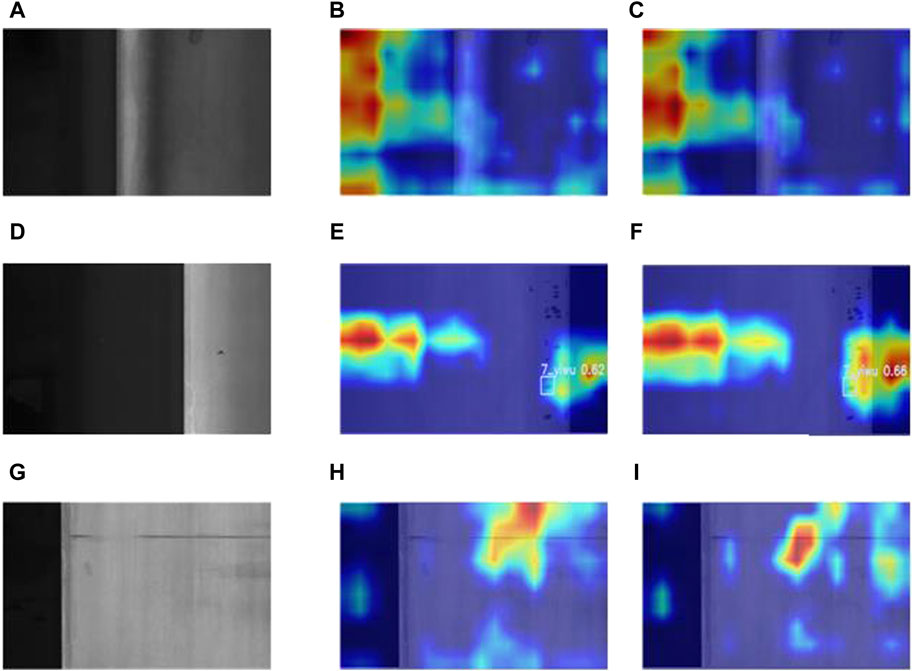
Figure 13. Thermal maps of some defect types in the dataset: (A) raw image of a steel oil spot,(B) heatmap of steel oil spot in YOLOv8, (C) heatmap of steel oil spots in PRS-YOLOv8, (D)original image of pitting defects, (E) thermal map of the pitted defect of the YOLOv8 model, (F) thermal map of pitted defects in PRS-YOLO, (G) raw image of steel inclusions, (H) thermal map of steel inclusions in YOLOv8, and (I) thermal map of steel inclusions in PRS-YOLOv8.
According to a comparison of the defect heatmaps of the YOLOv8 model and the PRSYOLOv8 model in Figure 13, the PRS-YOLOv8 model shows more obvious attention to the defect target. In addition, the comparison results demonstrate the accurate location and identification of the defect object. This finding shows that the PRS-YOLOv8 model effectively captures the key features of the special steel defect detection task, thus achieving accurate boundary box prediction.
4.4.6 Test results
The purpose of this experiment is to comprehensively evaluate the performance of the PRS-YOLOv8 model on the test dataset, with special attention to its ability to identify different defect categories, including but not limited to punching, scratching, half-moon defects, etc. (see Figure 14). In order to ensure the fairness and comprehensiveness of the evaluation, the test dataset used in this paper is consistent, and the test dataset covers a variety of defect types, different sizes, complexities, and diverse background environments, aiming to simulate real industrial application scenarios and ensure the diversity and representativeness of the dataset. In this way, we validated the model’s ability to detect not only pervasive defects, but also its accuracy in distinguishing highly similar defects (e.g., the missed detection problem of Inclusions, and the high false detection rate between Crescent-shaped Gap and Striae).
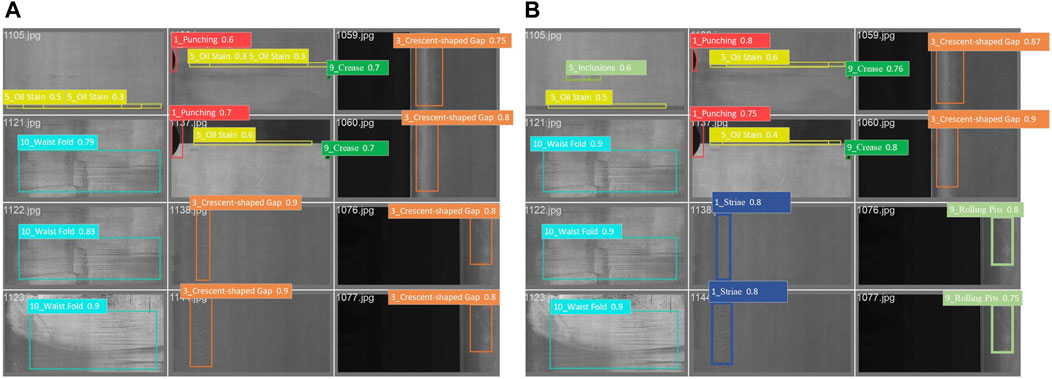
Figure 14. Comparison of test results: (A) YOLOv8 defect detection diagram and (B) PRS-YOLOv8 defect detection diagram.
YOLOv8 encounters several challenges in the defect detection task of chemical special steels, especially when it comes to identifying defects containing inclusions, and it is easy to be confused in distinguishing defects with similar shapes (such as crescent-shaped gaps and stripes), revealing its limitations in dealing with defect categories with similar features. In contrast, the PRS-YOLOv8 model has significantly improved these problems through a series of innovative designs, not only greatly reducing the occurrence of missed and false detection events, but also showing excellent recognition accuracy when dealing with defect types that are difficult to accurately identify by YOLOv8. In addition, the PRS-YOLOv8 exhibits higher precision and positioning accuracy in the detection of all defect types, which greatly enhances the reliability and efficiency of the inspection results.
Overall, PRS-YOLOv8 has achieved significant progress in the field of defect detection compared to YOLOv8, showing stronger performance and accuracy both in small defect identification problems and in conventional defect detection.
4.4.7 Application deployment
In order to ensure the robustness and reliability of the PRS-YOLOv8 model in an actual industrial inspection system, we discuss several key factors in the model integration process, including hardware compatibility and strategies for handling changes in production line image acquisition conditions.
In real-world deployments, the hardware compatibility of the model is critical. Given the small number of parameters (only 3.29M) of the PRS-YOLOv8 model, this makes it easy to deploy on embedded devices such as industrial cameras and edge computing units. We chose a computing platform that supports the ARM architecture, ensuring that the model can run on a low-cost, low-power device while maintaining real-time processing power.
On the production line, changes in lighting conditions, camera position, and other factors can have an impact on inspection results. In order to alleviate the influence of these factors, we use adaptive histogram equalization technology to dynamically optimize the image contrast in image preprocessing, so as to improve the model’s perception of the target defect area. This strategy effectively enhances the robustness of the model in complex environments, ensuring stable detection performance even under changing conditions.
5 Conclusion
In order to solve the problem that it is difficult to detect multi-category micro defects in chemical special steels, an enhanced YOLOv8 network architecture is proposed: PRS-YOLOv8. By introducing the adaptive histogram equalization technology, the algorithm dynamically optimizes the image contrast and improves the model’s perception of the target defect area. The application of MPD-IOU loss function solves the problem of overfitting low-quality bounding boxes and improves the robustness of the model in complex scenarios. In addition, the addition of the ParC2Net module, the RepGFPN structure, and the RexSE-Head detection head effectively enhance the situational understanding and detection accuracy of the model, especially the capture of subtle features.
The experimental results show that compared with the most advanced small target detection algorithms Gold YOLO and EfficientDet-D0, PRS-YOLOv8 has excellent performance in small defect detection, with a score of bUFQQDAuNQ== as high as 93.5%, which significantly reduces the rate of missed detection and false alarm. In addition, the number of parameters of the model is only 3.29 MB, which is very suitable for resource-constrained real-time application scenarios. However, the proposed method still has some limitations. Specifically, there is room for improvement in narrow defect detection, and the model’s ability to generalize on unseen data or under different lighting conditions may be limited. Future work will focus on enhancing the detection ability of narrow defects by introducing strategies such as attention mechanism and serpentine convolution, and improving the adaptability of the model to diverse scenarios through transfer learning and increasing training data.
In summary, PRS-YOLOv8 has several key advantages over existing methods, including enhanced small target detection capabilities, good robustness to complex scenarios, and high efficiency and scalability. These advantages make it a promising solution for practical applications, while its limitations point the way for subsequent research and development.
Data availability statement
The data analyzed in this study is subject to the following licenses/restrictions: Non-commercial. Requests to access these datasets should be directed to shaofeng yaneWFuc2hhb2Zlbmc4ODg4OEBnbWFpbC5jb20=.
Author contributions
YW: Resources, Writing–review and editing. SY: Conceptualization, Investigation, Methodology, Project administration, Software, Validation, Writing–original draft. HA: Data curation, Writing–original draft. SG: Funding acquisition, Writing–original draft. HZ: Funding acquisition, Writing–review and editing. XC: Investigation, Writing–original draft. HZ: Writing–review and editing, Supervision.
Funding
The author(s) declare that financial support was received for the research, authorship, and/or publication of this article. This work was supported by Ministry of Education Humanities and Social Science Research Project (No. 23YJAZH034), the Postgraduate Research and Practice Innovation Program of Jiangsu Province (No. SJCX24_2147, SJCX24_2148), Enterprise Collaboration Project (No. Z421A22349, Z421A22304, Z421A210045).
Acknowledgments
We thank the Ministry of Education Humanities and Social Science Research Fund, the Postgraduate Research and Practice Innovation Program of Jiangsu Province, Enterprise Collaboration Project for supporting this paper.
Conflict of interest
Author HZ was employed by Ltd. Huai'an.
The remaining authors declare that the research was conducted in the absence of any commercial or financial relationships that could be construed as a potential conflict of interest.
Publisher’s note
All claims expressed in this article are solely those of the authors and do not necessarily represent those of their affiliated organizations, or those of the publisher, the editors and the reviewers. Any product that may be evaluated in this article, or claim that may be made by its manufacturer, is not guaranteed or endorsed by the publisher.
References
1. Luo Q, Fang X, Liu L, Yang C, Sun Y. Automated visual defect detection for flat steel surface: © survey[J]. IEEE Trans Instrumentation Meas, 2020, 69(3): 626–44.doi:10.1109/tim.2019.2963555
2. Lin S, Ning S, Zhu H, Zhou T, Morris CL, Clayton S, et al. Neural network methods for radiation detectors and imaging. Front Phys (2023) 12: 1334298. doi:10.3389/fphy.2024.1334298
3. Duan J, Zhang H, Liu J, Gao M, Cheng C, Chen G. A dual-weighted polarization image fusion method based on quality assessment and attention mechanisms[J]. Front Phys, 2023, 11: 1214206, doi:10.3389/fphy.2023.1214206
4. Yang M, Lu S, Ding H, Chen J. Traffic safety assessment method of the immersed tunnel based on small target visual recognition image[J]. Front Phys, 2023, 11: 1159531, doi:10.3389/fphy.2023.1159531
5. Zhao W, Chen F, Huang H, Cheng W. A new steel defect detection algorithm based on deep learning[J]. Comput Intelligence Neurosci, 2021, 202:5592878–13.doi:10.1155/2021/5592878
6. He Y, Song K, Meng Q, Yan Y. An end-to-end steel surface defect detection approach via fusing multiple hierarchical features[J]. IEEE Trans instrumentation Meas, 2019, 69(4): 1493–504.doi:10.1109/tim.2019.2915404
7. Boikov A, Payor V, Savelev R, Kolesnikov A. Synthetic data generation for steel defect detection and classification using deep learning[J]. Symmetry, 2021, 13(7): 1176, doi:10.3390/sym13071176
8. Mordia R, Verma AK. Visual technique for defects detection in steel products: a comparative study[J]. Eng Fail Anal, 2022, 134: 106047. doi:10.1016/j.engfailanal.2022.106047
9. Liang F, Zhou Y, Chen X, Liu F, Zhang C, Wu X. Review of target detection technology based on deep learning[C]. In: Proceedings of the 5th international conference on control engineering and artificial intelligence (2021). p. 132–5.
10. Zuo Y, Wang J, Song J. Application of YOLO object detection network in weld surface defect detection[C]//2021 IEEE 11th annual international conference on CYBER technology in automation, control, and intelligent systems (CYBER). IEEE (2021). p. 704–10.
11. Yang L, Wang Z, Gao S. Pipeline magnetic flux leakage image detection algorithm based on multiscale SSD network[J]. IEEE Trans Ind Inform, 2019, 16(1): 501–9.doi:10.1109/tii.2019.2926283
12. Hu K, Shen C, Wang T, Xu K, Xia Q, Xia M, et al. Overview of temporal action detection based on deep learning[J]. Artif Intelligence Rev, 2024, 57(2): 26, doi:10.1007/s10462-023-10650-w
13. Yang Y, Sun Q, Zhang D, Shao L, Song X, Li X. Improved method based on Faster R-CNN network optimization for small target surface defects detection of aluminum profile[C]. In: 2021 IEEE 15th international conference on electronic measurement and instruments (ICEMI). IEEE (2021). p. 465–70.
14. Wang H, Li M, Wan Z. Rail surface defect detection based on improved Mask RCNN[J]. Comput Electr Eng, 2022, 102: 108269, doi:10.1016/j.compeleceng.2022.108269
15. Shi X, Zhou S, Tai Y, Wang J, Wu S, Liu J, et al. An improved faster R-CNN for steel surface defect detection[C]. In: 2022 IEEE 24th international workshop on multimedia signal processing (MMSP). IEEE (2022). p. 1–5.
16. Xu S, Wang X, Lv W, Chang Q, Cui C, Deng K, et al. PP-YOLOE: an evolved version of YOLO[J]. arXiv preprint arXiv:2203.16250, 2022. doi:10.48550/arXiv.2203.16250
17. Wang C, He W, Nie Y, Guo J, Liu C, Wang Y, et al. Gold-YOLO: efficient object detector via gather-and-distribute mechanism[J]. Adv Neural Inf Process Syst, 2024, 36.
18. Carion N, Massa F, Synnaeve G, Usunier N, Kirillov A, Zagoruyko S. End-to-end object detection with transformers[C]. In: European conference on computer vision. Cham: Springer International Publishing (2020). p. 213–29.
19. Wang Y, Wang H, Xin Z. Efficient detection model of steel strip surface defects based on YOLO-V7[J]. IEEE Access, 2022, 10: 133936–44.doi:10.1109/access.2022.3230894
20. Akhyar F, Lin CY, Muchtar K, Wu TY, Ng HF. High efficient single-stage steel surface defect detection[C]. In: 2019 16th IEEE international conference on advanced video and signal based surveillance (AVSS). IEEE (2019). p. 1–4.
21. Xia K, Lv Z, Zhou C, Gu G, Zhao Z, Liu K, et al. Mixed receptive fields augmented YOLO with multipath spatial pyramid pooling for steel surface defect detection[J]. Sensors, 2023, 23(11): 5114, doi:10.3390/s23115114
22. Kou X, Liu S, Cheng K, Qian Y. Development of a YOLO-V3-based model for detecting defects on steel strip surface[J]. Measurement, 2021, 182: 109454, doi:10.1016/j.measurement.2021.109454
23. Jiang L, Yuan B, Wang Y, Ma Y, Du J, Wang F, et al. MA-YOLO: a method for detecting surface defects of aluminum profiles with attention guidance[J]. IEEE Access, 11, 71269, 86.doi:10.1109/access.2023.32915982023
24. Iqbal I, Shahzad G, Rafiq N, Mustafa G, Ma J. Deep learning-based automated detection of human knee joint's synovial fluid from magnetic resonance images with transfer learning[J]. IET Image Process, 2020, 14(10): 1990–8.doi:10.1049/iet-ipr.2019.1646
25. Iqbal I, Odesanmi GA, Wang J, Liu L. Comparative investigation of learning algorithms for image classification with small dataset[J]. Appl Artif Intelligence, 2021, 35(10): 697–716.doi:10.1080/08839514.2021.1922841
26. Zhu J, Zhou D, Lu R, Liu X, Wan D. C2DEM-YOLO: improved YOLOv8 for defect detection of photovoltaic cell modules in electroluminescence image[J]. Nondestructive Test Eval, 2024: 1–23.doi:10.1080/10589759.2024.2319263
27. Wang S, Wang Y, Chang Y, Zhao R, She Y. EBSE-YOLO: high precision recognition algorithm for small target foreign object detection[J]. IEEE Access, 11, 57951, 64.doi:10.1109/access.2023.32840622023
28. Stark JA. Adaptive image contrast enhancement using generalizations of histogram equalization[J]. IEEE Trans Image Process, 2000, 9(5): 889–96.doi:10.1109/83.841534
29. Su P, Han H, Liu M, Yang T, Liu S. MOD-YOLO: rethinking the YOLO architecture at the level of feature information and applying it to crack detection[J]. Expert Syst Appl, 2024, 237: 121346, doi:10.1016/j.eswa.2023.121346
30. Hu K, Li Y, Zhang S, Wu J, Gong S, Jiang S, et al. FedMMD: a federated weighting algorithm considering non-IID and local model deviation[J]. Expert Syst Appl, 2024, 237:121463, doi:10.1016/j.eswa.2023.121463
31. Roy AG, Navab N, Wachinger C. Concurrent spatial and channel ‘squeeze and excitation’in fully convolutional networks[C]//Medical Image Computing and Computer Assisted Intervention–MICCAI 2018. In: 21st international conference, granada, Spain, september 16-20, 2018, proceedings, Part I. Springer International Publishing (2018). p. 421–9.
32. Hu K, Zhang E, Xia M, Wang H, Ye X, Lin H. Cross-dimensional feature attention aggregation network for cloud and snow recognition of high satellite images[J]. Neural Comput Appl, 36, 2024: 7779–98.doi:10.1007/s00521-024-09477-5
33. Xie Y, Hu W, Xie S, He L. Surface defect detection algorithm based on feature-enhanced YOLO. J Cogn Comput (2019) 15(2):565–79. doi:10.1007/s12559-022-10061-z
34. Xu X, Jiang Y, Chen W, Huang Y, Zhang Y, Sun X. Damo-yolo: a report on real-time object detection design[J]. arXiv preprint arXiv:2211.15444, 2022. doi:10.48550/arXiv.2211.15444
35. Xie S, Girshick R, Dollár P, Tu Z, He K. Aggregated residual transformations for deep neural networks[C]. In: Proceedings of the IEEE conference on computer vision and pattern recognition (2017). p. 1492–500.
36. Hou Q, Zhou D, Feng J. Coordinate attention for efficient mobile network design[C]. In: Proceedings of the IEEE/CVF conference on computer vision and pattern recognition (2021). p. 13713–22.
37. Siliang M, Yong X. Mpdiou: a loss for efficient and accurate bounding box regression. arXiv preprint arXiv:2307.07662 (2023). doi:10.48550/arXiv.2307.07662
38. Liu S, Qi L, Qin H, Shi J, Jia J. Path aggregation network for instance segmentation[C]. In: Proceedings of the IEEE conference on computer vision and pattern recognition (2018). p. 8759–68.
39. Ge Z, Liu S, Wang F, Li Z, Sun J. Yolox: exceeding yolo series in 2021[J] (2021). arXiv preprint arXiv:2107.08430.
Keywords: object detection algorithms1, steel defects 2, YOLOV83, ParC2Net4, small targets5
Citation: Wang Y, Yan S, Abdullahi HS, Gao S, Zhang H, Chen X and Zhao H (2024) Multiclass small target detection algorithm for surface defects of chemicals special steel. Front. Phys. 12:1451165. doi: 10.3389/fphy.2024.1451165
Received: 18 June 2024; Accepted: 12 August 2024;
Published: 30 August 2024.
Edited by:
Haoyu Chen, University of Oulu, FinlandReviewed by:
Haotian Liu, University of Oulu, FinlandImran Iqbal, New York University, United States
Copyright © 2024 Wang, Yan, Abdullahi, Gao, Zhang, Chen and Zhao. This is an open-access article distributed under the terms of the Creative Commons Attribution License (CC BY). The use, distribution or reproduction in other forums is permitted, provided the original author(s) and the copyright owner(s) are credited and that the original publication in this journal is cited, in accordance with accepted academic practice. No use, distribution or reproduction is permitted which does not comply with these terms.
*Correspondence: Yuanyuan Wang, emhmd3l5QGh5aXQuZWR1LmNu