- University of Minnesota Twin Cities, School of Physics and Astronomy, Minneapolis, MN, United States
Spin glasses are inherently dynamical. Taken properly, measurements of these materials can capture their dynamics and provide a wealth of insight into the physics of the spin glass state. In this methods review, two magnetometry methods are directly compared–ac and dc. Because these measurements are taken differently, the resulting data of each method will contain different information about spin glass behavior. This review will specifically focus on how the out-of-equilibrium effects of aging, rejuvenation, and memory manifest in each of these techniques, and how to construct protocols to measure these effects. We then describe the physical significance of each type of measurement and how to interpret their results. Finally, we explicitly detail which applications are most appropriate for which method. This will help the reader select the most helpful technique to carry out their own future experiments.
1 Introduction
Broadly speaking, spin glass magnetometry measurements come in two “flavors,” ac susceptibility, and dc magnetization. Due to the fact that spin glasses are out-of-equilibrium, it is crucial to understand how a prototypical ac and dc measurement differ from each other so that the dynamical behavior measured can be better understood. The purpose of this review is to provide insight for both types of measurements and when they are most appropriately used. This will be accomplished by introducing an ac protocol which exhibits the phenomena of aging, rejuvenation, and memory, and then briefly describing them. Analogous dc protocols will then be discussed.
Since the typical ac susceptibility measurement more easily lends itself to temperature sweeps than the typical dc measurement, this discussion will be framed from an ac perspective. The purpose of this review is to discuss spin glass magnetometry techniques, and so the focus will be on exemplifying the out-of-equilibrium dynamics seen in dc and ac experiments. Then, where it is necessary, we will point out how various pictures of spin glass behavior can be used to explain these observations.
Before introducing protocols with out-of-equilibrium effects, however, it is instructive to first show spin glass measurements without dynamics in both dc and ac settings. In a dc experiment, one can find the dynamical freezing temperature,
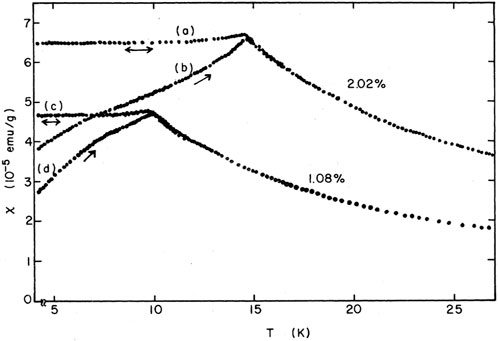
Figure 1. Field-cooled [(a) and (c)]/zero-field-cooled curves [(b) and (d)] as a function of temperature for 1.08 and 2.02 at% Mn. All measurements used an applied field of 5.90 Oe. This figure was reprinted with permission from [1].
In a FC protocol, the spin glass is always in the presence of a field. We now consider a temperature sweep from above to below the glass transition temperature,
A typical ac susceptibility measurement is shown in Figure 2. As the temperature is swept (typically from above to below the transition), the real part of the magnetic susceptibility,
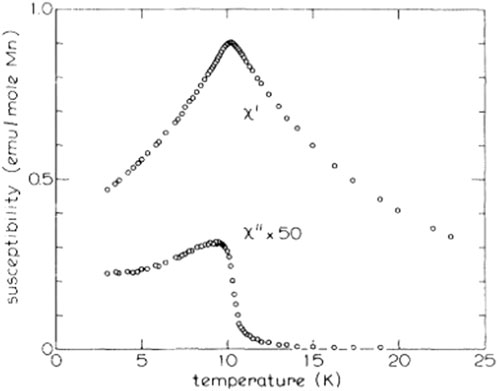
Figure 2. Real part of the ac susceptibility (top) and imaginary part of the ac susceptibility (bottom) as a function of temperature. The magnitude of the ac field is
Under the application of any magnetic field, spin glasses exhibit crossover behavior, known in theory as the de Almeida-Thouless line [5]. Experimentally, the effect of an applied magnetic field is clearly demonstrated by the experiments in [6, 7]. This means that any measured transition temperature will always be a freezing temperature and not the true glass temperature,
Now, we return to measuring the dynamical effects observed in spin glasses. Due to the fact spin glass measurements are very protocol-dependent, it is imperative to have a control protocol for comparison. In a prototypical ac measurement, the sample starts above
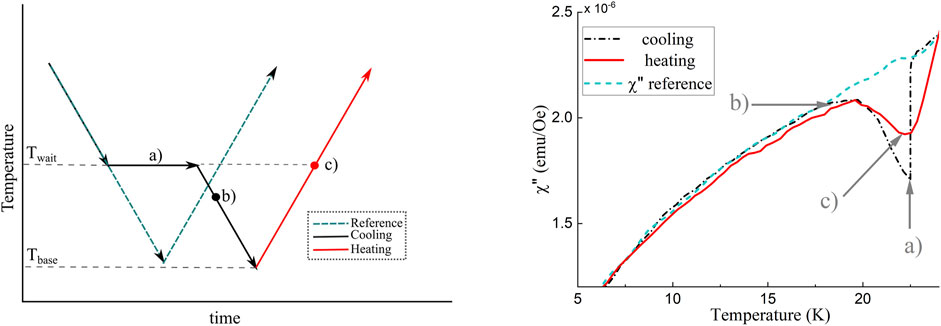
Figure 3. A simple waiting time protocol which exhibits aging, rejuvenation, and memory shown on the left and the resulting susceptibility shown on the right. The reference curve is shown as the dotted teal line in both cases. On both sides, the label a) corresponds to the aging, b) to rejuvenation, and c) to memory, which will be discussed later in this Review. This figure is adapted from [12].
2 Aging
A spin glass has a rugged energy landscape, meaning it possesses a large range of barrier heights corresponding to a wide range of relaxational timescales. Because the spin glass is seen to be dynamical on laboratory timescales, the barriers are expected to have a height that gives rise to experimentally confirmed timescales of at least up to weeks1.
The process of hopping over barriers will induce relaxation as the system reduces its energy in a process known as “aging”. If measured in a lab, this exploration manifests as a decrease in the magnetic susceptibility, which is then attributed to the growth of the spin glass order [13, 14]. Regardless of the mechanism used to describe this growth, the community generally agrees that it grows with time spent in the spin glass state, and that this growth is very slow [13, 15, 16].
Within both the Droplet [17] and Hierarchical [18] models, aging is associated with thermal activation processes whose energy barriers are determined by the spatial size of emerging spin glass order. The larger this length scale, the higher the energy barrier. The spin glass order grows from flipping spins, which thereby induces changes to the overall magnetization [15, 19–21].
2.1 Measurements
Aging is the most easily measurable quantity in both ac and dc experiments. In this subsection, these methods will be juxtaposed to highlight the uses of each technique. While the measurements themselves differ based on whether or not ac or dc methods are used, there is some overarching commonality. During aging protocols, the system is brought to a waiting temperature
2.1.1 Ac protocols
Once the reference measurement has been taken, we proceed to investigate the out-of-equilibrium effects. We begin the experiment in the same way, except instead of cooling at a continuous rate to the base temperature, cooling is stopped at an intermediate temperature, as shown by the label
In this part of the protocol, the ac susceptibility, defined as
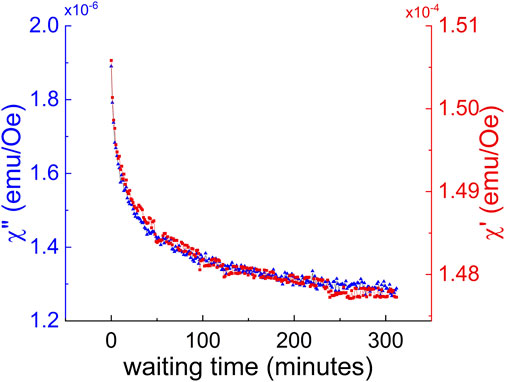
Figure 4. Aging as a function of time for both
By definition, ac susceptibility measurements are sensitive to the dynamic magnetic response of the system–that is, the measured signal is related to the number of spins responding to the ac field. In a spin glass, as the spin-glass-order grows (and more spins become frozen), the system becomes less responsive to the applied field. Thus, during an aging experiment, we measure the growth of the spin glass order through the decay of the magnetic fluctuations.
2.1.2 dc protocols
Measurements which utilize dc magnetometry, compared to the protocol shown in Figure 3, are most frequently taken only at a fixed temperature. A typical dc protocol has two parts–an aging portion and a measurement portion. The field can either start off, as is the case in zero -field-cooled (ZFC) measurements, or on, as is the case in thermoremanent magnetization (TRM). A schematic of these protocols is shown in Figure 5. The main difference between the two is when the field is applied: for a ZFC measurement, the applied magnetic field is held at
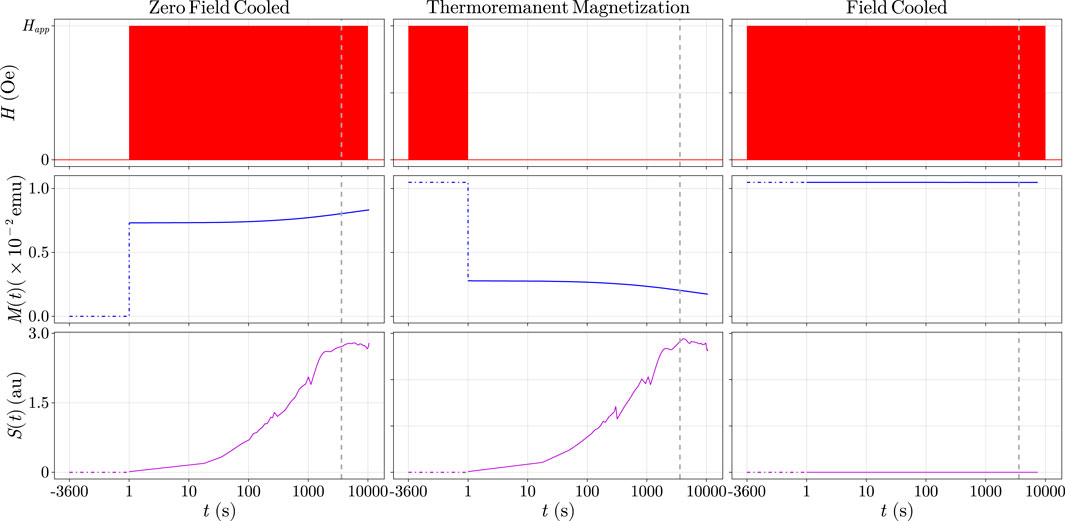
Figure 5. The three most common dc magnetization measurements are shown. In each protocol, an example set of data is plotted. From left to right columns, zero field cooled (ZFC), thermoremanent magnetization (TRM), and field cooled (FC). The top row indicates the external magnetic field applied as a function of time, the middle row is the magnetization as a function of time, and the bottom row is the resulting
There are other, more nuanced protocols, detailed in [22] which explore the effect on the spin glass order when a magnetic field is turned on in a variant of a TRM protocol (i.e., before or after settling at the waiting temperature). For readers who are interested in learning about the history of TRM measurements in the development of the field, [23] in this collection has a comprehensive overview. However, for brevity, these will not be discussed here.
To emphasize–dc measurements have two parts, and only the first is traditionally called “aging.” In Figure 5, this is denoted by the dot-dashed lines at negative times. However, when people discuss ac experiments, typically any time in the spin glass state is called aging. This is a subtle difference in naming conventions between the two sets of experiments which is not typically discussed.
To process dc magnetization data, the logarithmic derivative of the resulting magnetization is plotted as a function of time (traditionally on a log scale). This curve is known as
To illustrate this, we consider a TRM (ZFC) protocol. In the aging stage of the experiment, the waiting time determines the average barrier surmounted and thus the average size of a spin glass order. After aging, once the magnetic field is removed (applied), the spin glass begins to relax to zero (the FC value for the) magnetization. If the spin glass energy landscape is made up of a distribution of Arrhenius-like barriers, then the change in magnetization as a function of time will contain information about the distribution of energy barriers of the system. If this function is peaked, the peak position will be related to the most probable barrier in the distribution [24, 25].
We then can ask why the aging portion of the experiment causes a peak in the
3 Rejuvenation
Aging occurs when the sample stays below the transition temperature for some fixed amount of time, as shown in Figures 4, 5. Of all the spin glass phenomena, it is the best understood. Rejuvenation occurs as the temperature is changed (traditionally decreased) after an aging protocol. Remarkably, as is observed in both ac and dc experiments, after some sufficient temperature difference,
Rejuvenation can occur with either positive or negative temperature shifts, and has been studied, for example, in Refs. [4, 9]. While there are differences in how rejuvenation manifests, the re-initialization of the aging process is common to both positive and negative temperature shifts. However, this Review will focus on the overall protocol, rather than the specific results obtained in each case.
In the following subsections, we investigate how rejuvenation appears in experiments, and their implications. Additionally, we briefly mention one possible mechanism for rejuvenation and reference experiments and simulations which test this model.
3.1 Measurements
3.1.1 Ac protocols
After an aging process is completed at
In the case of a positive temperature shift (e.g., the temperature is raised following aging), it is traditionally more common to quench rather than heat continuously, as done in [9].
3.1.2 Dc protocols
From the description of aging using dc methods, it should be clear that it is difficult to develop dc protocols which study multi-temperature effects. Due to the fact that temperature sweeps in TRM or ZFC dc protocols face this challenge, there are generally two paths utilized2.
The first way to observe rejuvenation in dc measurements is using the FC magnetization and observing differences in decays over time, as done in [2,3]. This technique is similar to ac protocols, since for this type of experiment, there is no aging time before the measurement starts. In this case, the system is quenched to the first waiting temperature
The second way to observe rejuvenation in a dc protocol is to measure
If rejuvenation has occurred, the character of the resulting
Note that even if the aging is not cumulative, there tend to be long “tails” in the
It is important to note here that there is a major discrepancy seen between rejuvenation in ac and dc measurements. In ac measurements, rejuvenation appears in the susceptibility, whereas in dc measurements, rejuvenation appears in the character of
4 Memory
The final step in the experiment shown in Figure 3 is to raise the temperature from the base temperature back to its starting point (both chosen by the experimentalist). In the past, it was often the case that the heating rate differed from the cooling rate such as in [30]. While commonplace, it has been recently found that the relaxational dynamics markedly changes as a function of cooling rate [31], and therefore the most controlled experiments would be where all temperature changes occur at the same rate.
Like the protocols outlined for rejuvenation,
4.1 Measurements
4.1.1 Ac protocols
Following the canonical protocols described in Figures 2, 6, the temperature is increased from the base temperature at a constant rate. After the temperature rises beyond the aging temperature, the spin glass has an apparent memory of its previous cooling history. Since the ac susceptibility is related to the magnitude of magnetic fluctuations, a decrease in the susceptibility relative to the reference curve indicates that the spin glass is becoming more frozen relative to the reference curve as it approaches and surpasses the waiting temperature upon heating.
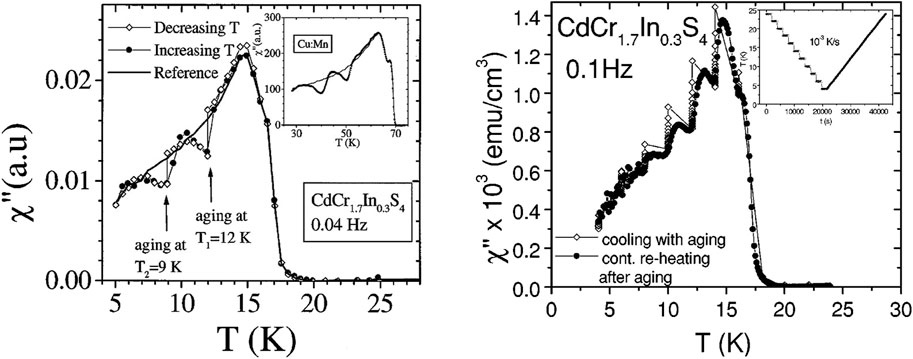
Figure 6. Left: the original memory experiment with two waiting temperatures (12 K and 9 K). Despite waiting at the low temperature for 40 h, the memory is still apparently perfect. The inset shows the reference (line) and heating (scatter) curves in the canonical spin glass, copper manganese. Right: A series of multiple aging steps upon cooling, leading to perfect memory upon continuous heating. The inset shows the temperature profile as a function of time. Both figures use the same insulating spin glass (although the ac frequencies are slightly different). The left figure is taken from [29] and the right figure is taken from [30].
A few remarkable examples of the memory effect is in Figure 6, where despite either the many temperature steps or an extremely long waiting time, memory is clearly retained upon heating. This is in contrast to the data shown in Figure 3 where, despite only aging for an hour, significant memory loss is seen. Across the literature, it can be seen that memory is often incomplete in metallic spin glasses [11, 32], but is often almost perfect in insulating spin glasses [29, 30].
4.1.2 Dc protocols
In a dc protocol investigating the memory effect, one completes a temperature cycling protocol. The first part of the experiment is the same as described in Section. 3.1.2. Now however, instead of simply turning on (or off) the field at the second temperature, the sample is aged again for
In this case, it becomes clear why dc experiments need a control protocol. The control measurement is just an isothermal aging experiment for
The double peak in the
The results of the ac and dc experiments, taken together, indicate that the spin glass order developed at the first waiting time somehow is preserved, despite rejuvenation. Since its discovery [29], there have been many studies which have investigated this effect such as Refs. [9, 11, 30, 32, 35–38] to name just a few. While the details differ, a common explanation centers around the following description: as the temperature increases again, the larger regions of spin glass order which were previously frozen-in at the lower temperatures “unfreeze” and become active once more [9, 11, 30, 36, 38].
5 Pros and cons of each technique
The essence of spin-glass magnetometry is that the out-of-equilibrium dynamics are characterized by a dependence on two timescales. In ac experiments, these timescales are the ac frequency and the waiting time as shown in Figure 3. In dc experiments, meanwhile, the two times are the waiting time and the measuring time. Their impacts are measured using a protocol that constructs an
In spin glass research, ac susceptibility is a better tool to measure the effect of changing temperatures. In dc measurements which produce
On the other hand, dc magnetometry is better suited to study aging than ac susceptibility. This is because much of the dynamics in dc measurements can be wrapped up in a single physically significant number –
5.1 Experimental considerations
There are a few experimental parameters which are important to discuss. In ac experiments, the ac frequency must be sufficiently low to ensure that the dynamical relaxational effects are still visible. However, because the time it takes to acquire a single data point increases as frequency decreases, the experimentalist must determine the lowest reasonable frequency within their own logistical constraints. The effect of ac frequency on resulting spin glass measurements is examined in another submission to this collection [39].
The results in [7, 22], and [40] show that the time it takes to turn the magnetic field on or off affect the
Likewise, both ac and dc experiments are affected by the fact that temperatures cannot change instantaneously, even when cooling at the fastest rate the instrument can. This also can act like another waiting time, as seen in [7, 22], and [31].
One final note: while the spin glass community at large treats ac and dc measurements as equivalent in the limit of zero frequency, this is hard to verify in practice because the types of experiments are typically conducted very differently from each other. As discussed in [31], there are large discrepancies between certain dc and ac results which indicate that the physics relating the two is not as straightforward as is typically assumed.
Author contributions
JF: Writing–original draft, Writing–review and editing. ED: Writing–review and editing.
Funding
The author(s) declare that financial support was received for the research, authorship, and/or publication of this article. This work was supported by the U.S. Department of Energy, Office of Basic Energy Sciences, Division of Materials Science and Engineering, under Award No. DE-SC0013599.
Acknowledgments
The authors thank the Editors for this collection, and especially to Greg Kenning for many helpful discussions. In addition, the authors appreciate discussions with Samaresh Guchait and Ray Orbach. Finally, the authors would like to thank W. Joe Meese for his help, especially during the writing of this manuscript.
Conflict of interest
The authors declare that the research was conducted in the absence of any commercial or financial relationships that could be construed as a potential conflict of interest.
Publisher’s note
All claims expressed in this article are solely those of the authors and do not necessarily represent those of their affiliated organizations, or those of the publisher, the editors and the reviewers. Any product that may be evaluated in this article, or claim that may be made by its manufacturer, is not guaranteed or endorsed by the publisher.
Footnotes
1The longest experiment we are aware of was an unpublished result from our group at the beginning of COVID-19 lockdown taken by David C. Harrison. Even after a month of continuous measurement, aging was still seen.
2It is possible to design a protocol in other ways, such as described by the simulations in [26], but this Review will focus on the most commonly utilized protocols.
References
1. Nagata S, Keesom PH, Harrison HR. Low-dc-field susceptibility of CuMn spin glass. Phys Rev B (1979) 19:1633–8. doi:10.1103/physrevb.19.1633
2. Zhai Q, Orbach RL, Schlagel DL. Evidence for temperature chaos in spin glasses. Phys Rev B (2022) 105:014434. doi:10.1103/physrevb.105.014434
3. Djurberg C, Jonason K, Nordblad P. Magnetic relaxation phenomena in a cumn spin glass. Eur Phys J B-Condensed Matter Complex Syst (1999) 10:15–21. doi:10.1007/s100510050824
4. Mulder CAM, van Duyneveldt AJ, Mydosh JA. Frequency and field dependence of the ac susceptibility of the AuMn spin-glass. Phys Rev B (1982) 25:515–8. doi:10.1103/physrevb.25.515
5. de Almeida JRL, Thouless DJ. Stability of the sherrington-kirkpatrick solution of a spin glass model. J Phys A: Math Gen (1978) 11(5):983–90. doi:10.1088/0305-4470/11/5/028
6. Mattsson J, Jonsson T, Nordblad P, Aruga Katori H, Ito A. No phase transition in a magnetic field in the ising spin glass fe0.5 mn0.5 tio3. Phys Rev Lett (1995) 74:4305–8. doi:10.1103/physrevlett.74.4305
7. Lefloch F, Hammann J, Ocio M, Vincent E. Spin glasses in a magnetic field: phase diagram and dynamics. Physica B: Condensed Matter (1994) 203(1):63–74. doi:10.1016/0921-4526(94)90278-x
8. Mulder CAM, van Duyneveldt AJ, Mydosh JA. Susceptibility of the CuMn spin-glass: frequency and field dependences. Phys Rev B (1981) 23:1384–96. doi:10.1103/physrevb.23.1384
9. Jönsson PE, Mathieu R, Nordblad P, Yoshino H, Aruga Katori H, Ito A. Nonequilibrium dynamics of spin glasses: examination of the ghost domain scenario. Phys Rev B (2004) 70:174402. doi:10.1103/physrevb.70.174402
10. Baity-Jesi M, Calore E, Cruz A, Fernandez LA, Gil-Narvion JM, Gonzalez-Adalid Pemartin I, et al. Temperature chaos is present in off-equilibrium spin-glass dynamics. Nat Commun Phys (2021) 4(1):74. doi:10.1038/s42005-021-00565-9
11. Freedberg J, Joe Meese W, He J, Schlagel DL, Dan Dahlberg E, Orbach RL. On the nature of memory and rejuvenation in glassy systems, 2023.
12. Freedberg J. Protocol dependence of spatially inhomogeneous magnetic systems. Conservancy University of Minnesota (2024).
13. Kisker J, Santen L, Schreckenberg M, Rieger H. Off-equilibrium dynamics in finite-dimensional spin-glass models. Phys Rev B (1996) 53:6418–28. doi:10.1103/physrevb.53.6418
14. Baity-Jesi M, Calore E, Cruz A, Fernandez LA, Gil-Narvion JM, Gordillo-Guerrero A, et al. Aging rate of spin glasses from simulations matches experiments. Phys Rev Lett (2018) 120:267203. doi:10.1103/physrevlett.120.267203
15. Lundgren L, Svedlindh P, Beckman O. Anomalous time dependence of the susceptibility in a Cu(Mn) spin glass. J Magn Magn Mater (1983) 31–34:1349–50. doi:10.1016/0304-8853(83)90922-8
16. Vincent E. Ageing, rejuvenation and memory: the example of spin glasses. In: M Henkel, M Pleimling, and R Sanctuary, editors. Ageing and the glass transition, number 716 in lecture notes in physics. Springer (2007).
17. Fisher DS, Huse DA. Nonequilibrium dynamics of spin glasses. Phys Rev B (1988) 38:373–85. doi:10.1103/physrevb.38.373
18. Mézard M, Parisi G, Sourlas N, Toulouse G, Virasoro M. Replica symmetry breaking and the nature of the spin glass phase. J de Physique (1984) 45(5):843–54. doi:10.1051/jphys:01984004505084300
19. Ocio M, Alba M, Hammann J. Time scaling of the ageing process in spin-glasses: a study in csnifef 6. J de Physique Lettres (1985) 46(23):1101–7. doi:10.1051/jphyslet:0198500460230110100
20. Chamberlin RV. Time decay of the thermoremanent magnetization in spin-glasses as a function of the time spent in the field-cooled state. Phys Rev B (1984) 30:5393–5. doi:10.1103/physrevb.30.5393
21. Weissman MB, Israeloff NE, Alers GB. Spin-glass fluctuation statistics: mesoscopic experiments in Mn. J magnetism Magn Mater (1992) 114(1-2):87–130. doi:10.1016/0304-8853(92)90336-m
22. Zotev VS, Rodriguez GF, Kenning GG, Orbach R, Vincent E, Hammann J. Role of initial conditions in spin-glass aging experiments. Phys Rev B (2003) 67:184422. doi:10.1103/physrevb.67.184422
23. Kenning GG, Brandt M, Brake R, Hepler M, Tennant D. Observation of critical scaling in spin glasses below tc using the thermoremanent magnetization. Front Phys (2024) 12. This reference will be furnished when the manuscript has been posted. doi:10.3389/fphy.2024.1443298
24. Lundgren L, Svedlindh P, Beckman O. Experimental indications for a critical relaxation time in spin-glasses. Phys Rev B (1982) 26:3990–3. doi:10.1103/physrevb.26.3990
25. Joh YG, Orbach R, Wood GG, Hammann J, Vincent E. Extraction of the spin glass correlation length. Phys Rev Lett (1999) 82:438–41. doi:10.1103/physrevlett.82.438
26. Baity-Jesi M, Calore E, Cruz A, Fernandez LA, Gil-Narvion JM, Gonzalez-Adalid Pemartin I, et al. Memory and rejuvenation effects in spin glasses are governed by more than one length scale. Nat Phys (2023) 19:978–85. doi:10.1038/s41567-023-02014-6
27. Leif Ec Lundgren . Non-equilibrium dynamics in spin glasses. In: AIP conference proceedings, 256. American Institute of Physics (1992). p. 407–16.
28. Miyashita S, Vincent E. A microscopic mechanism for rejuvenation and memory effects in spin glasses. Eur Phys J B (2001) 22:203–11. doi:10.1007/s100510170128
29. Jonason K, Vincent E, Hammann J, Bouchaud JP, Nordblad P. Memory and chaos effects in spin glasses. Phys Rev Lett (1998) 81:3243–6. doi:10.1103/physrevlett.81.3243
30. Jean-Philippe B, Vincent D, Hammann J, Vincent E. Separation of time and length scales in spin glasses: temperature as a microscope. Phys Rev B (2001) 65:024439. doi:10.1103/physrevb.65.024439
31. Freedberg J, Schlagel DL, Orbach RL, Dan Dahlberg E. Investigating the interplay between aging and rejuvenation in spin glasses. (2024).
32. Jönsson PE, Yoshino H, Nordblad P. Symmetrical temperature-chaos effect with positive and negative temperature shifts in a spin glass. Phys Rev Lett (2002) 89:097201. doi:10.1103/physrevlett.89.097201
33. Bray AJ, Moore MA. Replica-symmetry breaking in spin-glass theories. Phys Rev Lett (1978) 41:1068–72. doi:10.1103/physrevlett.41.1068
34. Berthier L, Young AP. Temperature cycles in the heisenberg spin glass. Phys Rev B (2005) 71:214429. doi:10.1103/physrevb.71.214429
35. Sasaki M, Dupuis V, Bouchaud J-P, Vincent E. Deviations from perfect memory in spin glass temperature cycling experiments. Eur Phys J B (2002) 29:469–79. doi:10.1140/epjb/e2002-00327-2
36. Paga I, He J, Baity-Jesi M, Calore E, Cruz A, Fernandez LA, et al. Quantifying memory in spin glass. Unpublished, reference be added by Publ, 2023. doi:10.48550/arXiv.2307.02224
37. Dupuis V, Bert F, Bouchaud J-P, Hammann J, Ladieu F, Parker D, et al. Aging, rejuvenation and memory phenomena in spin glasses. Pramana J Phys (2005) 64:1109–19. doi:10.1007/bf02704172
38. Jonason K, Nordblad P, Vincent E, Hammann J, Bouchaud J-P. Memory interference effects in spin glasses. Eur Phys J B (2000) 13(99):99–105. doi:10.1007/s100510050014
39. Pradhan S, Harrison D, Kenning G, Schlagel DL, Guchait S. Investigation of experimental signatures of spin glass transition temperature. Front Phys (2024) Remaining information will be furnished once this manuscript is published. doi:10.3389/fphy.2024.1482907
40. Jean-Philippe Bouchaud. Weak ergodicity breaking and aging in disordered systems. J de Physique (1992) 2(9):1705–13. doi:10.1051/jp1:1992238
41. Bezanson J, Edelman A. Julia: A fresh approach to numerical computing. SIAM Review (2017) 59 (1), 65–98. doi:10.1137/141000671
Keywords: spin glass, dc magnetometry, ac magnetometry, nonequilibrium, dynamics
Citation: Freedberg J and Dahlberg ED (2024) A brief review of spin glass magnetometry techniques. Front. Phys. 12:1447018. doi: 10.3389/fphy.2024.1447018
Received: 10 June 2024; Accepted: 07 November 2024;
Published: 03 December 2024.
Edited by:
Ralph Chamberlin, Arizona State University, United StatesCopyright © 2024 Freedberg and Dahlberg. This is an open-access article distributed under the terms of the Creative Commons Attribution License (CC BY). The use, distribution or reproduction in other forums is permitted, provided the original author(s) and the copyright owner(s) are credited and that the original publication in this journal is cited, in accordance with accepted academic practice. No use, distribution or reproduction is permitted which does not comply with these terms.
*Correspondence: Jennifer Sari Freedberg, ZnJlZWQxMTRAdW1uLmVkdQ==
 Jennifer Freedberg
 E. Dan Dahlberg