 Riccardo Gotti
 Szymon Wójtewicz2
 Davide Gatti
 Marco Lamperti
- 1Dipartimento di Ingegneria Industriale e dell’Informazione, Università di Pavia, Pavia, Italy
- 2Institute of Physics, Faculty of Physics, Astronomy and Informatics, Nicolaus Copernicus University, Toruń, Poland
- 3Dipartimento di Fisica - Politecnico di Milano and IFN-CNR, Lecco, Italy
- 4Dipartimento di Scienza e Alta tecnologia, Università degli studi dell’Insubria, Como, Italy
In this study, we report highly precise and accurate measurements of the P(5), P(6), and O(3) transitions of the 2–0 band of HD occurring at approximately 1.5
1 Introduction
In the past 2 decades, molecular spectroscopy has experienced a paradigmatic change with the invention of the optical frequency comb. On one hand, these combs enabled the accurate determination of atomic and molecular transition energies at unprecedented levels [1, 2] over a large portion of the electromagnetic spectrum, from the near-IR to the mid-IR [3, 4]. On the other hand, they ensure the linearity and repeatability of the frequency axis in spectroscopic measurements, providing a reliable basis for the comparison of the results. Due to optical frequency combs, a variety of fundamental physics applications have become possible, including high-accuracy Doppler broadening thermometry (DBT) [5–12] and tests of quantum electrodynamics (QED) on molecules [13–15].
Among the most scientifically interesting spectroscopic targets, molecular hydrogen is a benchmark for direct comparisons of QED calculations with experimental investigations [14–16] due to its simple molecular structure. A major hurdle when dealing with molecular hydrogen is related to the symmetry of its electronic ground state, making electric dipole transitions forbidden for homo-nuclear species (
Although the adoption of optical frequency combs provides the desired accuracy for the horizontal (frequency) axis, optical cavities with very high finesse can be used to achieve the desired sensitivity for the vertical (absorption) axis. Optical cavities strongly enhance the interaction path between light and molecules, extending it up to the kilometer level [22, 23], thus improving the signal-to-noise ratio (SNR) of weak transition measurements. Among cavity-enhanced approaches like cavity mode-width spectroscopy (CMWS) [24], cavity mode-dispersion spectroscopy (CMDS) [25], and NICE-OHMS [26], cavity ring-down spectroscopy (CRDS) is the technique adopted in this work. CRDS is based on the comparative measurement of the cavity photon lifetime with and without absorption from the sample, with the advantage of being highly resilient against frequency and amplitude laser noise while also giving access to the absolute absorption coefficient without the need for any cavity-length calibration [27]. With this technique, sensitivity levels below
In this paper, we investigate three lines of the HD isotopologue with relatively high rotational quantum numbers, namely, the P(5), P(6), and O(3) lines of the 2–0 band with theoretical transition frequencies of 6,576.900679
2 Experimental setup and data analysis procedure
The HD absorption profiles were acquired using a comb-assisted CRD spectrometer, as reported in [19, 29]. In brief, the setup includes a 50 cm-long high finesse (
Absorption spectra were measured for each line at five pressures: 100, 300, 500, 700, and 900 Torr, at a temperature of 300.65 K. The signal-to-noise ratio achieved in the measurements depends on both the measurement pressure and the absorption coefficient of the specific line and ranges from 920 to 8,500 for the P(5) line, from 100 to 850 for the P(6) line, and from 140 to 860 for the O(3) line.
The analysis of the spectra was based on the Hartmann–Tran profile [17, 33], which goes beyond the commonly used Voigt profile, adding the speed dependence of pressure broadening and shifting in the quadratic approximation, the velocity-changing collisions leading to Dicke narrowing, and correlations between velocity- and phase-changing collisions. Specifically, we used the so-called
We identified the best type of fit by monitoring the value of the resulting
The overall fit model includes the HD line expressed with a
3 Results
For each line, we evaluated the quality of different fit constraints by monitoring the values of
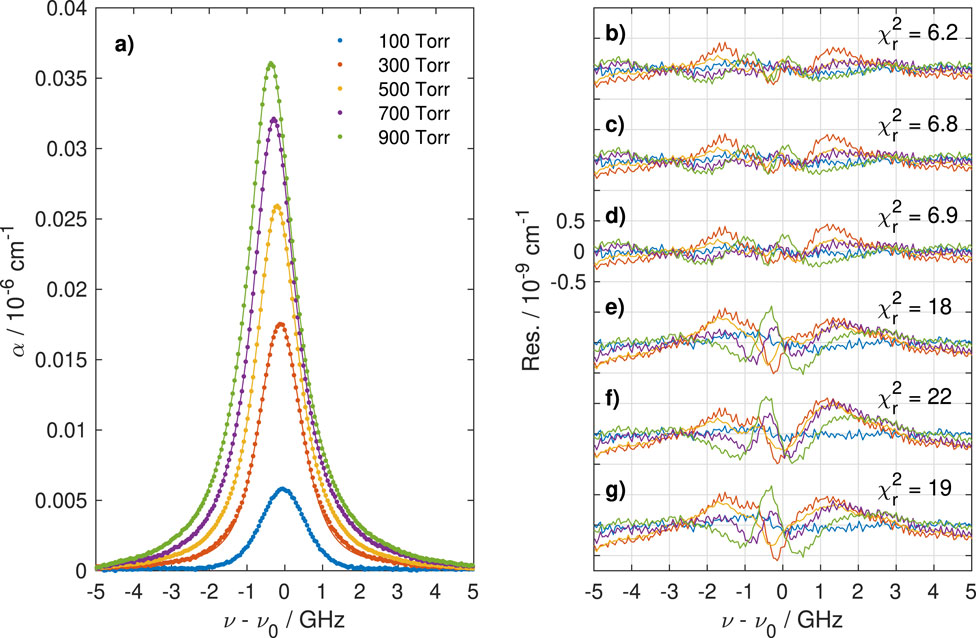
Figure 1. Multispectrum fit of the O(3) line. (A) Data (with baseline and interfering line subtracted for clarity) fitted with
The results of similar fits for the P(5) and P(6) lines are shown in Figure 2. The systematic structure in the residuals is more evident for the P(5) transition, primarily due to its higher line strength. Conversely, the P(6) line shows smaller residuals than the O(3) line even if it is characterized by a comparable line strength. In Table 1, we report the fitted collisional parameters for all three lines. The reported uncertainty on the collisional parameters takes into account the statistical uncertainty and the uncertainty from modeling the baseline and interfering lines. The procedure for evaluating these contributions is the same as the one described in detail for the transition frequency in the next paragraph.
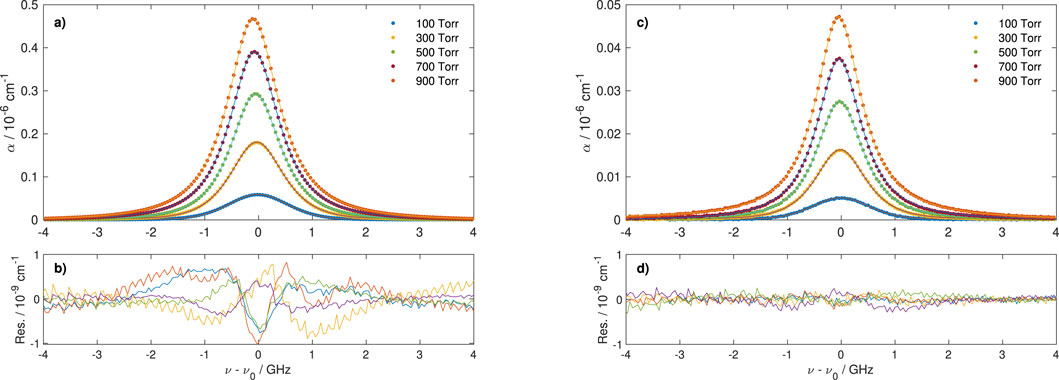
Figure 2. Multispectrum fits of the P(5) and P(6) lines, with
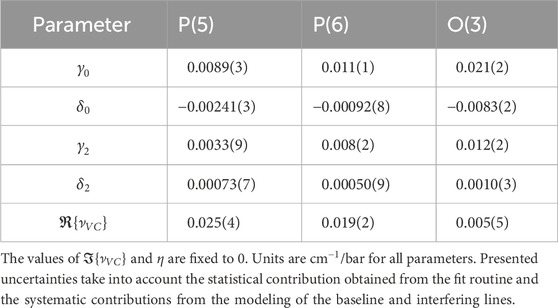
Table 1. Collisional parameters obtained from the multipressure fits of the three lines analyzed.
To determine the uncertainty on the retrieved transition frequencies, we considered various contributing factors of errors. The statistical contribution component (type A) has been estimated from the covariance matrix returned by the fitting routine. We identified five main sources of systematic uncertainty (type B): the line-shape model, the choice of the constrained collisional parameters in the fit, the uncertainty on the thermodynamic parameters of the gas inside the cavity, the influence of the baseline and that of interfering lines. Other sources, like the stability of the reference Rb clock or the noise of the optical frequency comb used for frequency referencing, are negligible. To evaluate the effect of the specific line-shape model chosen for fitting,
from Equation (4) in [34]. This contribution to the total uncertainty is about 1/100 or less than that of the pressure reading and can be neglected. To evaluate the uncertainty associated with the baseline model, we repeated the fits, replacing the cubic baseline with a linear baseline plus an etalon. This model gave slightly worse results than the cubic baseline. We considered the difference between the transition frequencies evaluated in these ways as the error due to baseline modeling. Finally, to evaluate the error due to interfering lines, we repeated the fit, fixing the center of the interfering lines to the value found from HITRAN.
Our final accuracy is approximately 1 MHz for the P(5) transition, 2 MHz for the P(6) transition, and 9 MHz for the O(3) transition. Even better results (especially for the O(3) transition) could be achieved by performing ab initio quantum scattering calculations of the line-shape parameters and utilizing them in the data analysis. This would mitigate systematics given by the complex collisional physics of molecular hydrogen in the high-pressure range. However, this is outside the scope of this paper. Another solution could be performing measurements in the low-pressure range in which the atypical shapes of molecular hydrogen transitions are less pronounced. Such a solution would require the development of a more sensitive spectrometer.
Table 2 reports the uncertainty budget and combined uncertainty for the lines measured in this study, while Table 3 reports the retrieved line center frequency compared to the theoretical QED value provided by H2SPECTRE [31]. For the P(5) line, which, to the best of our knowledge, was the only one previously measured, we provide an improved determination [32]. The comparison with that unique experimental determination of the P(5) transition shows a discrepancy of approximately 1
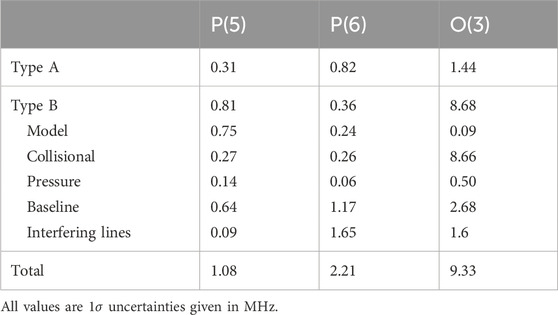
Table 2. Uncertainty budget including both statistical (Type A) and systematic (Type B) contributions for the positions of the HD 2–0 band P(5), P(6), and O(3) transitions.
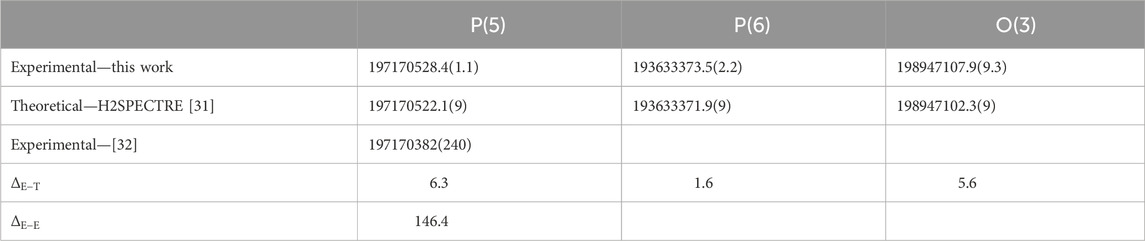
Table 3. Comparison of experimental and theoretical determinations of the HD 2–0 band P(5), P(6), and O(3) transition frequencies. All given values are in MHz.
4 Conclusion
We have presented the first highly precise and accurate comb-assisted measurement of the P(5), P(6), and O(3) transitions in the 2-0 band of the HD molecule at 1.53
Data availability statement
The raw data supporting the conclusions of this article will be made available by the authors, without undue reservation.
Author contributions
RG: conceptualization, data curation, investigation, methodology, resources, software, validation, writing–original draft, writing–review and editing, and supervision. SW: investigation, methodology, validation, writing–review and editing, formal analysis, software, and writing–original draft. MM: conceptualization, funding acquisition, project administration, writing–review and editing, supervision, and writing–original draft. DG: investigation, software, writing–original draft, writing–review and editing, and methodology. ML: conceptualization, data curation, formal analysis, project administration, software, supervision, validation, visualization, writing–original draft, and writing–review and editing.
Funding
The author(s) declare that financial support was received for the research, authorship, and/or publication of this article. The authors acknowledge financial support by the European Union’s NextGenerationEU Programme with the I-PHOQS Infrastructure (IR0000016, ID D2B8D520, CUP B53C22001750006) Integrated infrastructure initiative in PHOtonic and Quantum Sciences.
Conflict of interest
The authors declare that the research was conducted in the absence of any commercial or financial relationships that could be construed as a potential conflict of interest.
Publisher’s note
All claims expressed in this article are solely those of the authors and do not necessarily represent those of their affiliated organizations, or those of the publisher, the editors, and the reviewers. Any product that may be evaluated in this article, or claim that may be made by its manufacturer, is not guaranteed or endorsed by the publisher.
References
1. Holzwarth R, Udem T, Hänsch TW, Knight J, Wadsworth W, Russell PSJ. Optical frequency synthesizer for precision spectroscopy. Phys Rev Lett (2000) 85:2264–7. doi:10.1103/physrevlett.85.2264
2. Diddams SA, Jones DJ, Ye J, Cundiff ST, Hall JL, Ranka JK, et al. Direct link between microwave and optical frequencies with a 300 THz femtosecond laser comb. Phys Rev Lett (2000) 84:5102–5. doi:10.1103/physrevlett.84.5102
3. Fortier T, Baumann E. 20 years of developments in optical frequency comb technology and applications. Commun Phys (2019) 2:153. doi:10.1038/s42005-019-0249-y
4. Lamperti M, Gotti R, Gatti D, Shakfa MK, Cané E, Tamassia F, et al. Optical frequency metrology in the bending modes region. Commun Phys (2020) 3:175. doi:10.1038/s42005-020-00441-y
5. Gotti R, Lamperti M, Gatti D, Marangoni M. Laser-based primary thermometry: a review. J Phys Chem Reference Data (2021) 50. doi:10.1063/5.0055297
6. Gotti R, Lamperti M, Gatti D, Wójtewicz S, Puppe T, Mayzlin Y, et al. Multispectrum rotational states distribution thermometry: Application to the 3ν1+ν3 band of carbon dioxide. New J. Phys. (2020). 22:083071. doi:10.1088/1367-2630/aba85d
7. Gotti R, Moretti L, Gatti D, Castrillo A, Galzerano G, Laporta P, et al. Cavity-ring-down Doppler-broadening primary thermometry. Phys Rev A (2018) 97:012512. doi:10.1103/physreva.97.012512
8. Gianfrani L. Linking the thermodynamic temperature to an optical frequency: recent advances in Doppler broadening thermometry. Philos Trans R Soc A: Math Phys Eng Sci (2016) 374:20150047. doi:10.1098/rsta.2015.0047
9. De Vizia MD, Odintsova T, Gianfrani L. Hyperfine structure effects in Doppler-broadening thermometry on water vapor at 1.4 μm. Metrologia (2016) 53:800–4. doi:10.1088/0026-1394/53/2/800
10. Hashemi R, Povey C, Derksen M, Naseri H, Garber J, Predoi-Cross A. Doppler broadening thermometry of acetylene and accurate measurement of the Boltzmann constant. J Chem Phys (2014) 141:214201. doi:10.1063/1.4902076
11. Castrillo A, Fasci E, Dinesan H, Gravina S, Moretti L, Gianfrani L. Optical determination of thermodynamic temperatures from a C2H2 line-doublet in the near infrared. Phys Rev Appl (2019) 11:064060. doi:10.1103/physrevapplied.11.064060
12. Gatti D, Mills AA, De Vizia MD, Mohr C, Hartl I, Marangoni M, et al. Frequency-comb-calibrated Doppler broadening thermometry. Phys Rev A - At Mol Opt Phys (2013) 88:012514. doi:10.1103/physreva.88.012514
13. Cozijn F, Dupré P, Salumbides E, Eikema K, Ubachs W. Sub-Doppler frequency metrology in HD for tests of fundamental physics. Phys Rev Lett (2018) 120:153002. doi:10.1103/physrevlett.120.153002
14. Diouf M, Cozijn F, Darquié B, Salumbides E, Ubachs W. Lamb-dips and Lamb-peaks in the saturation spectrum of HD. Opt Lett (2019) 44:4733–6. doi:10.1364/ol.44.004733
15. Hua TP, Sun Y, Hu SM. Dispersion-like lineshape observed in cavity-enhanced saturation spectroscopy of HD at 1.4 μm. Opt Lett (2020) 45:4863–6. doi:10.1364/ol.401879
16. Salumbides E, Dickenson G, Ivanov T, Ubachs W. QED effects in molecules: test on rotational quantum states of H2. Phys Rev Lett (2011) 107:043005. doi:10.1103/physrevlett.107.043005
17. Ngo N, Lisak D, Tran H, Hartmann JM. An isolated line-shape model to go beyond the Voigt profile in spectroscopic databases and radiative transfer codes. J Quantitative Spectrosc Radiative Transfer (2013) 129:89–100. doi:10.1016/j.jqsrt.2013.05.034
18. Castrillo A, Fasci E, Gianfrani L. Doppler-limited precision spectroscopy of HD at 1.4 μm: an improved determination of the R(1) center frequency. Phys Rev A (2021) 103:022828. doi:10.1103/physreva.103.022828
19. Wójtewicz S, Gotti R, Gatti D, Lamperti M, Laporta P, Jóźwiak H, et al. Accurate deuterium spectroscopy and comparison with ab initio calculations. Phys Rev A (2020) 101:052504. doi:10.1103/physreva.101.052504
20. Lamperti M, Rutkowski L, Ronchetti D, Gatti D, Gotti R, Cerullo G, et al. Stimulated Raman scattering metrology of molecular hydrogen. Commun Phys (2023) 6:67. doi:10.1038/s42005-023-01187-z
21. Lamperti M, Rutkowski L, Gatti D, Gotti R, Moretti L, Polli D, et al. A stimulated Raman loss spectrometer for metrological studies of quadrupole lines of hydrogen isotopologues. Mol Phys (2023) 121:e2196353. doi:10.1080/00268976.2023.2196353
22. Romanini D, Ventrillard I, Méjean G, Morville J, Kerstel E. Introduction to cavity enhanced absorption spectroscopy. In: Cavity-enhanced spectroscopy and sensing. Springer (2014). p. 1–60.
23. Gianfrani L, Hu SM, Ubachs W. Advances in cavity-enhanced methods for high precision molecular spectroscopy and test of fundamental physics. La Rivista Del Nuovo Cimento (2024) 47:229–98. doi:10.1007/s40766-024-00054-z
24. Cygan A, Lisak D, Morzyński P, Bober M, Zawada M, Pazderski E, et al. Cavity mode-width spectroscopy with widely tunable ultra narrow laser. Opt Express (2013) 21:29744–54. doi:10.1364/oe.21.029744
25. Cygan A, Wcisło P, Wójtewicz S, Masłowski P, Hodges JT, Ciuryło R, et al. One-dimensional frequency-based spectroscopy. Opt Express (2015) 23:14472–86. doi:10.1364/oe.23.014472
26. Ye J, Ma LS, Hall JL. Ultrasensitive detections in atomic and molecular physics: demonstration in molecular overtone spectroscopy. J Opt Soc America B: Opt Phys (1998) 15:6–15. doi:10.1364/josab.15.000006
27. O’Keefe A, Deacon DA. Cavity ring-down optical spectrometer for absorption measurements using pulsed laser sources. Rev Scientific Instr (1988) 59:2544–51. doi:10.1063/1.1139895
28. Gatti D, Sala T, Gotti R, Cocola L, Poletto L, Prevedelli M, et al. Comb-locked cavity ring-down spectrometer. J Chem Phys (2015) 142:074201. doi:10.1063/1.4907939
29. Gotti R, Gatti D, Masłowski P, Lamperti M, Belmonte M, Laporta P, et al. Conjugating precision and acquisition time in a Doppler broadening regime by interleaved frequency-agile rapid-scanning cavity ring-down spectroscopy. J Chem Phys (2017) 147:134201. doi:10.1063/1.4999056
30. Kassi S, Campargue A. Cavity ring down spectroscopy with 5 × 10-13 cm-1 sensitivity. J Chem Phys (2012) 137:234201. doi:10.1063/1.4769974
31. Komasa J, Puchalski M, Czachorowski P, Łach G, Pachucki K. Rovibrational energy levels of the hydrogen molecule through nonadiabatic perturbation theory. Phys Rev A (2019) 100:032519. doi:10.1103/physreva.100.032519
32. Lin T, Chou CC, Lwo DJ, Shy JT. Absorption spectrum of the P(5) transition of the first overtone band of HD. Phys Rev A (2000) 61:064502. doi:10.1103/physreva.61.064502
33. Tennyson J, Bernath PF, Campargue A, Császár AG, Daumont L, Gamache RR, et al. Recommended isolated-line profile for representing high-resolution spectroscopic transitions (IUPAC Technical Report). Pure Appl Chem (2014) 86:1931–43. doi:10.1515/pac-2014-0208
34. Wcisło P, Gordon I, Tran H, Tan Y, Hu SM, Campargue A, et al. The implementation of non-Voigt line profiles in the HITRAN database: H2 case study. J Quantitative Spectrosc Radiative Transfer (2016) 177:75–91. doi:10.1016/j.jqsrt.2016.01.024
35. Konefał M, Słowiński M, Zaborowski M, Ciuryło R, Lisak D, Wcisło P. Analytical-function correction to the Hartmann–Tran profile for more reliable representation of the Dicke-narrowed molecular spectra. J Quantitative Spectrosc Radiative Transfer (2020) 242:106784. doi:10.1016/j.jqsrt.2019.106784
36. Benner DC, Rinsland CP, Devi VM, Smith MAH, Atkins D. A multispectrum nonlinear least squares fitting technique. J Quantitative Spectrosc Radiative Transfer (1995) 53:705–21. doi:10.1016/0022-4073(95)00015-d
37. Truong GW, Douglass KO, Maxwell SE, van Zee RD, Plusquellic DF, Hodges JT, et al. Frequency-agile, rapid scanning spectroscopy. Nat Photon (2013) 7:532–4. doi:10.1038/nphoton.2013.98
38. Ciuryło R, Shapiro DA, Drummond JR, May AD. Solving the line-shape problem with speed-dependent broadening and shifting and with Dicke narrowing. II. Application. Phys Rev A (2001) 65:012502. doi:10.1103/physreva.65.012502
39. Wcisło P, Thibault F, Stolarczyk N, Jóźwiak H, Słowiński M, Gancewski M, et al. The first comprehensive dataset of beyond-Voigt line-shape parameters from ab initio quantum scattering calculations for the HITRAN database: He-perturbed H2 case study. J Quantitative Spectrosc Radiative Transfer (2021) 260:107477. doi:10.1016/j.jqsrt.2020.107477
40. Wcisło P, Thibault F, Zaborowski M, Wójtewicz S, Cygan A, Kowzan G, et al. Accurate deuterium spectroscopy for fundamental studies. J Quantitative Spectrosc Radiative Transfer (2018) 213:41–51. doi:10.1016/j.jqsrt.2018.04.011
41. Amdur I, Beatty JJ. Diffusion coefficients of hydrogen isotopes. J Chem Phys (1965) 42:3361–4. doi:10.1063/1.1695735
42. Cygan A, Lisak D, Wójtewicz S, Domysławska J, Hodges JT, Trawiński RS, et al. High-signal-to-noise-ratio laser technique for accurate measurements of spectral line parameters. Phys Rev A (2012) 85:022508. doi:10.1103/physreva.85.022508
43. Mondelain D, de Casson LB, Fleurbaey H, Kassi S, Campargue A. Accurate absolute frequency measurement of the S(2) transition in the fundamental band of H2 near 2.03 μm. Phys Chem Chem Phys (2023) 25:22662–8. doi:10.1039/d3cp03187j
Keywords: precision molecular spectroscopy, HD spectroscopy, cavity ring-down spectroscopy, optical frequency comb, line position
Citation: Gotti R, Wójtewicz S, Marangoni M, Gatti D and Lamperti M (2024) High-precision HD spectroscopy near 1.53
Received: 10 June 2024; Accepted: 26 August 2024;
Published: 16 September 2024.
Edited by:
Karol Krzempek, Wrocław University of Science and Technology, PolandReviewed by:
Livio Gianfrani, Università degli Studi della Campania Luigi Vanvitelli, ItalyAntonio Castrillo, University of Campania Luigi Vanvitelli, Italy
Copyright © 2024 Gotti, Wójtewicz, Marangoni, Gatti and Lamperti. This is an open-access article distributed under the terms of the Creative Commons Attribution License (CC BY). The use, distribution or reproduction in other forums is permitted, provided the original author(s) and the copyright owner(s) are credited and that the original publication in this journal is cited, in accordance with accepted academic practice. No use, distribution or reproduction is permitted which does not comply with these terms.
*Correspondence: Davide Gatti, ZGF2aWRlMS5nYXR0aUBwb2xpbWkuaXQ=