 Carlo Amato
 Christian Disch
 Pietro Zambon
- DECTRIS Ltd., Baden, Switzerland
High photon rates, like the ones required in clinical computed tomography, can generate pulse pileup in photon-counting detectors, and in extreme cases induce system paralysis. The instant retrigger technology has been developed by DECTRIS Ltd. to counteract such phenomena, effectively making detectors non-paralyzable. The instant retrigger behavior is regulated by a quantity named retrigger time, which originally was the same for all the energy thresholds of the detector. We developed a new ASIC that features an improved version of the instant retrigger (polychromatic retrigger) that allows different retrigger times for each of the four energy thresholds. In this work, we investigate how this feature can be exploited in computed tomography to mitigate pileup artifacts. Using a Monte Carlo method, we modeled a full computed tomography system with four energy thresholds (20, 50, 70 and 90 keV), and we simulated head scans from low (1
1 Introduction
Photon-counting (PC) detectors are currently used for Computed Tomography (CT) applications and, compared to conventional energy-integrating detectors, have been proven to provide better spatial resolution and contrast-to-noise ratio at the same radiation dose [1–3]. Besides improving image quality, PC detectors also intrinsically provide spectral information thanks to their multiple and adjustable energy thresholds. This, in combination with novel contrast agents [4] and K-edge imaging techniques [5, 6], can add diagnostic value to CT images and provide new tools to clinicians and researchers [7–9].
One of the main challenges that PC detectors have to face in a clinical environment is the high photon rate, up to 1
Recently, a new application-specific integrated circuit (ASIC), called LYNX, was developed at DECTRIS Ltd. The LYNX ASIC was designed specifically for CT applications, and it features four energy thresholds and an improved version of the instant-retrigger technology. The retrigger time of the LYNX chip can be tuned for every energy threshold individually, hence the name polychromatic retrigger. In this work, we deeply investigate this new feature through Monte-Carlo simulations and characterise how it can be exploited to mitigate the pileup artifacts that are associated with the high photon rates required in the clinic. In this way, we gain a better understanding of the relation between energy threshold, retrigger time, detected count-rate and image quality.
2 Materials and methods
2.1 The LYNX ASIC and the polychromatic retrigger
The LYNX (Figure 1) was specifically designed for photon counting CT applications and its development was focused on low power consumption, count rate capability, gapless packaging and cost-effectiveness. The ASIC is intended for sensors with 330 µm pixel pitch. A total number of 648 pixels are arranged in a
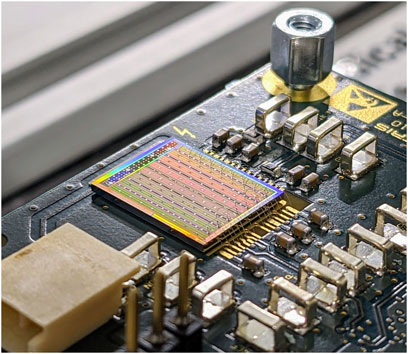
Figure 1. A single LYNX ASIC wirebonded to a readout board for testing.
A tunable non-paralyzable model is realized through the polychromatic retrigger, an improved version of the proven instant retrigger technology. The instant retrigger by DECTRIS Ltd. is a technology developed to counteract detector paralysis in counting systems [11]. A pixel equipped with the instant retrigger evaluates the output of the comparator periodically after the signal goes above the threshold. The time period between evaluations is called retrigger time
2.2 Monte Carlo method
The Monte Carlo method used in this work was already mentioned in [14] and it is herein described more in detail.
Based on the geometry and features of the new LYNX ASIC, a detector element is modeled as a square pixel with a size of 330 µm bump-bonded to a 1.5 mm thick CdTe sensor operated at a bias voltage of −1,000 V. Given the spectrum impinging on a pixel, the detected spectrum is obtained by convolving the impinging spectrum with the spectral response of the detector, which was previously calculated for the specific pixel geometry and materials [14] using FLUKA (program version 2005), a Monte Carlo software for the simulation of particle transport and interaction [15–17]. To emulate the X-ray sources used in clinical CT practice, a 120 kV polychromatic spectrum prefiltrated with 6.8 mm of aluminum was chosen as the incoming spectrum. In Figure 2 left, the incoming spectrum and the spectrum detected by a detector element are visible. The detected spectrum is used to randomly sample the energy of the photons impinging a pixel. The time of arrival of each photon is randomly sampled with 1 ns resolution from a uniform distribution over the acquisition time-interval. The duration of the acquisition
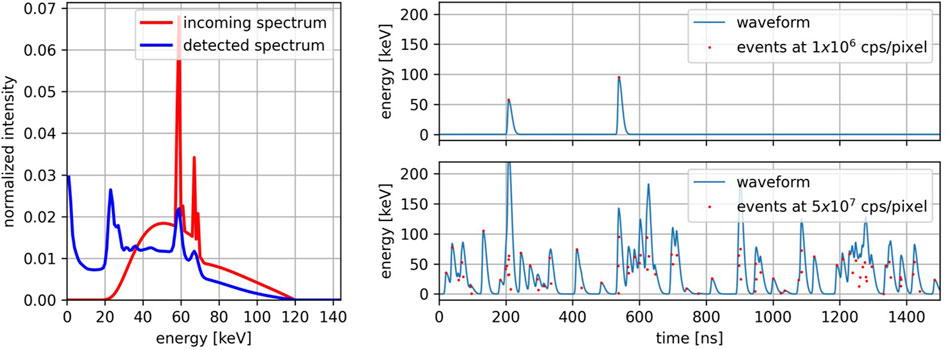
Figure 2. Left: Incoming X-ray spectrum at 120 kV (red) and the same spectrum detected by a CdTe sensor with a pixel size of 330 μm, a thickness of 1.5 mm, and a bias voltage of −1,000 V (blue). Right: Waveforms at different incoming photon rates (top: 1
At a pixel level, the described simulations were used to calculate the count-rate curves and the detected integral spectrum for retrigger times between 10 ns and 1,000 ns, and count-rates between 1
2.3 CT simulation and image analysis
To assess the dependency of the image quality on the retrigger time, CT images were simulated using the MC method described in the previous section. A CT scanner was modeled using a simple parallel beam geometry. As x-ray source, the aforementioned 120 kV spectrum prefiltered with 6.8 mm of aluminum was used (Figure 2, left). To avoid saturation in the line of flight not intersecting the phantom, the incoming spectrum was attenuated by a bow tie filter. The phantom (Figure 3, left) consists of a head-sized water cylinder (160 mm diameter) with high-Z inserts. The attenuated spectrum transmitted through the phantom was calculated for every detector pixel (500 pixels of 330 µm) and every projection angle (360 projections, 0.5
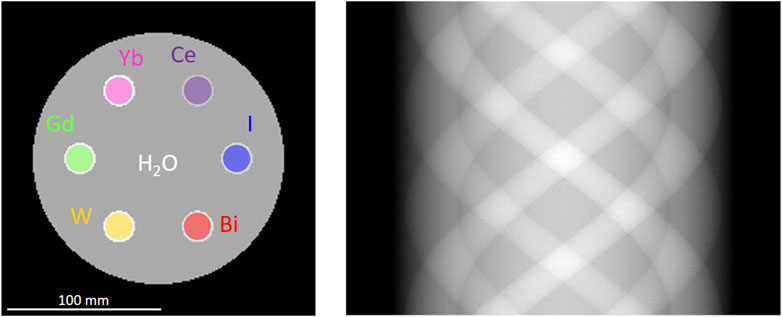
Figure 3. Left: Head-sized phantom (160 mm diameter) used for the CT simulations. Six 20 cm vials filled with 10 mg/mL high-Z material solution are placed close to the periphery. Right: example sinogram of the phantom in parallel beam geometry.
For each reconstructed image
where
3 Results
3.1 Count-rate curves
The Monte Carlo method described in Section 2.2 was used to simulate the count-rate curves for a single pixel exposed to a photon rate between 1
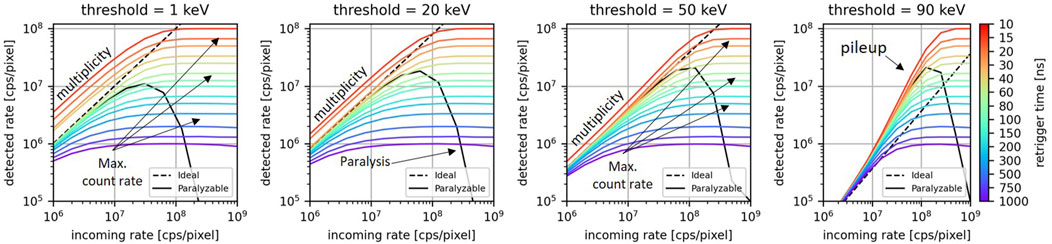
Figure 4. For different values of the retrigger time, the count-rate curves for energy thresholds at 1, 20, 50, and 90 keV. The count-rate curves for the ideal model and the paralyzable are displayed as dashed lines and continuous lines, respectively.
3.2 Integral spectra
In Figure 5, the detected integral spectra are displayed for an incoming photon rate of 1
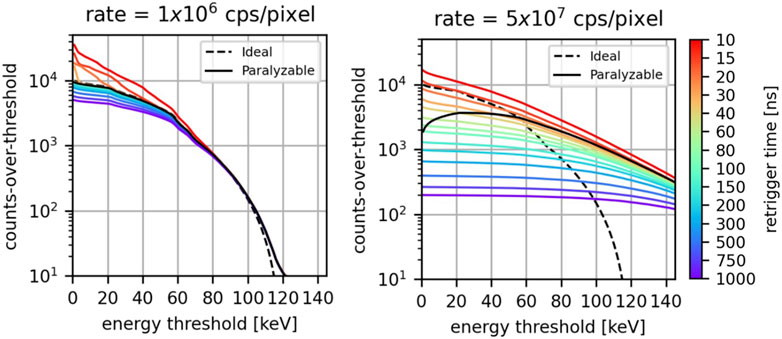
Figure 5. For different values of the retrigger time, the detected integral-spectra at 1
At low photon rates, the ideal spectrum, the paralyzable model, and the retrigger model exhibit approximately the same behavior. The main differences are found for the retrigger model at low energies for low values of the retrigger time: consistent with what was found in the previous section, in this scenario there is an excess of detected counts due to spurious multiple-counting. Minor deviations are also found at low energies for high values of the retrigger time because of early count-rate saturation.
At a high photon rate, the difference among the various models is more significant. Firstly, due to pileup both the paralyzable and the retrigger model count photons at energies higher than the maximum photon energy contained in the incoming spectrum. This phenomenon is expected at high photon rates and was already described by [14]. Secondly, the paralyzable model does not exhibit anymore a monotonically decreasing behavior. Instead, it has a count peak between 20 and 40 keV. This undesired behavior is due to the paralysis, which becomes more pronounced as the energy threshold decreases, and will result in negative counts once the differential spectrum is calculated. On the other hand, the retrigger model always exhibits a monotonically decreasing behavior which will ensure no negative counts once energy bins are taken into account. The longer the retrigger, the fewer counts are recorded and the flatter the integrated spectrum is. For retrigger times above 15 ns, the retrigger model curves intersect the ideal curve at different energies. This means that for a specific energy threshold, a retrigger time can be chosen such that the retrigger model provides the same counts of the ideal scenario. The coordinates of the intersection points (retrigger time vs. energy threshold) suggests that the higher the energy threshold one wants to use, the higher the retrigger time has to be set. Also the paralyzable model curve intersects the ideal curve between 50 and 60 keV.
3.3 CT reconstructions
Figure 6 displays the RMSRE of the CT images simulated for an incoming photon-rate of 1
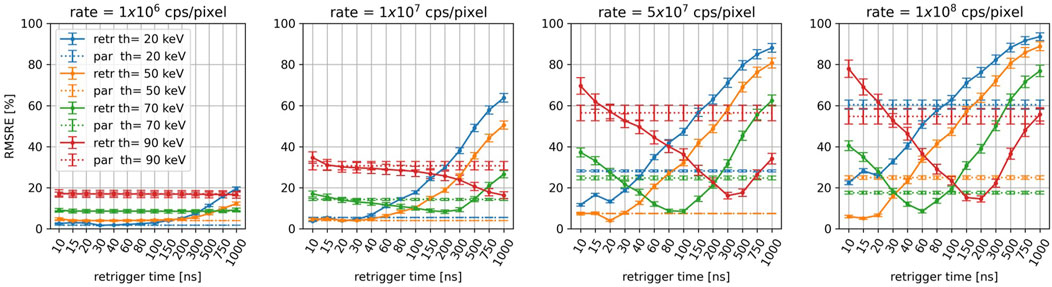
Figure 6. For the different energy thresholds and incoming photon-rates, RMSRE of the reconstructions as a function of the retrigger time. The RMSRE for the paralyzable model is plotted as a dashed line.
At 1
As the count rate increases, the average RMSRE increases as well. For incoming rates above 1
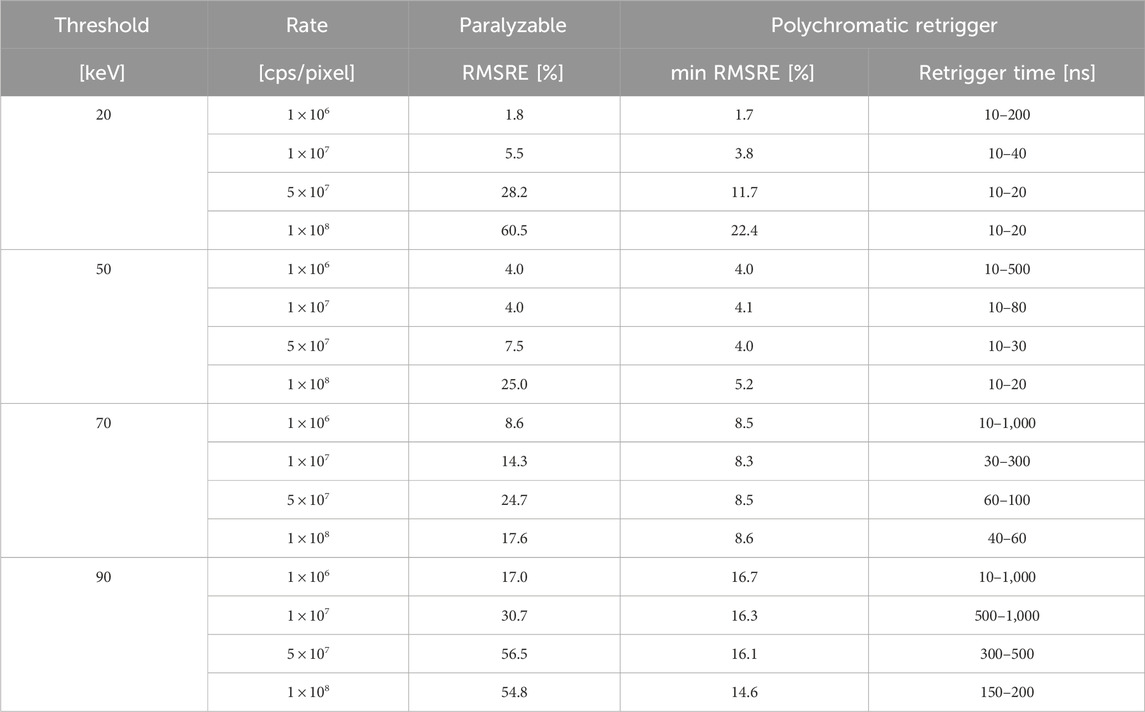
Table 1. For the investigated photon rates and energy thresholds, RMSRE of the CT images simulated with the paralyzable and polychromatic retrigger models. For the polychomatic retrigger, the minimum RMSRE is listed together with the range of retrigger times providing the minimum RMSRE within 5%.
For visual comparison, Figure 7 shows the CT reconstructions for the ideal, paralyzable, and retrigger models with 20, 70 and 90 keV energy threshold, at low (1
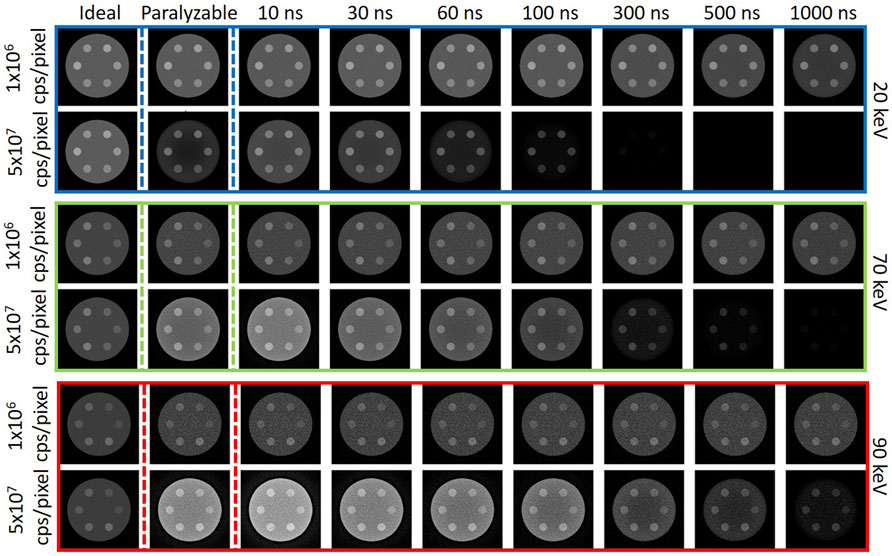
Figure 7. Example of the CT images for the three simulated models: ideal, paralyzable, and instant retrigger for different values of the retrigger time. The reconstructions are shown for energy threshold at 20 keV (blue box), 70 keV (green box), and 90 keV (red box), for two values of the incoming photon rate: 1
4 Discussion
The results have shown how the count-rate curves, the detected spectra, and the image quality depend on the retrigger time, and how this dependency becomes more significant as the incoming photon rate increases. In Figure 5 right, it was shown that at high rates, the ideal integral spectrum intersects with the spectra obtained with retrigger model. This means that for a specific energy threshold, there is a retrigger time that provides the same counts-over-threshold of the ideal model. It was found that the higher the desired energy threshold, the longer the retrigger time has to be set. This is consistent with what found in Figure 4, where it was shown that a longer retrigger time can mitigate the pileup counts recorded at high energies.
This first optimization attempt was carried out at a pixel level, without any attenuation by a sample or patient, meaning that it was performed with only one detected spectrum. A second characterization of the polychromatic retrigger was performed with a real-world CT application. In such scenario, the bow tie filter and imaged object attenuate the incoming spectrum according to their material composition and intersection lengths. Therefore by simulating a CT system and by evaluating the quality of the final reconstructed image, a global optimization process could be performed, without individually investigate all the slightly different spectra detected by each pixel in the 2D detector matrix. The characterization of the RMSRE of the CT reconstructions is summarized in Table 1. The results have shown that the RMSRE as a function of the retrigger time exhibits a global minimum, proving that the retrigger time can optimize the image quality even in a real-world application. The value of the best retrigger time depends on the energy threshold and incoming photon rate, and it is expected to change also with the tube voltage and the thickness of the imaged object. These dependencies do not limit the applicability of the polychromatic retrigger in clinical settings, where the different acquisition protocols are defined according to the body region to be scanned. Therefore, the optimal retrigger times can be calibrated in advance for each acquisition protocol. The pile-up artifact reduction provided by the polychromatic retrigger might offer benefits in multiple clinical domains like cardiovascular imaging, early tumor detection, implant visualization, and pediatric imaging. Furthermore, the enhanced image fidelity is expected to improve the accuracy of K-edge imaging, which is used to quantify the concentration of specific contrast agents or molecular markers within tissues. This has potential applications in both research and clinical settings for tracking disease progression and response to therapy. Lastly, the polychromatic retrigger might be beneficial to other imaging modalities where accurate photon counting is required [18].
Figure 8 compares the best results obtained with the polychromatic retrigger with the ones obtained with the paralyzable model (left), and with the conventional instant retrigger (equal for all thresholds) fixed at 20 ns (center) and 300 ns (right). In all three scenarios, it is possible to see how all models perform similarly at the lowest photon rate of 1
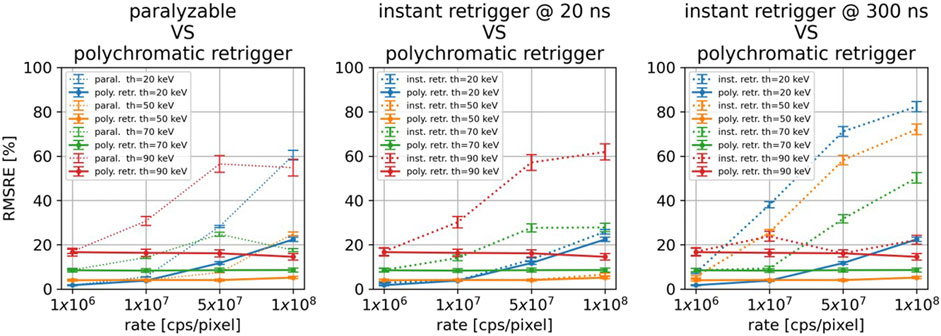
Figure 8. For all the investigated energy thresholds and incoming photon rates, comparison between the polychromatic retrigger and the paralyzable model (left), with the instant retrigger fixed at 20 ns (center), and with the instant retrigger fixed at 300 ns (right).
The main benefit of the polychromatic retrigger over the instant retrigger is highlighted in Figure 8 center and right. With the conventional instant retrigger, only one retrigger time can be set for all thresholds. If 20 ns is set (Figure 8 center, dashed lines), the threshold images at 20 and 50 keV will provide the best RMSRE achievable even at high photon rates. Conversely, the image quality at 70 and 90 keV will decrease. On the other hand, if a retrigger time of 300 ns is set (Figure 8 right, dashed lines), the threshold images at 90 keV will have almost constant RMSRE, whereas the RMSRE will increase for the other energy thresholds. By using the polychromatic retrigger instead, it is possible to optimize the retrigger time for each threshold individually and obtain the best achievable RMSRE for every incoming photon rate. While the current results are promising, we acknowledge that experimental validation is necessary to fully confirm our findings and we will pursue this in future work.
5 Conclusion
In the framework of photon-counting CT applications, we have investigated how pulse pileup at high photon rates can degrade the quality of the reconstructed images and how the polychromatic retrigger can mitigate this. In general, the deviation of realistic images from the ideal ones increases when the incoming photon rate increases from 1
The deviation provided by the polychromatic retrigger is almost constant for all the different incoming photon rates, meaning that the polychromatic retrigger can enable CT acquisitions at higher photon rates, with only a marginal loss of image quality. The polychromatic retrigger constitutes an additional degree of freedom for image quality optimization. For a specific acquisition protocol like the ones implemented in clinics, the value of the optimal retrigger time can be evaluated in advance through standardized calibrations and phantoms, and tabulated. An example of an optimization process was provided in this work for a head-sized phantom. Working with the proper retrigger time is especially relevant for applications requiring short acquisition times (cardiac imaging) and/or high image fidelity at high energy thresholds (K-edge, multi-contrast imaging).
Data availability statement
The raw data supporting the conclusion of this article will be made available by the authors, without undue reservation.
Author contributions
CA: Conceptualization, Data curation, Formal Analysis, Investigation, Methodology, Software, Writing–original draft, Writing–review and editing. CD: Conceptualization, Software, Writing–review and editing. PZ: Resources, Writing–review and editing.
Funding
The author(s) declare that no financial support was received for the research, authorship, and/or publication of this article.
Conflict of interest
Authors CA, CD, and PZ were employed by DECTRIS Ltd.
Publisher’s note
All claims expressed in this article are solely those of the authors and do not necessarily represent those of their affiliated organizations, or those of the publisher, the editors and the reviewers. Any product that may be evaluated in this article, or claim that may be made by its manufacturer, is not guaranteed or endorsed by the publisher.
Footnotes
1In log-log scale, the scaling factor is visualized as an offset.
2Cupping is an artifact where the periphery of an object has a different attenuation value than its center.
References
1. Mannil M, Hickethier T, Von Spiczak J, Baer M, Henning A, Hertel M, et al. Photon-counting CT: high-resolution imaging of coronary stents. Invest Radiol (2018) 53:143–9. doi:10.1097/RLI.0000000000000420
2. Klein L, Dorn S, Amato C, Heinze S, Uhrig M, Schlemmer HP, et al. Effects of detector sampling on noise reduction in clinical photon-counting whole-body computed tomography. Invest Radiol (2020) 55:111–9. doi:10.1097/RLI.0000000000000616
3. Sawall S, Klein L, Amato C, Kachelrieß M. Iodine contrast-to-noise ratio improvement at unit dose and contrast media volume reduction in a whole-body photon-counting CT. Eur J Radiol (2020) 1675:1–26. doi:10.1016/j.ejrad.2020.108909
4. Amato C, Klein L, Wehrse E, Rotkopf LT, Sawall S, Maier J, et al. Potential of contrast agents based on high-Z elements for contrast-enhanced photon-counting computed tomography. Med Phys (2020) 47:6179–90. doi:10.1002/mp.14519
5. Roessl E, Proksa R. K-edge imaging in x-ray computed tomography using multi-bin photon counting detectors. Phys Med Biol (2007) 52:4679–96. doi:10.1088/0031-9155/52/15/020
6. Schlomka JP, Roessl E, Dorscheid R, Dill S, Martens G, Istel T, et al. Experimental feasibility of multi-energy photon-counting K-edge imaging in pre-clinical computed tomography. Phys Med Biol (2008) 53:4031–47. doi:10.1088/0031-9155/53/15/002
7. Symons R, Krauss B, Sahbaee P, Cork TE, Lakshmanan MN, Bluemke DA, et al. Photon-counting CT for simultaneous imaging of multiple contrast agents in the abdomen: an in vivo study. Med Phys (2017) 44:5120–7. doi:10.1002/mp.12301
8. Ren L, Rajendran K, McCollough CH, Yu L. Quantitative accuracy and dose efficiency of dual-contrast imaging using dual-energy CT: a phantom study. Med Phys (2020) 47:441–56. doi:10.1002/mp.13912
9. Amato C, Susenburger M, Lehr S, Kuntz J, Gehrke N, Franke D, et al. Dual-contrast photon-counting micro-CT using iodine and a novel bismuth-based contrast agent. Phys Med and Biol (2023) 68:135001. doi:10.1088/1361-6560/ACDB42
10. Taguchi K, Srivastava S, Kudo H, Barber WC. Enabling photon counting clinical x-ray CT. In: IEEE Nuclear Science Symposium Conference Record; 24 October 2009 - 01 November 2009; Orlando, FL, USA (2009). p. 3581–5. doi:10.1109/NSSMIC.2009.5401823
11. Loeliger T, Bronnimann C, Donath T, Schneebeli M, Schnyder R, Trub P. The new PILATUS3 ASIC with instant retrigger capability. In: IEEE Nuclear Science Symposium Conference Record; 27 October 2012 - 03 November 2012; Anaheim, CA, USA (2012). p. 610–5doi. doi:10.1109/NSSMIC.2012.6551180
12. Hsieh SS, Iniewski K. Improving paralysis compensation in photon counting detectors. IEEE Trans Med Imaging (2021) 40:3–11. doi:10.1109/TMI.2020.3019461
13. Hsieh SS. Coincidence counters for charge sharing compensation in spectroscopic photon counting detectors. IEEE Trans Med Imaging (2020) 39:678–87. doi:10.1109/TMI.2019.2933986
14. Zambon P, Amato C. Pulse pileup model for spectral resolved X-ray photon-counting detectors with dead time and retrigger capability. Front Phys (2023) 11. doi:10.3389/fphy.2023.1205638
15. Ferrari A, Sala PR, Fasso A, Ranft J. FLUKA: a multi-particle transport code. Cern-2005-010, Infn/Tc_05/11, Slac-R-773 (2005). doi:10.5170/CERN-2005-010
16. Battistoni G, Cerutti F, Fassò A, Ferrari A, Muraro S, Ranft J, et al. The FLUKA code: description and benchmarking. AIP Conf Proc (2007) 896:31–49. doi:10.1063/1.2720455
17. Böhlen TT, Cerutti F, Chin MP, Fassò A, Ferrari A, Ortega PG, et al. The FLUKA code: developments and challenges for high energy and medical applications. Nucl Data Sheets (2014) 120:211–4. doi:10.1016/J.NDS.2014.07.049
Keywords: photon-counting computed-tomography, pulse pileup, instant retrigger, monte-carlo simulations, high photon-rates
Citation: Amato C, Disch C and Zambon P (2024) The polychromatic retrigger: a new tool to mitigate pileup in spectral photon-counting computed-tomography. Front. Phys. 12:1445538. doi: 10.3389/fphy.2024.1445538
Received: 07 June 2024; Accepted: 19 August 2024;
Published: 30 August 2024.
Edited by:
Paweł Moskal, Jagiellonian University, PolandReviewed by:
Szymon Niedzwiecki, Jagiellonian University, PolandSushil Sharma, Jagiellonian University, Poland
Copyright © 2024 Amato, Disch and Zambon. This is an open-access article distributed under the terms of the Creative Commons Attribution License (CC BY). The use, distribution or reproduction in other forums is permitted, provided the original author(s) and the copyright owner(s) are credited and that the original publication in this journal is cited, in accordance with accepted academic practice. No use, distribution or reproduction is permitted which does not comply with these terms.
*Correspondence: Carlo Amato, Y2FybG9hbTkzQGdtYWlsLmNvbQ==