- 1School of Electrical Engineering and Automation, Harbin Institute of Technology, Harbin, China
- 2Laboratory for Space Environment and Physical Sciences, Harbin Institute of Technology, Harbin, China
- 3School of Physics, Harbin Institute of Technology, Harbin, China
Dielectric barrier discharges (DBDs) provide a promising technology for generating non-equilibrium cold plasmas at atmospheric pressure. For both application-focused and fundamental research, it is important to explore the discharge mode transition and electron heating mechanism to enable effective independent tuning of key plasma parameters in a DBD system. In this work, we report numerical studies of the effects of single-frequency excitation on atmospheric argon DBDs, which are carried out in the medium driving frequency (MF) range from 50 kHz to 5 MHz by using a one-dimensional hydrodynamics coupling model. The spatio-temporal evolution of particle density associated with the discharge mode transition and electron dynamic behavior has been investigated. By tuning different components of a single frequency, we observe the electron heating behaviors of the individual modes and mode transitions from the Townsend discharge to the glow discharge in the low frequency to the Ω mode and the hybrid mode in the medium frequency to the α-mode and the γ-mode in the radio frequency. The physical analysis is understood based on these fundamental insights into the plasma physics.
1 Introduction
Low-temperature atmospheric pressure discharges are of great interest both on scientific grounds and application fields, such as sterilization [1], deactivation of bacteria/virus/cancer cells [2–5], wound healing [6], exhaust gas cleaning [7], and newly growing fields including special material surface treatment/modification [8, 9], airflow control [10], and semiconductor manufacturing [11],. With increasing interest, it is necessary to gain a deeper and more profound understanding of the underlying physics mechanisms for a broader variety of discharges.
As one of the most common atmospheric pressure discharge forms, dielectric barrier discharges (DBDs) have been widely investigated since the 1980s, and it has been proven to be an efficient way to generate and sustain diffuse discharges when the discharge operates at an applicable driving frequency and applied voltage. In the previous works, studies have mainly focused on low frequency (LF), defined as 30–300 kHz, and radio frequency (RF), defined as 3–30 MHz [12]. There are few studies in the medium driving frequency, especially for 300 kHz to 3 MHz. In the LF driving range, argon DBD typically presents a filamentary discharge, and it features many bright filaments with high temperature, high density, and strong uniformity [13]. As the driving frequency increases, the discharge gives rise to an atmospheric pressure Townsend-like discharge structure, and the electron density grow exponentially from the cathode to the anode, producing a higher density of excited states and noticeable light emission in the anode region [14]. When the driving frequency increases to MHz, the discharge presents a typical atmospheric pressure glow-like discharge structure (glow-like), which features a positive column and a cathode fall that oscillate according to the excitation frequency, and the light intensity is usually maximum close to the cathode [15].
Although the discharge mode transition and dynamic behavior are well-understood for frequencies in both LF and RF ranges, only a few investigations were performed for the frequency between LF and RF, namely, the medium frequency range. Moreover, DBD is a typical strong collisional plasma system; electrons are often not in local thermodynamic equilibrium with the heavy ion or neutral particles due to the disparity of the corresponding masses, and thus, the particles reduce energy exchange [16]. In addition, the electron energy distribution function (EEDF) could exhibit a complex structure modulated instantaneously [17]. Generally, electron heating is associated with the discharge mode. The two major types of electron heating mechanisms under atmospheric pressure discharge are ohmic heating and secondary electron heating. With the former type, it is due to the conversion of the directed momentum gain caused by the electric field into stochastic thermal motion through elastic collisions [18–20]. For the latter, the secondary electrons produced at the electrodes are accelerated by the strong electric field of plasma sheaths. A similar mechanism is for the secondary electrons produced in the Penning or metastable pooling reactions [16]. Unlike low-pressure discharge, sheath stochastic heating or field reversal accelerating the electrons is negligible at atmospheric pressure discharge due to the strong particle collision and small size of the sheath motion (we can estimate by me(2sω)2/2), where me is the electron mass, s is the sheath amplitude, and ω is the driving angular frequency ω = 2πf. Hence, the sheath motion scale of atmospheric pressure discharge is ∼100 μm). However, with a further understanding of the atmospheric pressure discharge, sheath heating with an expansion and a collapse also plays a key role in the electron heating mechanism [21–23].
In contrast with previous group works, the discharge mode transition and non-local electron heating behavior are not specifically focused in the medium frequency range, and the underlying physics has been investigated in this work. The discharge studied in this work sustains atmospheric pressure diffuse argon DBD with the medium driving frequency (MF) range from 50 kHz to 5 MHz. The paper is organized as follows: the simulation model and its analytic method are described in Section 2. Then, the results with corresponding analysis are presented in Section 3, and a short summary and further discussion of the work are given in Section 4.
2 Model description
In this study, the area of the electrode is much larger than the discharge gap, so we can use the one-dimensional fluid model to simulate the discharge process [24]. There are five species mentioned in this model. In the vicinity of this excited level, there are many semblable levels, and they can transform with each other quickly, so we can consider Ar* as metastable particles.
In the fluid model, the density of electrons, average electron momentum, and average electron energy are calculated by calculating the continuity equation of the charged particles and the momentum equation under the drift–diffusion approximation. Electron transport can be calculated to explain the formation and disappearance of particles. The density continuity equation describing the motion of a particle is
The energy continuity equation describing the motion of a particle is
where ne represents the particle density of electrons, nƐ represents the particle energy density, Γe represents the particle flux vector of electrons, and ΓƐ represents the particle energy flux vector [25]. Γe and Γε are defined as
where μe and με are the mobility coefficients. μƐ is defined as
where De and DƐ are the diffusion coefficients of the particles. De and Dε are defined by Einstein’s relation as
where e is the elementary charge, Te is the temperature of the electrons, and kB is the Boltzmann constant.
Re is the electron source term after the impact ionization and recombination reaction of the particle, and Sen represents the energy loss or gain due to inelastic collision:
where xj is the molar fraction, kj is the reaction rate coefficient, is reaction energy loss, Nn is the reaction particle density in the j reaction, and the j reaction can be a positive or negative reaction.
Here, Nn is defined as
for two-body reactions and
for three-body reactions.
The electric field of the discharge gap is generally calculated by the Poisson equation:
where ε0 is the vacuum permittivity. The dielectric material is Mgo whose relative permittivity is εr = 9. ni represents the particle density of ions. The expression for the applied voltage is as follows Eq. 13:
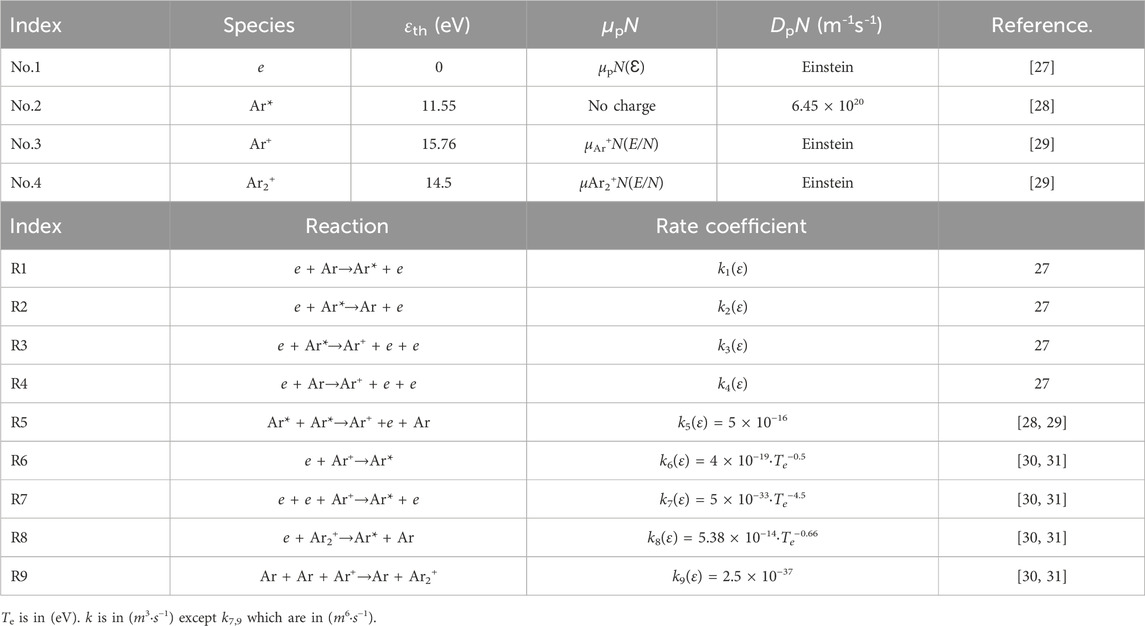
The research involves the chemical reaction and the transport coefficient in the related discharge, as shown in Table 1.
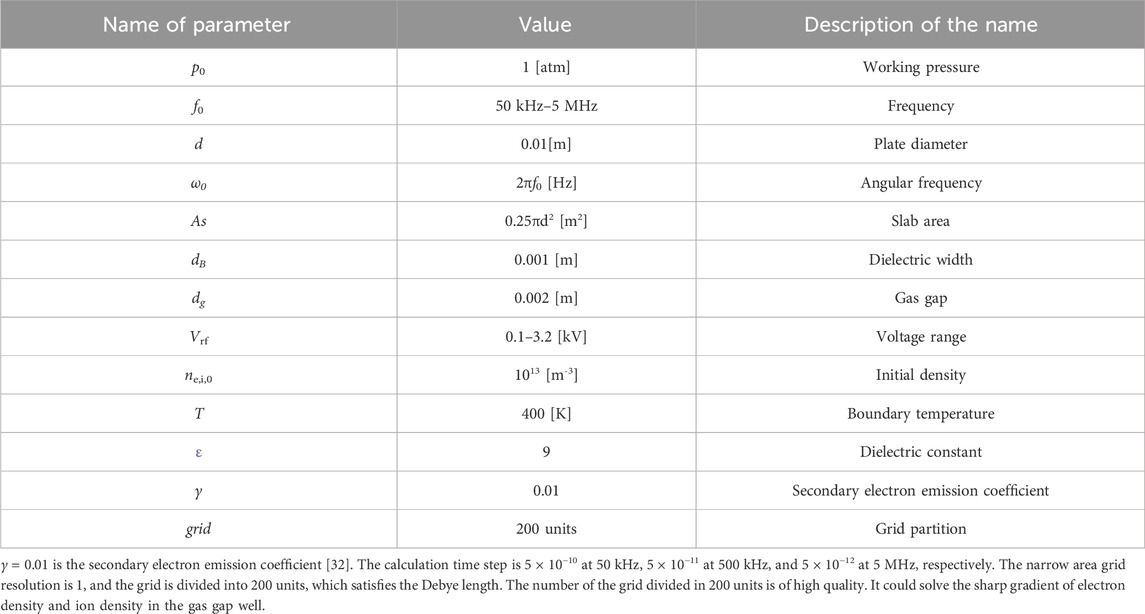
The physical and mathematical parameters studied in the simulation model are shown in Table 2. The model and the calculated waveform of the discharge are shown in Figure 1. The calculated waveform shown, as shown in Figure 1, can be consistent with the results in the literature [26].
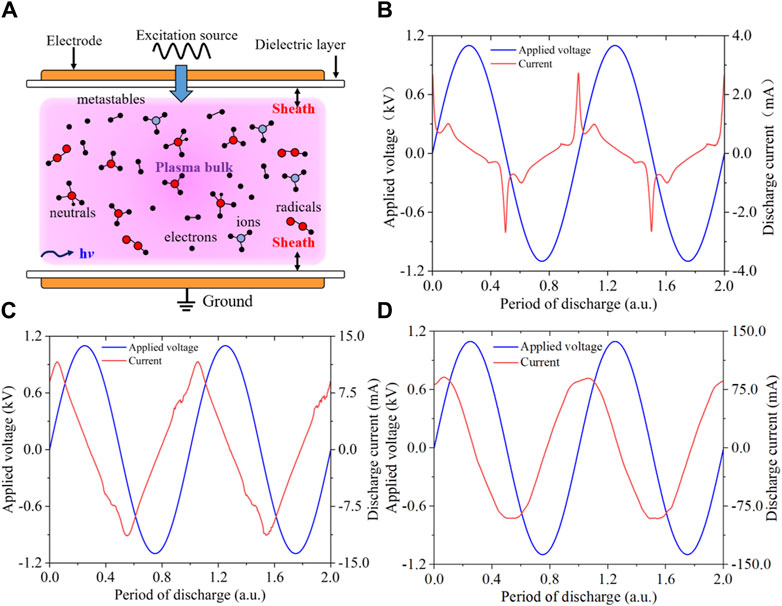
Figure 1. (A) Model sketch of dynamics and typical discharge waveform under different driving frequencies of (B) f = 50 kHz and V = 1100 V, (C) f = 500 kHz and V = 1100 V, and (D) f = 5 MHz and V = 1100 V.
In this work, we use the PARDISO solver to calculate the equations. Based on different types of matrices, it computes different types of row exchange matrix P and diagonal matrix D and exchanges and rearranges the matrix A. The resulting PDAP’D’ matrix is decomposed to include as few non-zero elements as possible. Then, PDAP’D’ is decomposed by LU. According to the results of LU decomposition, the iterative method is used to solve the equations.
3 Results and discussions
The aim of this work is to understand the mode transition and spatio-temporal evolution distribution of particles of a medium frequency from 50 kHz to 5 MHz. To illustrate the extent of different discharge mode transitions, Figure 2 shows the applied voltage and the discharge current evolution for the typical driving frequencies available. The V–I curves are obtained by increasing the applied voltage while maintaining the discharge current. In this model, the plasma is always in the state of diffuse discharge, and the filamentous and instability discharge is not considered. As shown in Figure 2, we can find some important discharge information; the inflections of the V–I curves could be well-interpreted as a major change in the discharge mode transition behavior. No matter what the driving frequency is, in the following part, we will refer to the low-power mode before the first inflection of fRF = 5 MHz (in this work, we fix at V = 500 V), the medium-power mode before the second inflection of fRF = 5 MHz (in this work, we fix at V = 1100 V), and the high-power mode after the third inflection of fRF = 5 MHz (in this work, we fix at V = 2800 V).
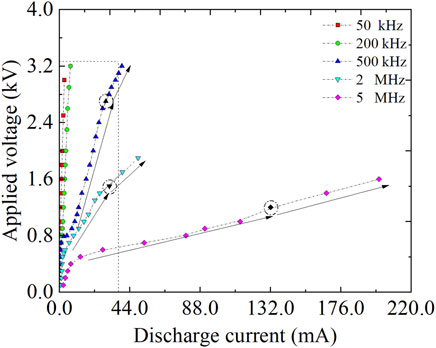
Figure 2. V–I characteristic curves for different driving frequencies from 50 kHz to 5 MHz. Three black filling points indicate the applied voltage, for which different modes in this work and the selected voltage will be discussed in the following section.
Figure 3 shows the spatio-temporal evolution of the electron densities calculated by the drift–diffusion model mentioned in section 2. The characteristic frequencies we select are f = 50 kHz, 500 kHz, and 5 MHz. The applied voltage is V = 500 V, 1100 V, and 2800 V, respectively. As shown in Figure 3, we can observe that the spatial–temporal distribution of electron density has an enormous difference with varying driving frequency and applied voltage. These results indicate that the spatial–temporal distribution of electron density will be re-constituted, and the discharge mode associated with non-local electron heating behavior could be modulated by tuning the applied parameters.
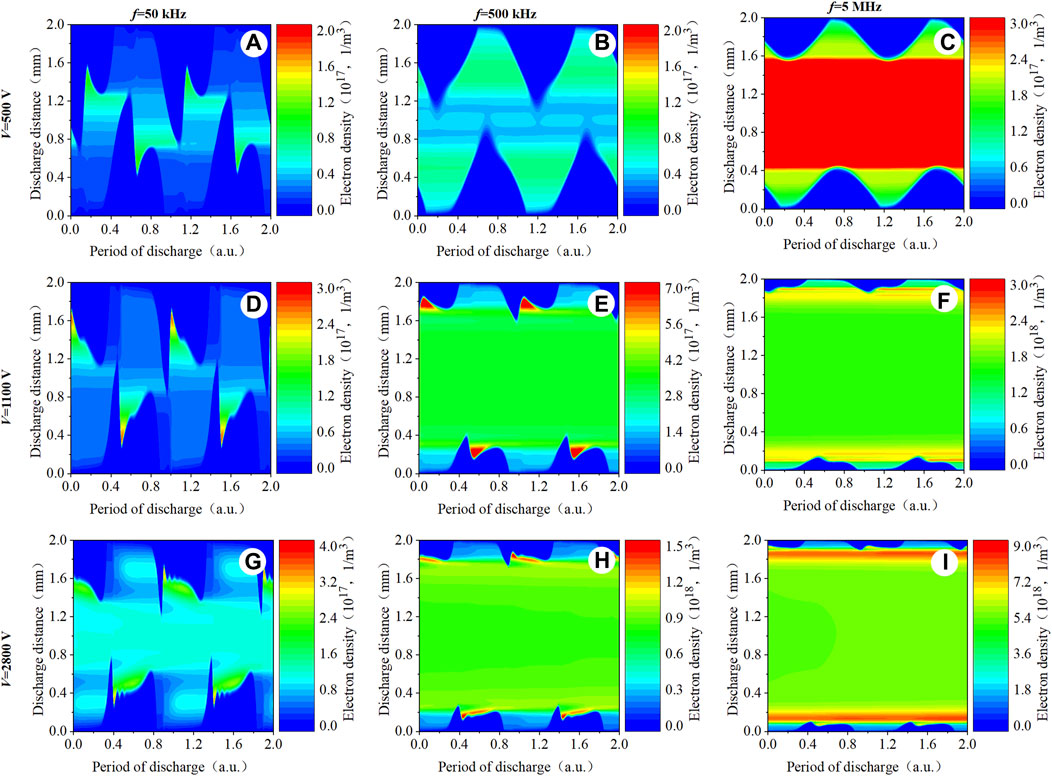
Figure 3. Simulated spatio-temporal distribution evolution of the electron density with different driving medium frequencies with 50 kHz (first column), 500 kHz (second column), and 5 MHz (third column).
3.1 The spatio-temporal evolution of particle density
Figure 4 shows the spatio-temporal distribution of particle density in the low-power mode with driving frequency f = 50 kHz. From the figure, we can observe that the density of electrons and argon ions in the plasma bulk region is significantly higher than that near the surface of the insulating layer, as shown in Figures 4A–C. With the increase in the applied voltage, an electron avalanche is formed, which breaks through the gas and generates a large number of charged particles. The argon in the plasma bulk region is ionized to form the charged particles, which occurs in a negligible amount of transport diffusion [33, 34]. The electron density clearly shows a pulse-like distribution in Figures 4D–F. The argon ion density shows a peak near the transient cathode in Figures 4G–I. The Ar2+ density shows a peak in the plasma bulk region, following the electrode flip, as shown in Figures 4J–L. As shown in Figures 4M–O, the argon metastable density also indicates that the peak is mainly observed near the transient cathode, due to the argon near the cathode and electrons for recombining, i.e., through e + Ar→Ar* + e (R1). The electric field shows a pulse-like distribution with the gradual decrease from the cathode to the anode, as shown in Figure 5. The above results are clearly consistent with the second stage of the Townsend discharge characteristics [12].
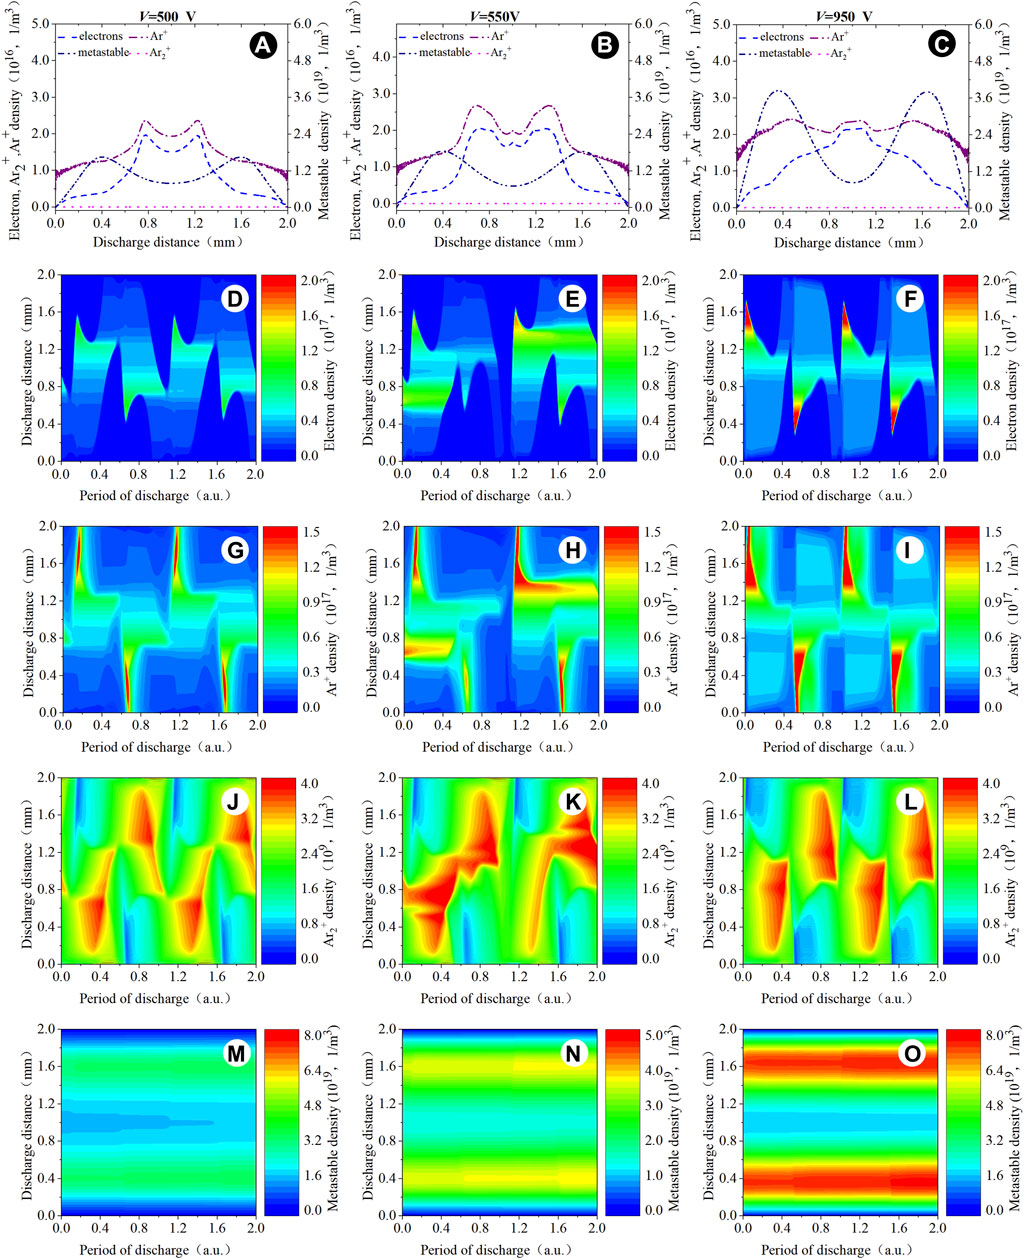
Figure 4. Spatial distribution of (A–C) the computed particle density within two time-averaged periods. Spatio-temporal distribution of (D–F) the computed electron density, (G–I) the computed argon ion density, (J–L) the computed Ar2+ density, and (M–O) the computed argon metastable density. Discharge conditions: f = 50 kHz; V = 500 V, 550 V, and 950 V, respectively.

Figure 5. Spatio-temporal distribution of (A–C) the computed electron field profiles. Discharge conditions: f = 50 kHz; V = 500 V, 550 V, and 950 V, respectively.
Increasing the applied voltage to the high-power condition with a driving frequency of f = 50 kHz, Figure 6 shows the spatio-temporal evolution of the particle density. In the low-power condition, the distribution of the electron density shows the single pulse structure, while in the high-power condition, the electrons show the multi-pulse structure due to the multiple excited states within one discharge period. It means that the discharge breakdown voltage decreased and the multi-breakdown had been formed within one discharge period. The reason for the above result is that with a large number of the charged particles generated in the space, the breakdown voltage greatly reduces in the next period to make the discharge easier.

Figure 6. Spatial distribution of (A, F) the computed particle density within two time-averaged periods. Spatio-temporal distribution of (B, G) the computed electron density profiles, (C, H) the computed argon ion density profiles, (D, I) the computed Ar2+ density profiles, and (E, J) the computed argon metastable density profiles. Discharge conditions: f = 50 kHz and V = 2000 V and 2900 V, respectively.
As the applied voltage increases, the pulse-like distribution presented in Figures 6B, G gradually increases. The argon ion density not only shows the multi-pulse structure but also appears to have a symmetrical distribution in the plasma bulk region, as shown in Figures 6C, H. The density of argon ions in the transient cathode is higher than the density of electrons because the cathode traps argon ions while repels electrons. The density of Ar2+ shows a continuous distribution in the plasma bulk region. In addition, the argon metastable density peak is mainly concentrated in the center of the argon metastable density region by each discharge at the anode, as shown in Figures 6E, J. The main reason for the distributions of four kinds of particle densities is that in the low-frequency condition, the two instantaneous poles turn over slowly. After the occurrence of the breakdown, the charged particles undergo the excitation and recombination, which will increase the space charge and hence reduce the breakdown voltage. Figure 7 shows that the electric field no longer represents a single pulse-like structural distribution but rather a multiple pulse-like distribution. The distribution of the particle density and the electric field under this condition are consistent with the stable and continuous characteristics of the glow-like discharge [12].
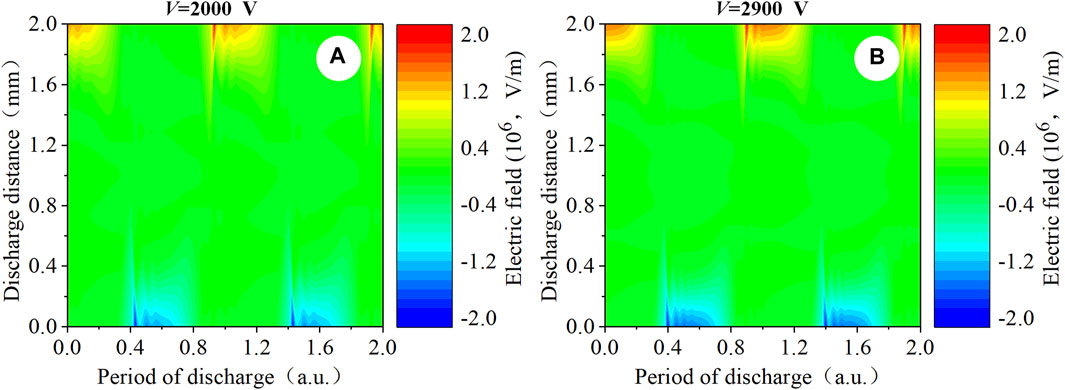
Figure 7. Spatio-temporal distribution of (A, B) the computed electron field profiles. Discharge conditions: f = 50 kHz, and V = 2000 V and 2900 V, respectively.
Increasing the driving frequency to f = 5 MHz and keeping discharge with the low-power mode, the spatio-temporal evolution of particle density is observed, as shown in Figure 8. The particle density shows that the electrons and argon ions are concentrated near the sheath and in the plasma bulk region, while the peak of the argon metastable density is mainly distributed near the surface of the insulating layer and partially distributed in the plasma bulk region. The distributions of the electron density and argon ion density do not change with the flip of the poles but form a continuous and stable domain of the high-density charged particles, and the sheath is gradually expanded, as shown in Figures 8D–F. As the voltage increases, the electrons and argon ions heat transform from the sheath to the plasma bulk region. The Ar2+ density is concentrated in the plasma bulk region. The argon metastable density, as shown in Figures 8M–O, shows a stable and continuous distribution near the surface of the insulating layer. From V = 300 V to V = 390 V, the electron density and ion density increase by 50% in the plasma bulk region with the applied voltage increasing, and the metastable density remains consistent in the sheath. However, from V = 390 V to V = 470 V, the electron density and ion density increase by 30% in the plasma bulk region with the applied voltage increasing, and the metastable density increases approximately 30% in the sheath. The spatial distribution of the metastable density exhibits an expansion to the sheaths, and the reason is that when the argon molecules are ionized to form electrons and ions, the spatial electric field makes the number of electrons increase quickly and accelerates the mobility of ions. Then, it affects the electrons and the ions to form the metastable particle near the sheath. With the increase in the applied voltage, the accelerating effect of the electric field on the particles is significant. A large number of electrons and argon ions occur during the recombination near the sheath to form metastable particles, which makes the density of metastable particles show the expansion to the sheath and a continuous distribution. This is significantly different from the low driving frequency of f = 50 kHz. The main reason is that when the discharge is driven by the radio frequency, after the breakdown occurs, the charged particles have just recombined and the energy of the metastable particle has not completely disappeared while the next breakdown has occurred. As shown in Figure 9, the electric field presents an approximate sinusoidal distribution. The distributions of the above parameters are clearly consistent with the RF-α mode [35].
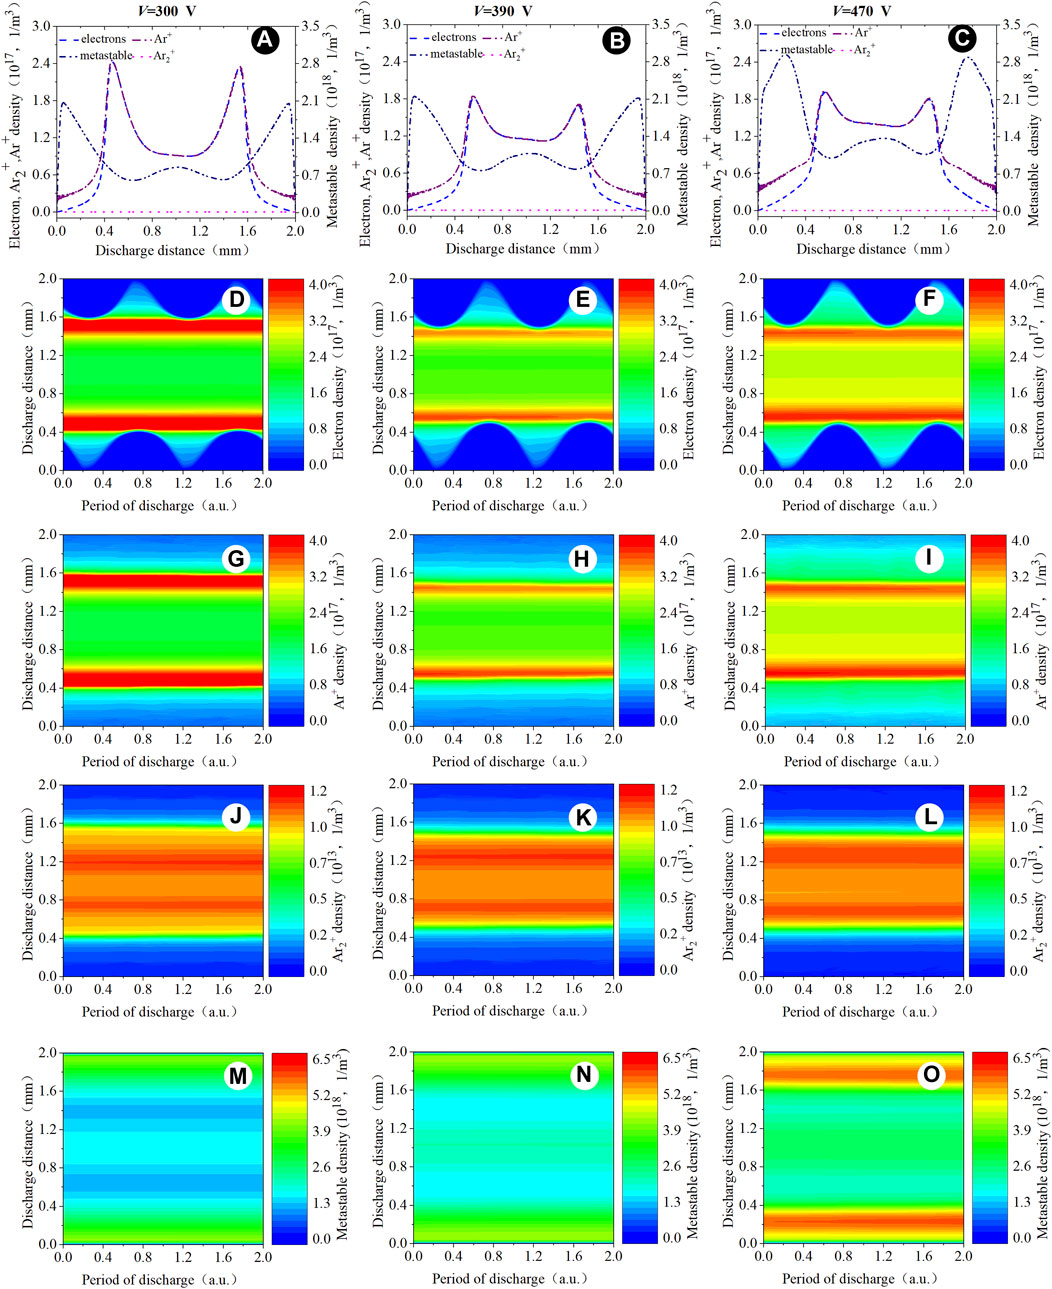
Figure 8. Spatial distribution of (A–C) the computed particle density within two time-averaged periods. Spatio-temporal distribution of (D–F) the computed electron density, (G–I) the computed argon ion density, (J–L) the computed Ar2+ density, and (M–O) the computed argon metastable density. Discharge conditions: f = 5 MHz; V = 300 V, 390 V, and 470 V, respectively.

Figure 9. Spatio-temporal distribution of (A–C) the computed electric field profiles. Discharge conditions: f = 5 MHz; V = 300 V, 390 V, and 470 V, respectively.
Figure 10 shows the spatio-temporal evolution of the particle density in the high-power condition driven by f = 5 MHz. The particle density shows that the peaks of electrons, argon ions, and argon metastable density are mainly concentrated near the surface of the insulating layer, and the Ar2+ density shows a symmetrical distribution in the gas discharge region. In this discharge condition, the particle density shows a stable and continuous distribution near the surface of the insulating layer, and the continuity is better with the increase in the voltage. The electrons, argon ions, and argon metastable density increase substantially near the sheath region, and the space electric field heats three kinds of particles simultaneously in the sheath. As shown in Figure 11, the electric field is clearly compressed to the sheath, which is different from the distribution of the electric field in the α-mode. The distributions of the above parameters are similar to those in the RF-γ-mode.

Figure 10. Spatial distribution of (A, F) the computed particle density within two time-averaged periods. Spatio-temporal distribution of (B, G) the computed electron density profiles, (C, H) the computed argon ion density profiles, (D, I) the computed Ar2+ density profiles, and (E, J) the computed argon metastable density profiles. Discharge conditions: f = 5 MHz; V = 650 V and 1100 V, respectively.
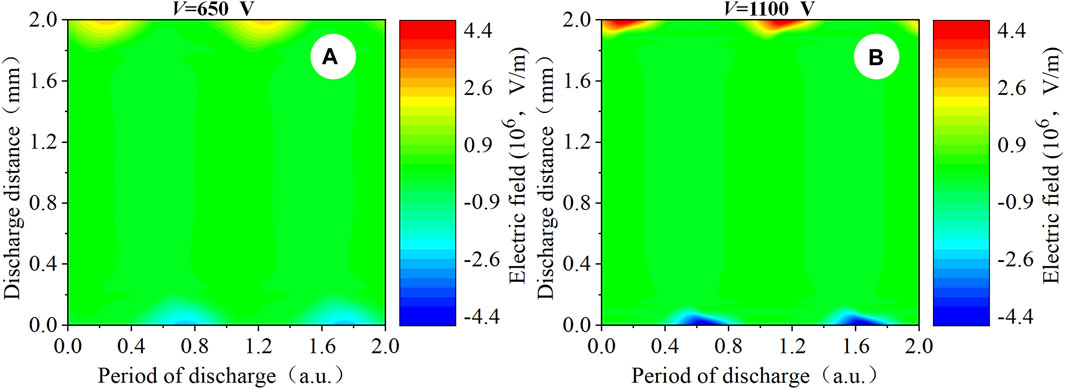
Figure 11. Spatio-temporal distribution of (A, B) the computed electron field profiles. Discharge conditions: f = 5 MHz; V = 650 V and 1100 V, respectively.
Figure 12 shows the spatio-temporal evolution of the particle density by numerical modeling for the low-power condition of f = 500 kHz. In this condition, the distribution of the particle density is not the same as the distribution presented in f = 50 kHz or f = 5 MHz. As the applied voltage increases from V = 500 V to V = 600 V, the electron density, the ion density, and the metastable density increase substantially. According to the spatio-temporal evolution of the electron density, it can be seen that with the increase in the applied voltage, the electron density and argon ion density present a peak near the sheath.
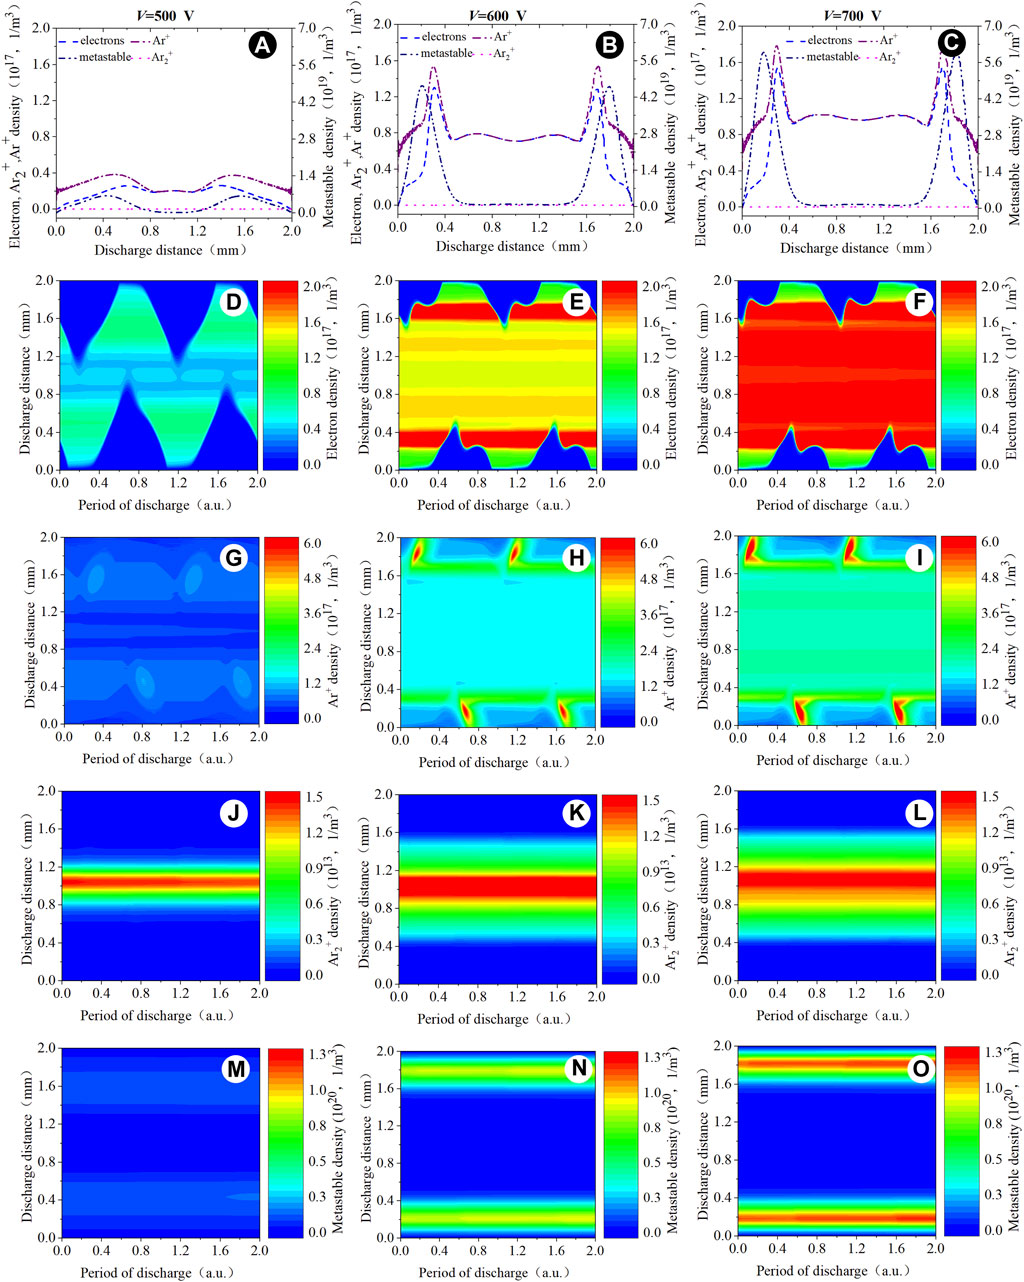
Figure 12. Spatial distribution of (A–C) the computed particle density within two time-averaged periods. Spatio-temporal distribution of (D–F) the computed electron density, (G–I) the computed argon ion density, (J–L) the computed Ar2+ density, and (M–O) the computed argon metastable density. Discharge conditions: f = 500 kHz; V = 500 V, 600 V, and 700 V, respectively.
When the voltage increases from V = 600 V to V = 700 V, the peak of the electron density appears in the plasma bulk region. The increase in the electron density and the ion density is not obvious, while the metastable density shows a substantial increase. The distribution of the metastable density is approximately continuous. It means that when the discharge is in the low-power condition, the electric field shown in Figure 13 heating mechanism plays a key role for three kinds of particles. When the electron density and the ion density increase to a certain degree, the metastable density is mainly concentrated in the sheath so that the metastable particles will be preferentially heated. The difference in energy distribution makes the discharge mode change. This mode is known as the Ω mode in the medium frequency [36].

Figure 13. Spatio-temporal distribution of (A–C) the computed electron field profiles. Discharge conditions: f = 500 kHz; V = 500 V, 600 V, and 700 V, respectively.
As the applied voltage increases, Figure 14 shows that the particle density is similar to the glow-like discharge in the high-power mode of f = 500 kHz. The electron density shown in Figures 14B, G indicates that when the voltage increases, the electron density appears to be a multi-pulse like structure. As can be seen from Figures 14C, H, there is a localized peak in the argon ion density near the cathode. The distributions of the electron density and the ion density are symmetrically distributed in the plasma bulk region. Figures 14E–J shows that the metastable density forms a continuous distribution, which is consistent with the α-mode of RF. In the high-power condition of f = 500 kHz, the growth trend of the increase in three kinds of particles is almost identical, which means that three kinds of particles are heated in the similar way. The space electric field is compressed to the sheath, heating three kinds of particles simultaneously, and the discharge mode no longer transforms. The electric field, as shown in Figure 15, also clearly shows a sinusoidal distribution, which is consistent with the hybrid mode proposed in [36].

Figure 14. Spatial distribution of (A, F) the computed particle density within two time-averaged periods. Spatio-temporal distribution of (B, G) the computed electron density profiles, (C, H) the computed argon ion density profiles, (D, I) the computed Ar2+ density profiles, and (E, J) the computed argon metastable density profiles. Discharge conditions: f = 500 kHz; V = 2000 V and 2500 V, respectively.
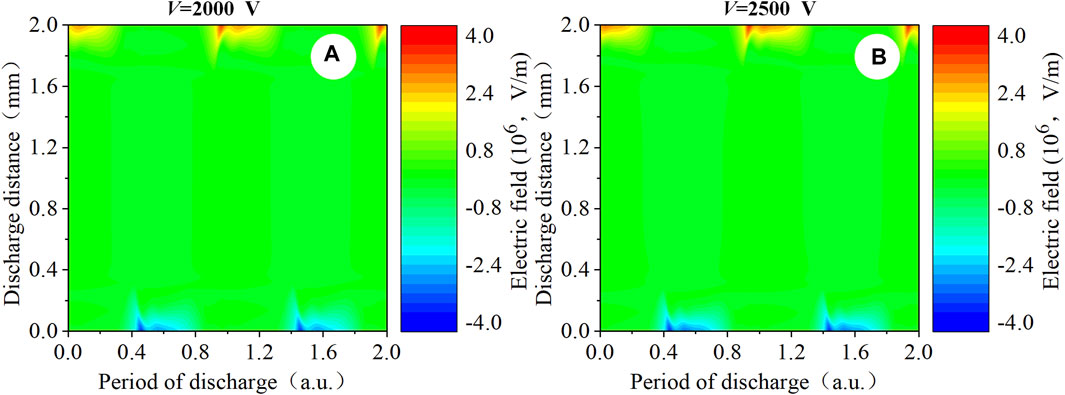
Figure 15. Spatio-temporal distribution of (A, B) the computed electron field profiles. Discharge conditions: f = 500 kHz; V = 2000 V and 2500 V, respectively.
3.2 Electron dynamic behavior and heating mechanism
In the low-power condition at f = 50 kHz, with the increase in the applied voltage, the electron absorption power and the electron impact ionization rate near the transient anode are higher than those on the cathode, and the distribution shows a single-pulse discharge structure in Figure 16. In the low-power condition, due to the low electric field strength, only one breakdown states every half-period. The ohmic heating occurs mainly in the discharge channel, and the heating is relatively weak. The discharge is in the Townsend discharge. Figures 16C, F shows that the discharge state begins to transform from the single-pulse Townsend discharge to the multi-pulse Townsend discharge.
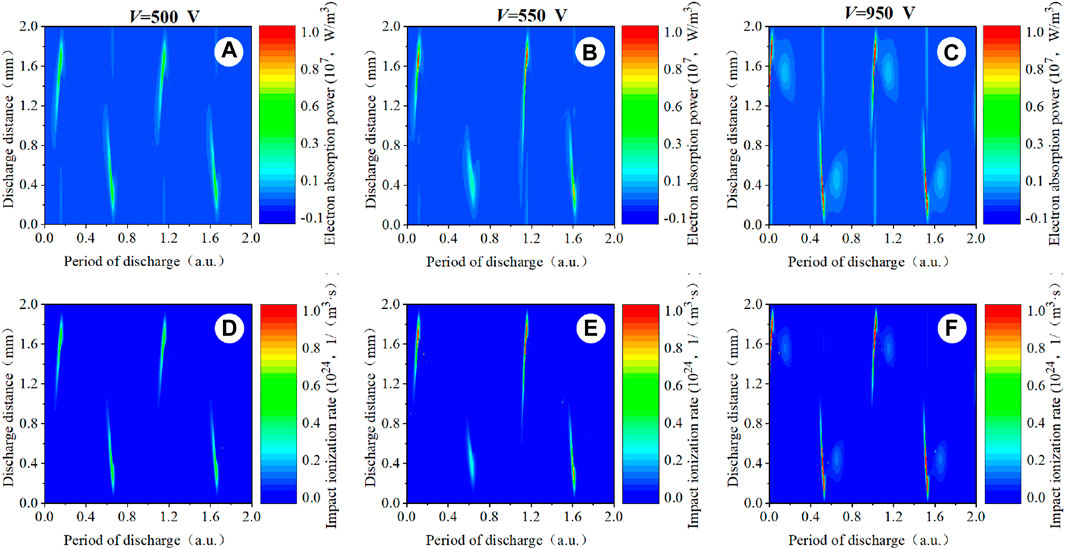
Figure 16. Spatio-temporal distribution of (A–C) the computed electron absorption power profiles and (D–F) the computed electron impact ionization rate profiles. Discharge conditions: f = 50 kHz; V = 500 V, 550 V, and 950 V, respectively.
In the high-power condition of f = 50 kHz, the distribution shows a multi-pulse structure, as shown in Figure 17. Compared with the low-power condition, the discharge excitation transforms from the single-pulse mode to the multi-pulse mode. The electron heating peak value is mainly concentrated in the channel center of each breakdown. The electron absorption power and the electron impact ionization rate are gradually weakened with the discharge phase. The tail of the glow discharge on the cathode in the previous half period almost connects the head on the anode in the next half-period. Electron heating occurs mainly within the sheath and decays with the discharge phase. By increasing the applied voltage, the discharge state transforms from the multi-pulse Townsend discharge into the glow-like discharge.
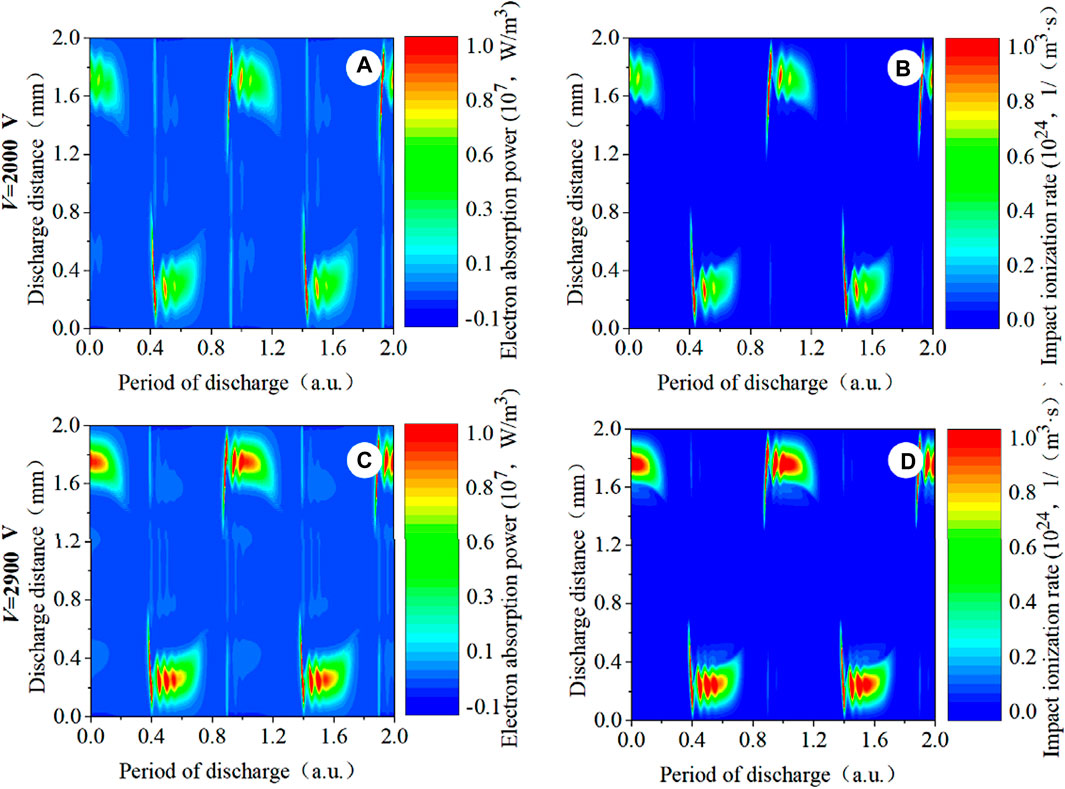
Figure 17. Spatio-temporal distribution of (A, C) the computed electron absorption power profiles and (B, D) the computed electron impact ionization rate profiles. Discharge conditions: f = 50 kHz; V = 2000 V and 2900 V, respectively.
Figure 18 shows the spatio-temporal distribution of the electron absorption power and electron impact ionization rate within two discharge periods of the low-power condition of f = 5 MHz. When the applied voltage is V = 300 V, the electron absorption power and the electron impact ionization mainly occur near both the sheath expansion region and sheath collapse region, respectively. It means that electron heating occurs simultaneously in the sheath expansion region and sheath collapse region at the same time. Electron heating occurs in the sheath collapse region due to field enhancement. This is a typical characteristic in the α-mode. When the voltage increases to V = 390 V, electron heating appears not only in the expansion and collapse of the sheath but also within the sheath. It implies that the discharge begins to transform from the α-mode to the α–γ hybrid mode. When the voltage increases to V = 470 V, electron heating occurs mainly within the sheath. It means that the α–γ hybrid mode transforms to the γ-mode.
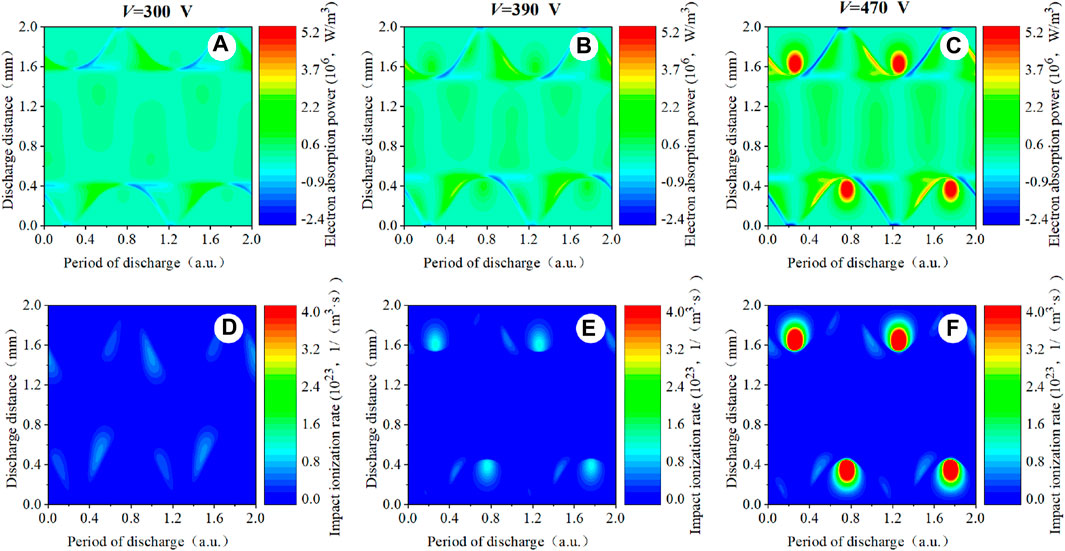
Figure 18. Spatio-temporal distribution of (A–C) the computed electron absorption power profiles and (D–F) the computed electron impact ionization rate profiles. Discharge conditions: f = 5 MHz; V = 300 V, 390 V, and 470 V, respectively.
Under the atmospheric pressure discharge, the collision between particles resists the diffusion of the electrons. The distribution of the electrons is continuous and homogeneous in the plasma bulk region due to the enhanced electric field. As a result, following the collapse of the sheath, the superimposed electric field exerts an accelerating effect on electron velocity, and electron heating occurs in the sheath collapse region [37].
When the voltage increases to V = 650 V, electron excitation mainly occurs within the plasma sheath, which means that the discharge completely enters the γ-mode. The characteristic of the γ-mode is that the ionization excitation process is mainly sustained by the electron avalanche generated in the high-electric field of the sheath. In the high-power condition of f = 5 MHz, Figure 19 shows that alternating heating occurs within the sheath. The formation of the electron avalanche within the sheath is a result that a large number of argon ions bombard the transient cathode to make the secondary electron emission occur, and a large number of the particles recombine near the sheath to generate the electrons after Ar* + e→Ar+ + e + e (R3) and Ar* + Ar*→Ar+ + e + e + Ar (R5). The electron absorption and the electron impact ionization rate are enhanced within the sheath for the above process [37].
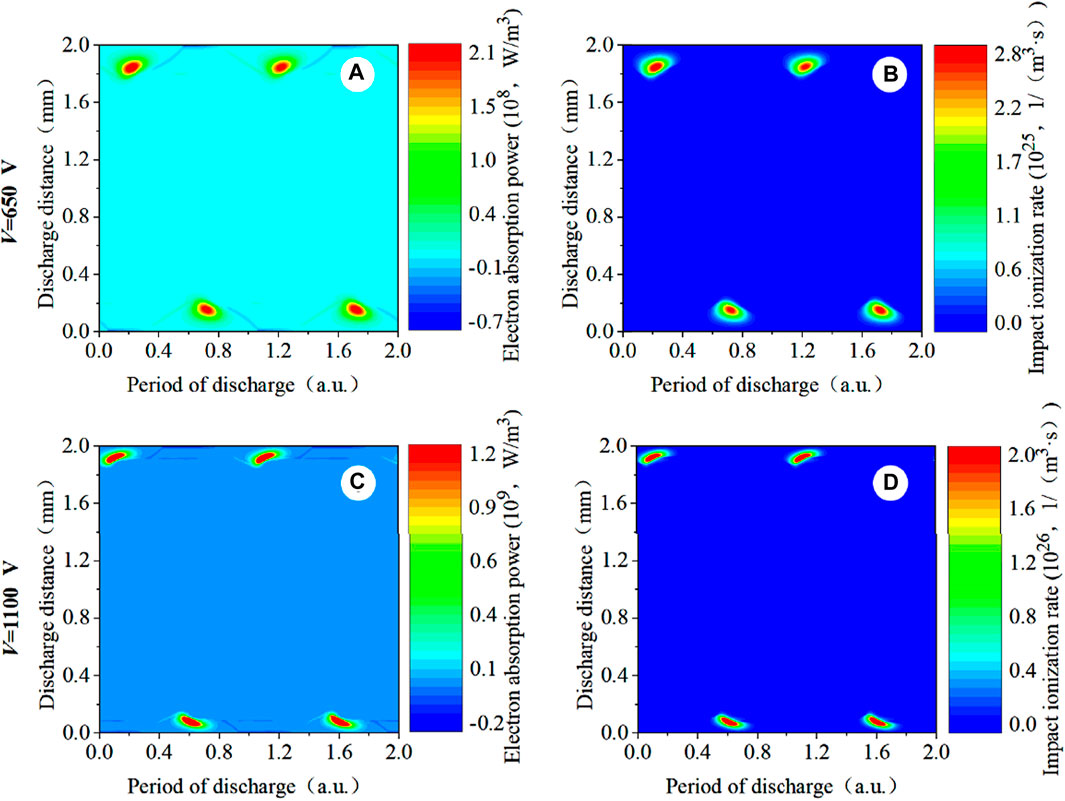
Figure 19. Spatio-temporal distribution of (A, C) the computed electron absorption power profiles and (B, D) the computed electron impact ionization rate profiles. Discharge conditions: f = 5 MHz; V = 650 V and 1100 V, respectively.
In the low-power condition of f = 500 kHz, when the applied voltage is V = 500 V, electron heating occurs mainly in the sheath collapse region, which is more similar to the α discharge mode in the low-pressure mode shown in Figure 20 [38]. When the voltage increases to V = 600 V, electron heating is compressed to the sheath region. The electron impact ionization rate increases substantially by one order of magnitude. Compared with the spatial distribution of the charged particle density in the condition of V = 500 V, it can be observed that the densities of the electron and ion show a large increase both in the plasma bulk region and within the sheath. The average growth rate has doubled in the condition of V = 600 V. The density of the metastable particle only increases significantly within the sheath, while it remains almost unchanged in the plasma bulk region. It implies that as the applied voltage increases, the energy of the electrons is mainly gained by the electric field within the sheath and the collision of the particles. As the voltage increases continuously, additional energy is used to heat the metastable particles but not the electrons and ions. Although the distribution of the particle density and electric field are very similar to these in the Townsend discharge, the heating in the Townsend discharge is mainly near the anode. It is different from the heating in the Ω mode.
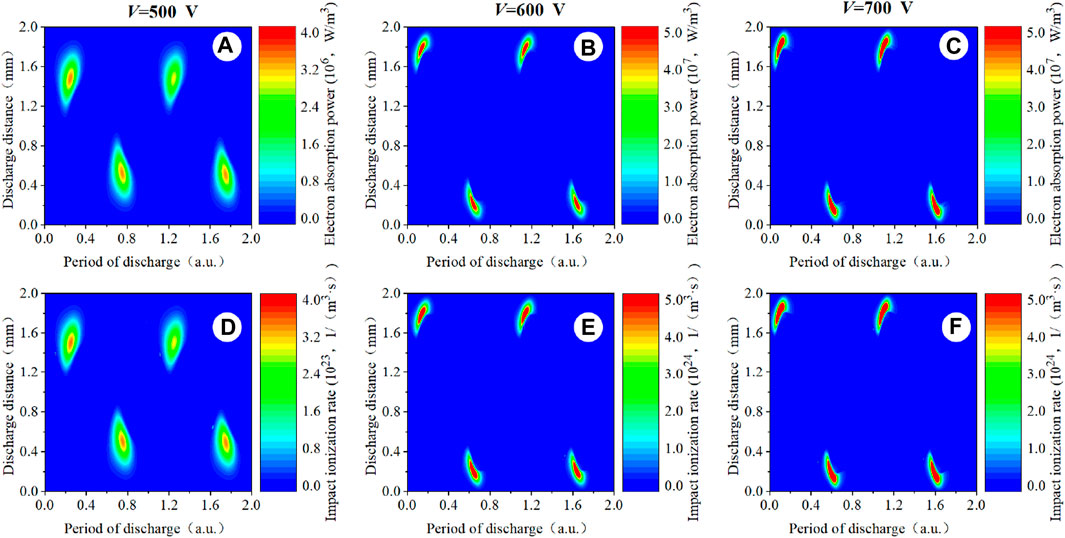
Figure 20. Spatio-temporal distribution of (A–C) the computed electron absorption power profiles and (D–F) the computed electron impact ionization rate profiles. Discharge conditions: f = 500 kHz; V = 500 V, 600 V, and 700 V, respectively.
In the high-power condition of f = 500 kHz, shown in Figure 21 the electron absorption power and electron impact ionization rate occur within the sheath. Electrons are produced mainly in the sheath by collision ionization and secondary electron emission. It also appears that the tail of the glow discharge on the cathode in the previous half period connects to the head of the anode in the next half period. Heating is similar to the glow-like discharge, while the electron maintains itself in a different way. A large number of electrons are heated not only in the sheath but also in the plasma bulk region. There is a high density of electrons and ions in the plasma bulk region. With the increase in the applied voltage, more electrons are bound in the plasma bulk region, which is conducive to the accumulation of ions in the sheath. Because the electric field of the sheath enhances, the electron absorption power and electron impact ionization rate increase. The heating within the sheath is significantly different from the electron heating in the sheath expansion region and the sheath collapse region in the α-mode of RF.
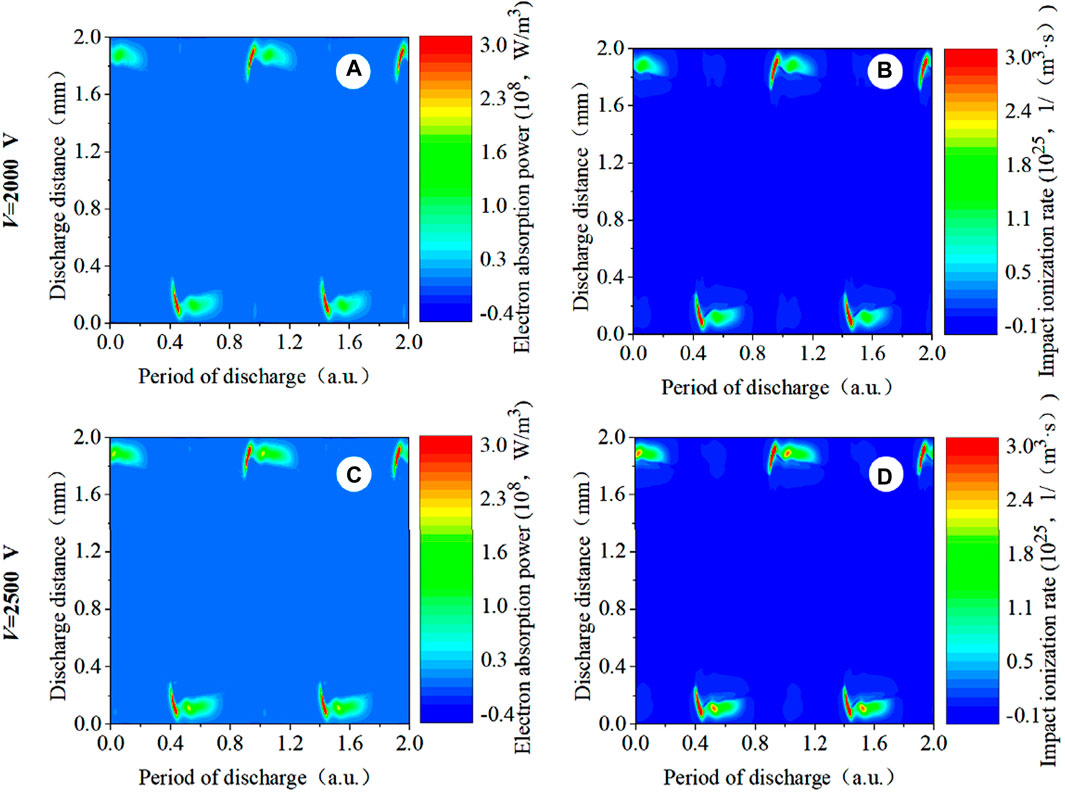
Figure 21. Spatio-temporal distribution of (A, C) the computed electron absorption power profiles and (B, D) the computed electron impact ionization rate profiles. Discharge conditions: f = 500 kHz; V = 2000 V and 2500 V, respectively.
4 Conclusion
In this work, we investigate the classical medium driving frequency of f = 50 kHz, 500 kHz, and 5 MHz, calculated by a one-dimensional fluid model, and study the characteristics of plasma evolution by changing both driving frequency and applied voltage. Then, we analyze the spatio-temporal evolution of particle density associated with discharge mode transition and electron dynamic behavior under these discharge conditions. The main conclusions of this work are as follows:
(a) In the driving frequency of f = 50 kHz, the discharge state transforms from the Townsend discharge to the glow-like discharge. It is similar to the discharge state in the low frequency. When the driving frequency increases to f = 5 MHz, the discharge mode transforms from the α-mode of RF to the γ-mode of RF. It is similar to the discharge mode in the radio frequency.
(b) In the medium frequency of f = 500 kHz, there are two modes, which are different from the modes clearly delineated in the low frequency and the radio frequency. The distribution of the particle density and electric field in the Ω-mode approximate the distribution in the Townsend discharge, while the distribution of heating is different from the distribution in the Townsend discharge. With the increase in the applied voltage, the mode transforms to the hybrid mode. The distribution of the particle density and electric field is similar to the distribution in the glow-like discharge, but the electron maintains itself in a different way.
(c) Ohmic heating can describe all the electronic heating modes. It is proven that ohmic heating is also the main electronic heating mode in the medium frequency. The results show that in the medium frequency of f = 500 kHz, electron heating occurs in the sheath collapse region in the Ω-mode, and electron heating occurs not only within the sheath but also in the plasma bulk region in the hybrid mode.
Currently, the discharge mode in the medium frequency needs to be further clarified. In this work, we summarize the electron heating behaviors and mode transitions. We identify that the discharge is sustained in six different modes: the Townsend discharge and glow-like discharge in f = 50 kHz, the Ω-mode and hybrid mode in f = 500 kHz, and the α-mode and the γ-mode in f = 5 MHz.
Data availability statement
The original contributions presented in the study are included in the article/Supplementary Material; further inquiries can be directed to the corresponding author.
Author contributions
ZhiZ: investigation, software, and writing–original draft. YY: methodology and writing–original draft. QN: investigation, supervision, and writing–review and editing. ZhoZ: conceptualization, funding acquisition, validation, and writing–review and editing.
Funding
The authors declare that financial support was received for the research, authorship, and/or publication of this article. This work was supported by the National Natural Science Foundation of China Grant No. 52377141, Key Laboratory of Engineering Dielectrics and Its Application (Harbin University of Science and Technology), Ministry of Education Grant No. KFM202108.
Conflict of interest
The authors declare that the research was conducted in the absence of any commercial or financial relationships that could be construed as a potential conflict of interest.
Publisher’s note
All claims expressed in this article are solely those of the authors and do not necessarily represent those of their affiliated organizations, or those of the publisher, the editors, and the reviewers. Any product that may be evaluated in this article, or claim that may be made by its manufacturer, is not guaranteed or endorsed by the publisher.
References
2. Aboubakr HA, Gangal U, Youssef MM, Goyal SM, Bruggeman PJ. Inactivation of virus in solution by cold atmospheric pressure plasma: identification of chemical inactivation pathways. J Phys D: Appl Phys (2016) 49:204001. doi:10.1088/0022-3727/49/20/204001
3. Graves DB. Low temperature plasma biomedicine: a tutorial review. Phys Plasmas (2014) 21:080901. doi:10.1063/1.4892534
4. Kim SJ, Chung TH, Bae SH, Leem SH. Characterization of atmospheric pressure microplasma jet source and its application to bacterial inactivation. Plasma Process Polym (2009) 6:676–85. doi:10.1002/ppap.200850001
6. Weltmann KD, von Woedtke T. Plasma medicine—current state of research and medical application. Plasma Phys Control Fusion (2017) 59:014031. doi:10.1088/0741-3335/59/1/014031
7. Brandenburg R. Plasma-based depollution of exhausts: principles state of the art and future prospects. Rijeka, Croatia: INTECH Open Access Publisher (2011). doi:10.5772/20351
8. Ichiki T, Tauro R, Horiike Y. Localized and ultrahigh-rate etching of silicon wafers using atmospheric-pressure microplasma jets. J Appl Phys (2004) 95:35–9. doi:10.1063/1.1630375
9. Penkov OV, Khadem M, Lim WS, Kim DE. A review of recent applications of atmospheric pressure plasma jets for materials processing. Coat Technol Res (2015) 12:225–35. doi:10.1007/s11998-014-9638-z
10. Babayan SE, Jeon JY, Tu VJ, Park J, Selwyn GS, Hicks RF. Deposition of silicon dioxide films with an atmospheric-pressure plasma jet. Plasma Sourc Sci. Technol. (1998) 7:286–8. doi:10.1088/0963-0252/7/3/006
11. Zhang C, Huang B, Luo ZB, Che XK, Yan P, Shao T. Atmospheric-pressure pulsed plasma actuators for flow control: shock wave and vortex characteristics. Plasma Sourc Sci. Technol. (2019) 28:064001. doi:10.1088/1361-6595/ab094c
12. J-S Boisvert Margot J, Massines F. Transitions of an atmospheric-pressure diffuse dielectric barrier discharge in helium for frequencies increasing from kHz to MHz. Plasma Sourc Sci. Technol. (2017) 26:035004. doi:10.1088/1361-6595/aa56a5
13. Li Y, Guo Y, Zhu Y, Sun A. A computational study of pseudo-filamentary nanosecond pulsed dielectric barrier discharge in atmospheric air. Phys Plasmas (2023) 30:033509. doi:10.1063/5.0120800
15. Massines F, Ségur P, Gherardi N, Khamphan C, Ricard A. Physics and chemistry in a glow dielectric barrier discharge at atmospheric pressure: diagnostics and modelling. Surf Coat Technol (2003) 174-175:8–14. doi:10.1016/s0257-8972(03)00540-1
16. Eremin D, Hemke T, Mussenbrock T. Nonlocal behavior of the excitation rate in highly collisional RF discharges. Plasma Sourc Sci. Technol. (2015) 24:044004. doi:10.1088/0963-0252/24/4/044004
17. Iza F, Lee JK, Kong MG. Electron kinetics in radio-frequency atmospheric-pressure microplasmas. Phys Rev Lett (2007) 99:075004. doi:10.1103/physrevlett.99.075004
19. Katsch H-M, Müller KG, Quandt E. Collisional electron heating in a RF discharge. J Phys D: Appl Phys (1993) 26:2168–73. doi:10.1088/0022-3727/26/12/013
20. Turner MM. Collisionless heating in radio-frequency discharges: a review. J Phys D: Appl Phys (2009) 42:194008. doi:10.1088/0022-3727/42/19/194008
21. Zhang ZL, Nie QY, Wang ZB, Gao XT, Kong FR, Sun YF, et al. Numerical studies of independent control of electron density and gas temperature via nonlinear coupling in dual-frequency atmospheric pressure dielectric barrier discharge plasmas. Phys. (2016) 23:073501. doi:10.1063/1.4954647
22. Zhang ZL, Lim JWM, Nie QY, Zhang XN, Jiang BH. Electron heating and mode transition in dual frequency atmospheric pressure argon dielectric barrier discharge. AIP Adv (2017) 7:105313. doi:10.1063/1.5000044
23. Sun Y, Zhang Z, Lim JWM. Enhancement of discharge properties of atmospheric pressure plasma systems through trace radio-frequency oscillation control. Plasma Sourc Sci. Technol. (2021) 30:075018. doi:10.1088/1361-6595/abfd94
25. Hagelaar GJM, Kroesen GMW. Speeding up fluid models for gas discharges by implicit treatment of the electron energy source term. J Comput Phys (2000) 159:1–12. doi:10.1006/jcph.2000.6445
26. Popoli A, Ragazzi F, Pierotti G, Neretti G, Cristofolini A. A Boltzmann electron drift diffusion model for atmospheric pressure non-thermal plasma simulations. Plasma (2023) 6:393–407. doi:10.3390/plasma6030027
27. Avaialble from: https://fr.lxcat.net/data/set_type.php
28. Mihailova DB. Sputtering hollow cathode discharges designed for laser applications. Netherlands: Eindhoven University of Technology (2010).
29. Ellis HW, Pai RY, Mcdaniel EW, Viehland LA. Transport properties of gaseous ions over a wide energy range. Data Nucl Data Tables (1976) 17:177–210. doi:10.1016/0092-640x(76)90001-2
30. Bogaerts A, Gijbels R, Introduction I. Role of Ar2+ and Ar2+ ions in a direct current argon glow discharge: a numerical description. J Appl Phys (1999) 86:4124–33. doi:10.1063/1.371337
31. Piskin T, Podolsky VA, Macheret SO, Poggie J. Challenges in numerical simulation of nanosecond-pulse discharges. J Phys D: Appl Phys (2019) 52:304002. doi:10.1088/1361-6463/ab1fbe
32. Qi B, Xiao T, Zhang T, Wang J, Wang Y, Si J, et al. Numerical simulation of the argon dielectric barrier discharge driven by dual frequency at atmospheric pressure. AIP Adv (2023) 13:065327. doi:10.1063/5.0152839
33. Durocher-Jean A, Desjardins E, Stafford L. Characterization of a microwave argon plasma column at atmospheric pressure by optical emission and absorption spectroscopy coupled with collisional-radiative modelling. Phys Plasmas (2019) 26:063516. doi:10.1063/1.5089767
34. Nayak G, Simeni Simeni M, Rosato J, Sadeghi N, Bruggeman PJ. Characterization of an RF-driven argon plasma at atmospheric pressure using broadband absorption and optical emission spectroscopy. J Appl Phys (2020) 128:243302. doi:10.1063/5.0035488
35. Moon SY, Rhee J, Kim DB, Choe W. α, γ, and normal, abnormal glow discharge modes in radio-frequency capacitively coupled discharges at atmospheric pressure. Phys Plasmas (2006) 13:033502. doi:10.1063/1.2177590
36. Boisvert J-S, Margot J, Massines F. Transitions between various diffuse discharge modes in atmospheric-pressure helium in the medium-frequency range. J.Phys.D:Appl.Phys. (2016) 49:325201. doi:10.1088/0022-3727/49/32/325201
37. Liu DW, Iza F, Kong MG. Electron heating in radio-frequency capacitively coupled atmospheric-pressure plasmas. Appl Phys.Lett (2008) 93:261503. doi:10.1063/1.3058686
Keywords: medium frequency, dielectric barrier discharge, atmospheric pressure plasma, mode transition, electron dynamics behavior
Citation: Zhao Z, Yu Y, Nie Q and Zhang Z (2024) Evolutionary distribution and mode transition in medium frequency from 50 kHz to 5 MHz of argon atmospheric pressure dielectric barrier discharge plasma. Front. Phys. 12:1442177. doi: 10.3389/fphy.2024.1442177
Received: 01 June 2024; Accepted: 31 July 2024;
Published: 20 August 2024.
Edited by:
Shuqun Wu, Nanjing University of Aeronautics and Astronautics, ChinaReviewed by:
Arturo Popoli, University of Bologna, ItalySergey Macheret, Purdue University, IN, United States
Copyright © 2024 Zhao, Yu, Nie and Zhang. This is an open-access article distributed under the terms of the Creative Commons Attribution License (CC BY). The use, distribution or reproduction in other forums is permitted, provided the original author(s) and the copyright owner(s) are credited and that the original publication in this journal is cited, in accordance with accepted academic practice. No use, distribution or reproduction is permitted which does not comply with these terms.
*Correspondence: Zhonglin Zhang, emhhbmdfemxAaGl0LmVkdS5jbg==
†ORCID: Qiuyue Nie, orcid.org/0000-0001-8895-8616; Zhonglin Zhang, orcid.org/0000-0002-3548-8718
 Zhibo Zhao
 Yilin Yu1
 Qiuyue Nie
 Zhonglin Zhang