 An Dedulle
 Niki Fitousi2
 Hilde Bosmans
- 1Department of Imaging and Pathology, University of Leuven, Leuven, Belgium
- 2Research Department, Qaelum NV, Leuven, Belgium
- 3Department of Medical Physics, University Hospitals Leuven, Leuven, Belgium
Introduction: Chest radiography is a frequently performed examination, and therefore, accurate patient dosimetry is important. One means of increasing dosimetric accuracy is through the use of size-specific dosimetry, and the aim of this work was to determine which patients would benefit from such a methodology applied in chest posterior–anterior (PA) projection radiography.
Methods: A database of 44 voxel models was created from CT scans, representing adults with BMI from underweight, normal, overweight, and obese classes. Monte Carlo simulation was performed to generate dose conversion factors for each model. Correlation curves of the dose conversion factors with water equivalent diameter (WED) of the 44 voxel phantoms were obtained. A total of 8,536 chest PA examinations acquired between 2015 and 2019 using three X-ray systems were then retrospectively collected; 4,748 men (median age: 61 ± 21 years) and 3,788 women (median age: 60 ± 23 years). The WED of the patients was estimated from the ratio of detector air-kerma to incident air-kerma, using parameters in the DICOM header of the images. For all patients, a size-specific conversion factor was selected automatically using the relation between WED and dose conversion factor determined for the phantoms. The size-specific organ doses and effective doses were calculated based on these conversion factors, and then compared to the standard effective dose calculation with a paired test.
Results: The lung doses ranged from 7 μGy to 96 μGy and had a good correlation with patient size in terms of WED (p < 0.01, R² between 0.52 and 0.77). The doses for thyroid ranged from 2 μGy to 42 μGy and correlated strongly with the patient size (p < 0.01, R² between 0.65 and 0.85). Breast doses ranged from 2 μGy to 13 μGy, and the correlation with the patient size was weak (p < 0.01, R2 between 0.01 and 0.28). The size-specific effective dose ranged from 4 μSv to 42 μSv. The difference between the size-specific and standard effective dose ranged from −35% to 69% (p < 0.01), with differences exceeding ± 20% for 37% of the cases.
Discussion: In conclusion, the method presented in this study enables automated size-specific dosimetry, within the proposed maximum deviation of ± 20%, and should be considered for routine application.
1 Introduction
Chest posterior–anterior (PA) projection radiography is frequently used for many clinical investigations during diagnosis, treatment, and follow-up. Dose from a chest radiograph is relatively low, which substantially contributes to the collective population dose from medical radiation sources due to the high frequency [1].
One of the influencing factors in the dose received by an individual is the patient weight. The World Health Organization (WHO) estimated that in 2022, 43% of all adults worldwide were overweight and 16% were obese [2]. This has implications for the dose to obese patients, for all of the imaging modalities in modern X-ray imaging, from standard 2D projection radiography through to interventional radiology procedures where accumulated dose can be high. X-ray procedure optimization requires techniques both for estimating the image quality and for obtaining accurate, relevant patient dose values, regardless of body habitus. Furthermore, a means of incorporating patient size information in the dose estimate can enhance outlier analysis in dose management software, improving overall dose management.
Effective dose is a commonly used dose metric that was created for radiation protection purposes [3]. This metric is related to the stochastic risk from exposure to radiation and can be accumulated for the case of successive exposures. The metric was not intended for individual dosimetry or risk assessment [4], which is being calculated for a reference-sized phantom. However, a risk-related quantity for individuals is sometimes required, for example, when trying to compare doses between modalities. Patient size is a confounding factor, and phantoms of varying sizes matching the individual are needed for this. To this end, global metrics, such as detriment-weighted dose [5] or the size-specific effective dose [6], have been proposed, which are calculated from the absorbed doses estimated for different organs [7]. We have chosen to use the latter term in this study.
To achieve a consistent image quality, the automatic exposure control (AEC) of a digital radiography system is usually programmed to maintain the energy absorbed in the X-ray detector at some predefined level [8]. This results in a higher incident dose for patients with a thicker body habitus. In standard large-scale dose surveys, the spread in X-ray tube output, for example, quantified using the kerma-area product (PKA), reflects this size-specific element. Often, a single conversion factor is used to estimate the standard effective dose from the tube output, notwithstanding the fact that previous studies have shown that the patient size is a strong determinant of the absorbed patient dose [9, 10]. The main radiosensitive organs in the primary field of view of a chest radiograph are the lungs, breasts, and thyroid, and these are the focus of this study.
For an absolute risk estimation of adult radiology examinations, the International Atomic Energy Agency (IAEA) requires a dosimetric accuracy of 20% [11]. In order to achieve this 20% accuracy, we examine which patient groups undergoing a chest PA radiograph require patient size to be considered. To our knowledge, automated size-specific dosimetry is not applied to large chest radiography datasets. One of the reasons for this lies in the difficulty of easily obtaining an accurate estimate of patient size, either from the X-ray image itself or from the radiology information system, where patient height and weight are usually not present. This work implements a recently published methodology to estimate the patient size in terms of the water equivalent diameter (WED) [12], using parameters available in the DICOM header [13].
2 Materials and methods
This was a retrospective study that extracted de-identified data from our dose management software database. The use of anonymized retrospective patient data to create the voxel models, from which the dose conversion factors were calculated, was approved by our institutional ethics board.
2.1 Voxel phantom creation
The voxel phantoms were created from the CT scan of patients who underwent a hybrid examination (PET/CT). This examination type was chosen because the CT scan range included the entire head and trunk region in a single acquisition. With the exception of the lymphatic nodes, all of the radiosensitive organs listed in Publication 103 from the International Commission on Radiation Protection (ICRP) [3] were included; lymphatic node dose was calculated from the other segmented organs [14–18].
A total of 44 patients were selected for segmentation, covering a range of adult body mass index (BMI) groups: underweight (including very severely and severely underweight), normal weight, overweight, and obese (moderately, severely, and morbidly). No major truncation of trunk organs was allowed, and the arms were positioned up during the examination. As a means of characterizing patient or model size, the WED [12] over the lung region was calculated.
Segmentation of 27 different organs and tissues was performed either semi-automatically or manually, according to the methods of the eurados school [19]. A physician in training supervised the segmentation and visually checked that the anatomy was complete for each model. The segmentation itself was conducted using ImageJ (National Institutes of Health, USA). The segmented organs include adrenals, bladder, bones, brain, breasts, colon, extra-thoracic region, gallbladder, heart, kidneys, liver, lungs, muscles, esophagus, oral mucosa, pancreas, salivary glands, small intestine, spleen, stomach, thymus, thyroid, skin, uterus or prostate, ovaries or testes, as well as remaining air in the body and remaining (adipose) tissue.
The segmentation proceeded as follows. First, the table and other unwanted objects were removed. The whole body was then segmented by setting a threshold that maintained the patient voxel data and removed the air. Next, the skin was obtained from the whole body using the outline function of ImageJ, giving a skin layer thickness of one voxel (0.98 × 0.98 × 6 mm³). For the segmentation of the lungs and esophagus, the wand (tracing) tool was used. Grey value thresholding was used for the bones, muscles, and remaining air; however, remnants of other tissues that were incorrectly segmented due to similar grey values had to be removed. Other tissues were segmented (semi-)manually: in most cases, the wand (tracing) tool was used to give an initial contour, which was then manually updated to more closely follow the actual tissue contour. The outside of the mouth cavity was used for the oral mucosa and the extra-thoracic region corresponded to the outline of the pharynx and larynx. The other organs were segmented (semi-)manually using the wand tracing tool, which was then manually refined to ensure the complete organ or tissue was accurately delineated. This segmentation process was applied to each CT slice. The segmented tissues were assigned specific pixel (grey) values, and then, all the 27 segmented tissues were combined to form the final voxel phantom. An example of the segmentation procedure on one CT slice in the thorax region is shown in Figure 1.
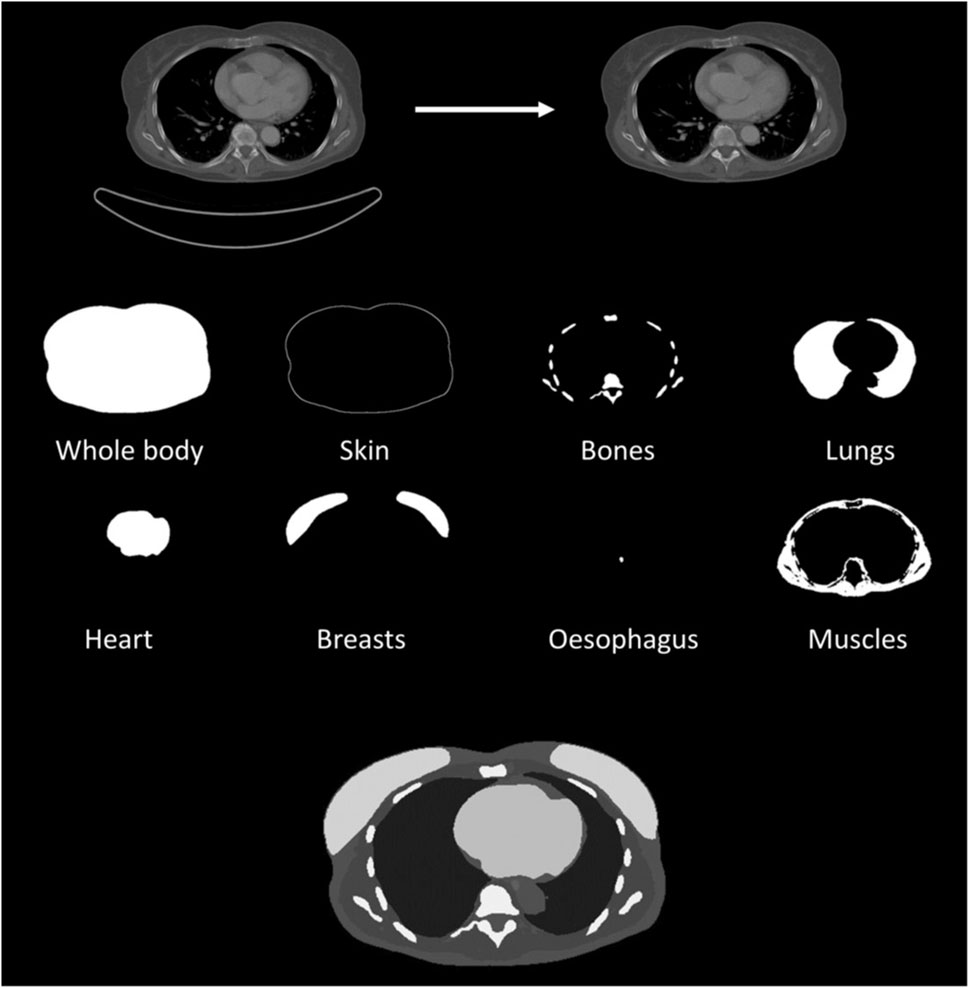
Figure 1. Overview of the segmentation process on one CT slice in the thoracic region of a female patient. It starts on the top left with the original CT slice, and then the table was removed. Next the different tissues were segmented and on the bottom the created phantom slice is shown.
2.2 Monte Carlo simulations
An in-house Monte Carlo framework based on EGSnrc (version 4-2.4.0, National Research Council Canada, Canada) [20] was used for dosimetric calculations. This framework was calibrated and validated for the purpose of this study [21]. Chest PA projection radiography exams with common clinical settings (Table 1) from the three systems were simulated (system A: DRX-Revolution, Carestream, Rochester, New York, United States, system B: Axiom Luminos dRF, Siemens, Erlangen, Germany, and system C: CXDI-11, Canon Medical Systems Corporation, Tokyo, Japan).
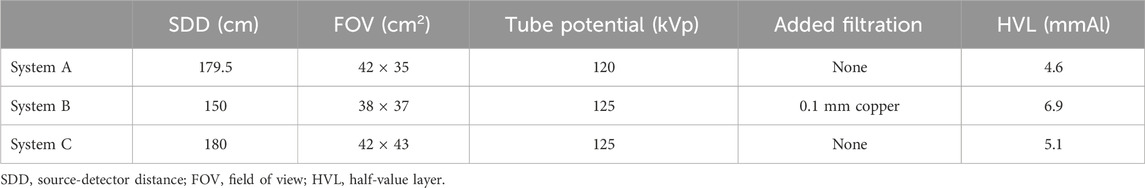
Table 1. Common settings of the three systems used for the Monte Carlo simulation.
The Monte Carlo simulations were carried out with 9 × 10⁸ histories, resulting in coefficients of variation for the organ doses in the primary field of view that were well below 5%; coefficient of variation for most organs was below 1%. The photon-electron transport included Compton and Rayleigh scattering, with photon cut-off of 0.01 MeV and the kerma approximation for the electrons. The National Institute of Standards and Technology (NIST) conducted the XCOM photon cross-sections [22].
The simulations resulted in absorbed organ dose conversion factors (Dcf) per unit of PKA as a function of the patient size, which is characterized using the WED calculated for each voxel phantom. The patient-specific effective dose conversion factors were calculated using the tissue weighting factors from ICRP Publication 103 [3]. The dose conversion factors were then correlated with the phantom size characterized using the WED; correlation between the organ dose conversion factor and the WED was considered significant if p < 0.05. When this condition was satisfied, an exponential regression curve was fitted between the dose conversion factors (Dcf) and WED:
with Dcf as the dose conversion factor of the tissue and α and β as the fitted exponential slope and intercept, respectively. If the correlation was not significant (p > 0.05), the average dose conversion factor of that tissue (<Dcf>) was used. This can be written as follows, using the previous notation:
2.3 Clinical patient data
Dosimetric data from January 2015 to December 2019 for 8,536 chest PA exams from the three X-ray devices listed in Table 1 were retrospectively extracted through the dose management system (Dose by Qaelum, Leuven, Belgium). The extracted data included the standardized exposure index (EI) [23] and the PKA. Additionally, the dose management system provided the standard effective dose, which is obtained by multiplying PKA by a conversion factor (Ecf,ST) for a reference-sized phantom, with
A methodology established in a previous study was used to determine the patient size in terms of the WED [13]. In short, this method estimates the WED from the ratio of the detector air-kerma to incident air-kerma of the chest PA examination, with a maximum deviation of 15% and mean deviation of 4% [13]. The detector air-kerma was calculated from the standardized EI, whereas the incident air-kerma was calculated from the PKA, field of view, and source to detector distance. These parameters were all available in the DICOM header of the images and were extracted using the dose management software. In the present study, we had access to this estimated WED for all patients.
2.4 Size-specific dose calculations
The WED was estimated for patients who underwent a clinical chest PA radiograph on one of the three systems between 2015 and 2019. Size-specific dose conversion factors were calculated using the correlation curves from the Monte Carlo simulations (Section 2.2). The size-specific organ doses (DT) were then calculated by multiplying the size-specific dose conversion factor (Dcf,T) for a specific tissue by the PKA for a radiography examination:
The doses for the lungs, breasts, and thyroid were evaluated, as these are the major radiosensitive organs within the primary field of view.
Additionally, the size-specific effective dose (ESP) was calculated from the size-specific dose conversion factors (Ecf), again based on the patient WED and PKA of the clinical radiograph:
The difference (∆E) between the ESP and the standard effective dose (EST) from the dose management software was then calculated:
3 Results
3.1 Voxel phantoms
The demographics of the 44 created adult voxel phantoms (22 female and 22 male) are shown in Figure 2. Phantom BMI ranged from 12 kg/m2 to 43 kg/m2, whereas the WED over the lung region varied from 18 cm to 38 cm. The voxel phantoms had an in-plane resolution of 0.98 × 0.98 mm2 and a z-resolution of 6 mm.
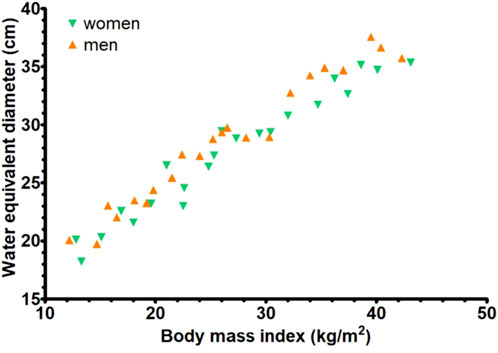
Figure 2. Demographics of the 44 voxel phantoms: the water equivalent diameter of the lung region as a function of the body mass index.
3.2 Dose conversion factors
The dose conversion factors of the size-specific effective dose, lungs, breasts, and thyroid are shown in Figure 3. For both female and male cases, the patient-specific effective dose conversion factors of system A correlated with the WED of the models (p < 0.01 for both female and male), and an exponential curve fit was obtained with an R2 of 0.58 and 0.71, respectively (Figure 3A). Similarly, for the lung and breast dose conversion factors for both female and male cases (Figures 3B,C), the correlation was significant (p < 0.01 for all). The exponential curve fits for female and male phantoms had an R2 of 0.51 and 0.71 for the lung and 0.91 and 0.88 for the breast, respectively. However, for thyroid (Figure 3D), the correlation of conversion factor with the WED of the models was not significant (p = 0.10 for female and p = 0.44 for male). The average dose conversion factor of the models was therefore used to estimate the thyroid dose. Similar behavior of the different dose conversion factors was found for systems B and C (Figure 3). The statistical parameters for all three systems, along with the fit parameters, are provided in Table 2.
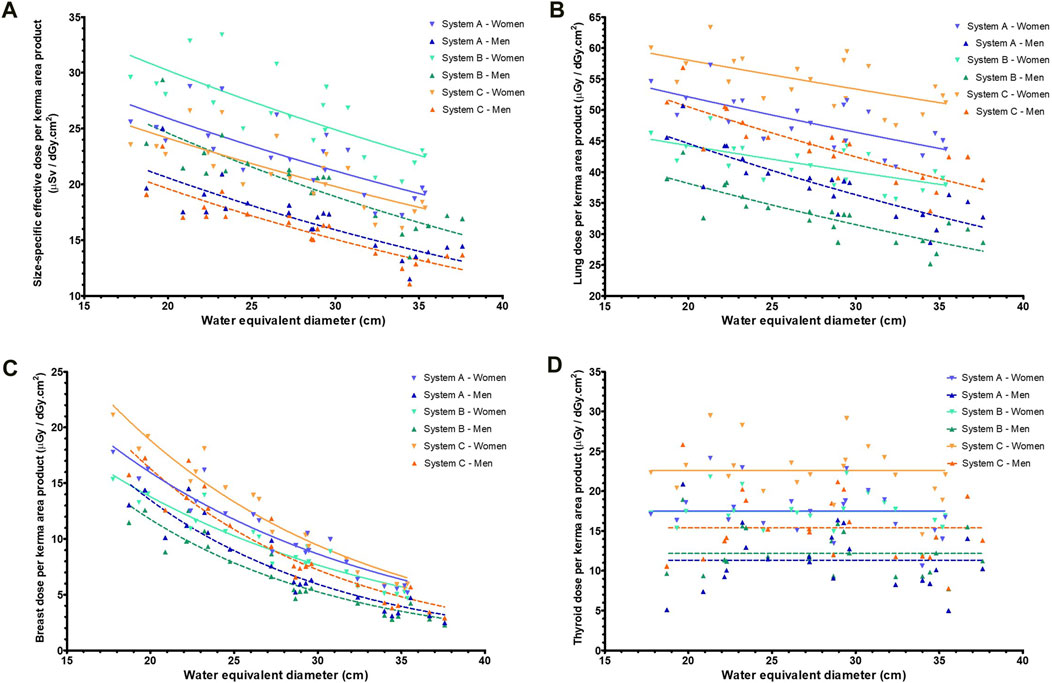
Figure 3. The dose conversion factors (dose per unit of kerma area product) for the three systems (women and men) as a function of the water equivalent diameter for (A) patient-specific effective dose, (B) lung dose, (C) breast dose and (D) thyroid dose.
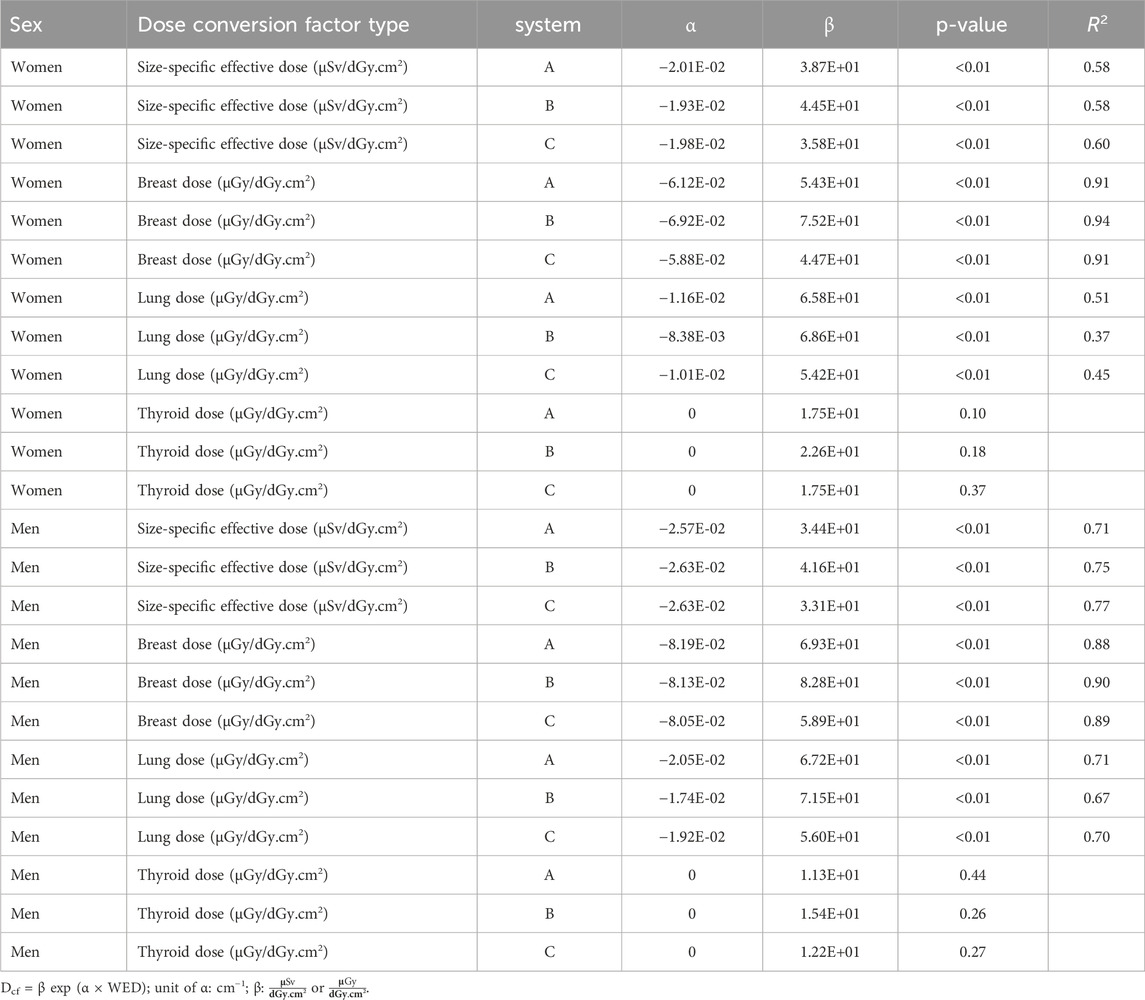
Table 2. Exponential fit values (α and β) for the dose conversion factors (Dcf) as a function of the water equivalent diameter (WED) for three systems.
3.3 Clinical patient data
The WED was estimated for an initial dataset of 8,781 patients. Two controls were applied to these results: PKA was plotted as a function of the WED and the EI was plotted as a function of the PKA. Datapoints that appeared as outliers on these graphs were examined based on the thumbnail images available in the dose management system. These thumbnail images look like screenshots of the original images and are generated by the dose management system prior to the deletion of the complete image information. Evaluation of the outliers led to the exclusion of 245 patients or 3% of the data. A total of 44% of these cases were outliers due to incorrect positioning (a large part of abdomen included), 36% were lateral images instead of PA, and 10% were a different exam type (mainly pelvis or abdomen). The thumbnail images were not available in 8% of the cases and thus could not be reviewed. In 2% of the cases, the PKA was high, indicating that the dose area product meter was not reset properly, as the tube current time product was not particularly high for these exams.
The median age (± interquartile range) of all 8,536 included patients (56% male and 44% female) was 61 ± 22 years. A total of 2,671 examinations were from system A (median: 62 ± 23 years, 1494 male), 3,588 from system B (median: 59 ± 21 years, 57% male), and 2,277 from system C (median: 64 ± 23 years, 52% male). The estimated WED ranged from 15 cm to 38 cm; the median WED was 24 ± 4 cm for female and 27 ± 4 cm for male cases. The PKA of the examinations had a median value of 0.51 ± 0.19 dGy.cm2 for female and 0.64 ± 0.27 dGy.cm2 for male cases in system A. These values were 0.39 ± 0.21 dGy.cm2 for female and 0.45 ± 0.24 dGy.cm2 for male cases in system B and 0.35 ± 0.17 dGy.cm2 for female and 0.48 ± 0.19 dGy.cm2 for male cases in system C (Table 3). The differences in PKA are mainly due to the differences in the setup of the different devices (Table 1). The PKA correlated with the estimated WED (p < 0.01 for all), with the higher PKA for larger water equivalent diameter, as expected when the automatic exposure control is used [8].
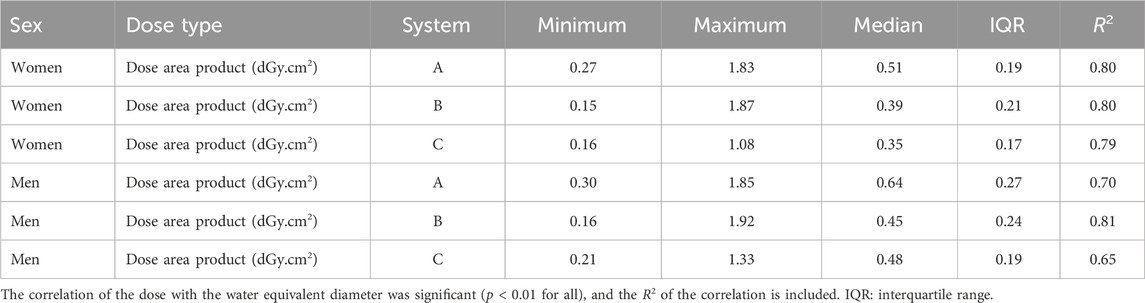
Table 3. Statistical parameters of the clinical examination parameters of the three systems (minimum, maximum, median, and interquartile range).
3.4 Size-specific organ doses
Including all three systems, the lung dose ranged from 7 µGy to 96 µGy (median: 21 ± 10 µGy), the breast dose ranged from 2 µGy to 13 µGy (median: 5 ± 2 µGy), and the thyroid dose from 2 µGy to 42 µGy (median: 7 ± 4 µGy). The values for the different systems separately are included in Table 4. Among the different systems, the order of magnitude of the doses was the same; however, an ANOVA test showed that for each organ, the doses between the systems were significantly different (p < 0.01). This is due to differences in conversion factors (Table 2), which in turn reflect differences in the system setup (Table 1), and the overall dose operating points of the three systems (Table 3).
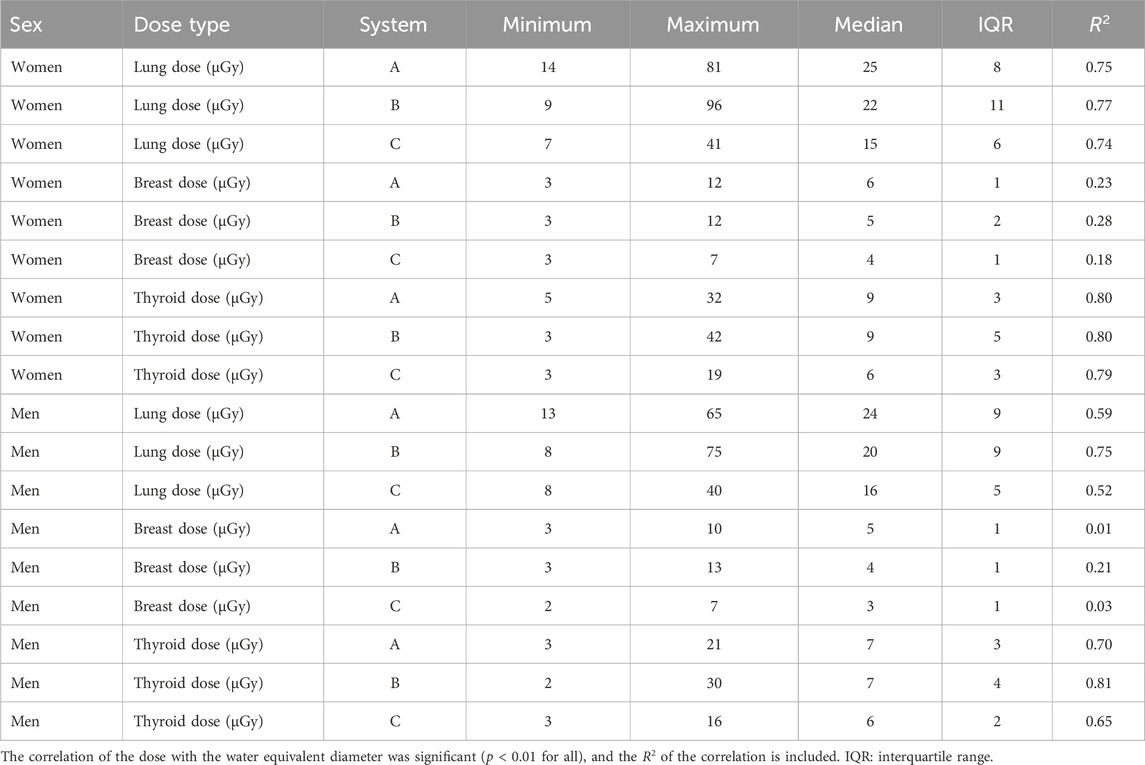
Table 4. Statistical parameters of the organ doses of the three systems (minimum, maximum, median, and interquartile range).
The organ doses are plotted as a function of the estimated WED in Figure 4. The lung, breast, and thyroid doses correlated with the WED (p < 0.01 for all), whereas correlation was weaker for the breast dose (R2 between 0.01 and 0.18) than that for the lung and thyroid doses (R2 between 0.52 and 0.81) (Table 4).
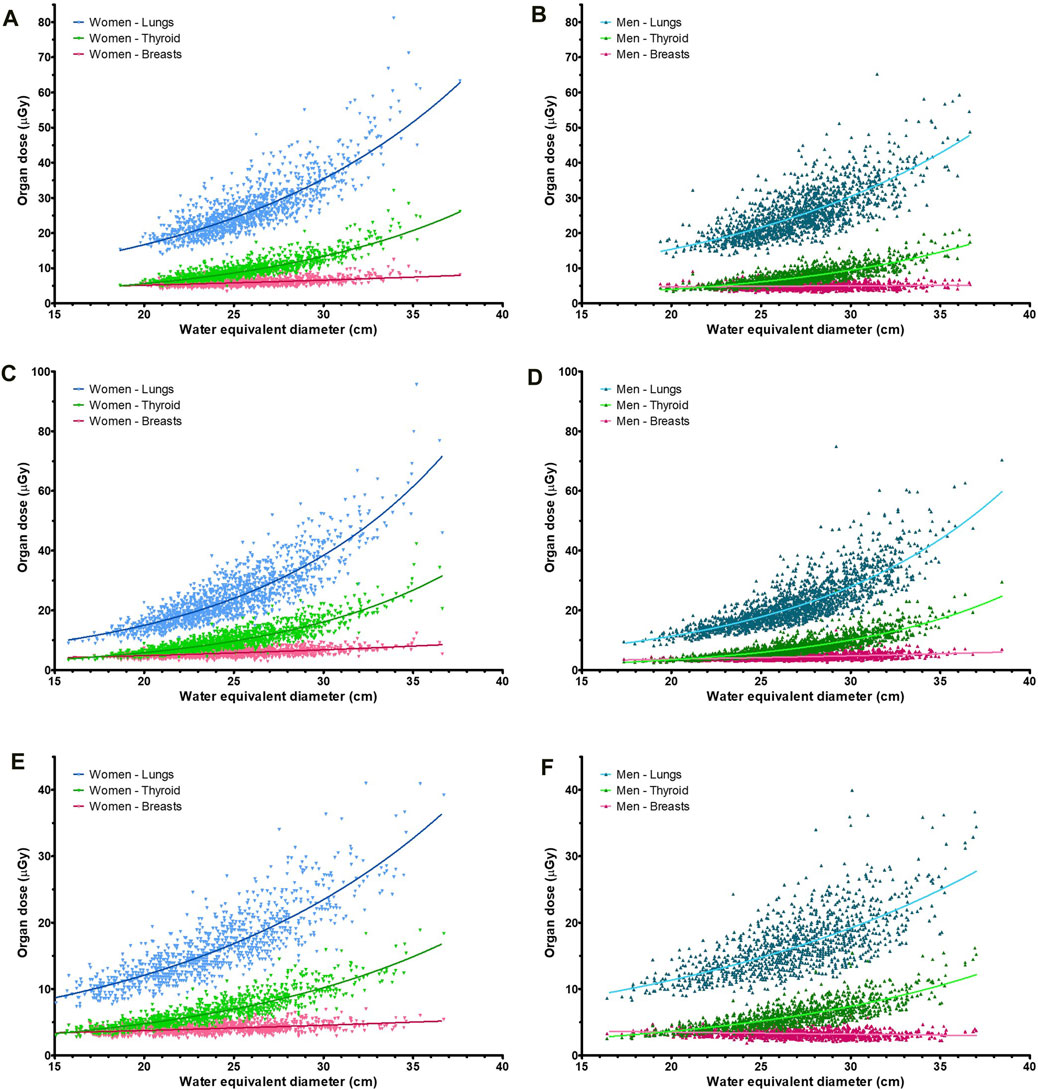
Figure 4. Organ doses for the lungs, breasts, and thyroid of the three systems (A–C) for both women and men, with (A) System A, women; (B) System A, men; (C) System B, women; (D) System B, men; (E) System C, women; (F) System C, men.
To study the relative impact of the patient size, the doses were normalized to the mean (organ) dose of the respective system, and this was repeated for both sexes. As shown in Figure 5, the proportionality of dose with the WED depends on the organ type. For thyroid, there was no size-specific conversion curve but simply a fixed value, and therefore, the proportionality follows the kerma-area product. The dose to the lungs increased more gradually with the increasing WED, and the breast dose increased even more slowly. The male breast doses of system C even fell as the WED increased (Figure 5F).
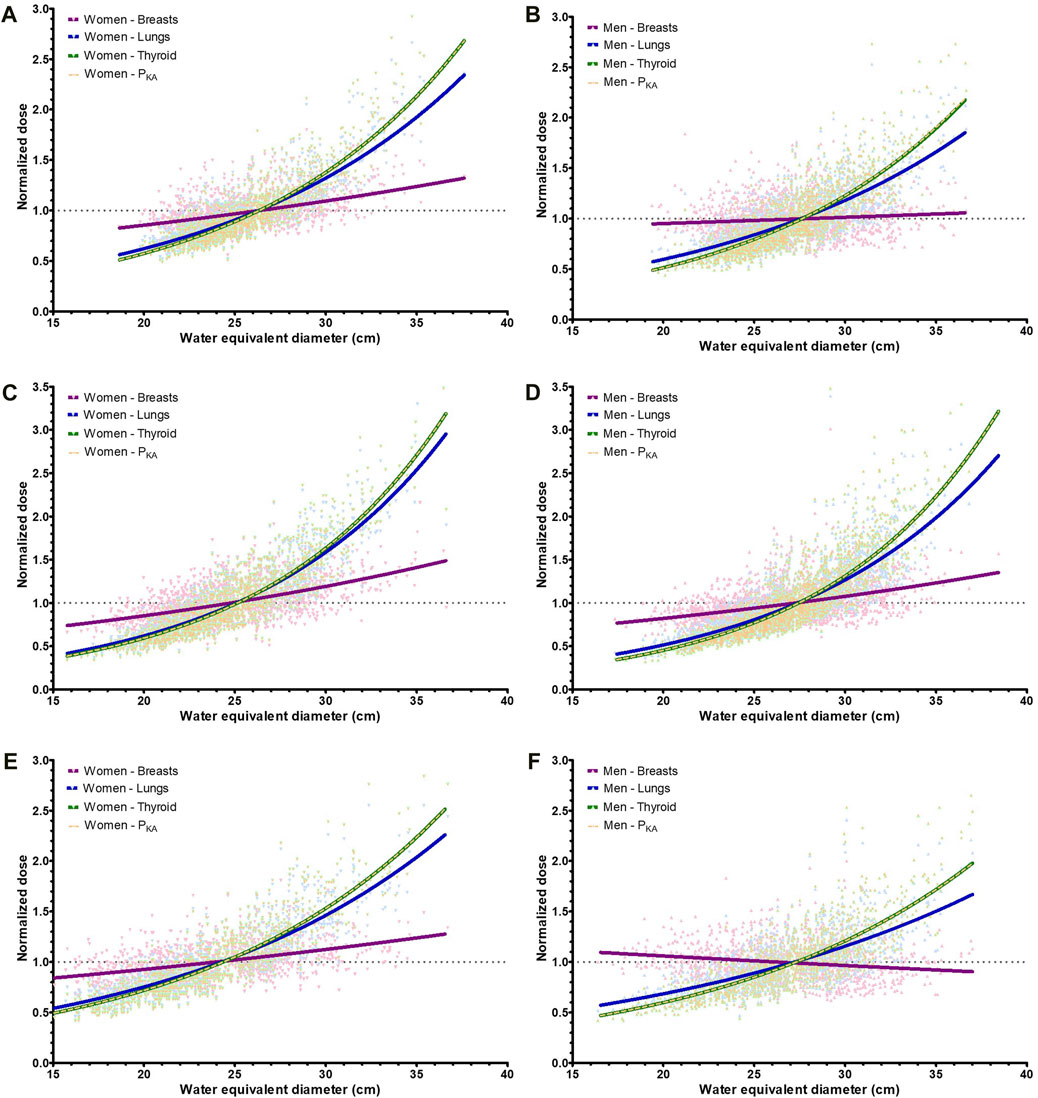
Figure 5. Curves of the normalized (organ) doses (to the mean) for the lungs, breasts, thyroid, and dose area product (PKA) of the three systems. (A) System A, women (B) System A, men (C) System B, women (D) System B, men (E) System C, women (F) System C, men.
3.5 Effective dose
For female patients, the size-specific effective dose ranged from 4 µSv to 42 µSv, with a median of 10 ± 5 µSv. For male patients, the range was from 4 µSv to 34 µSv, with a median of 9 ± 4 µSv. The standard effective dose for female cases ranged from 3 µSv to 40 µSv (median: 9 ± 5 µSv), with a range from 3 µSv to 41 µSv (median: 11 ± 6 µSv) for male cases. Detailed statistics for each device are shown in Table 5.
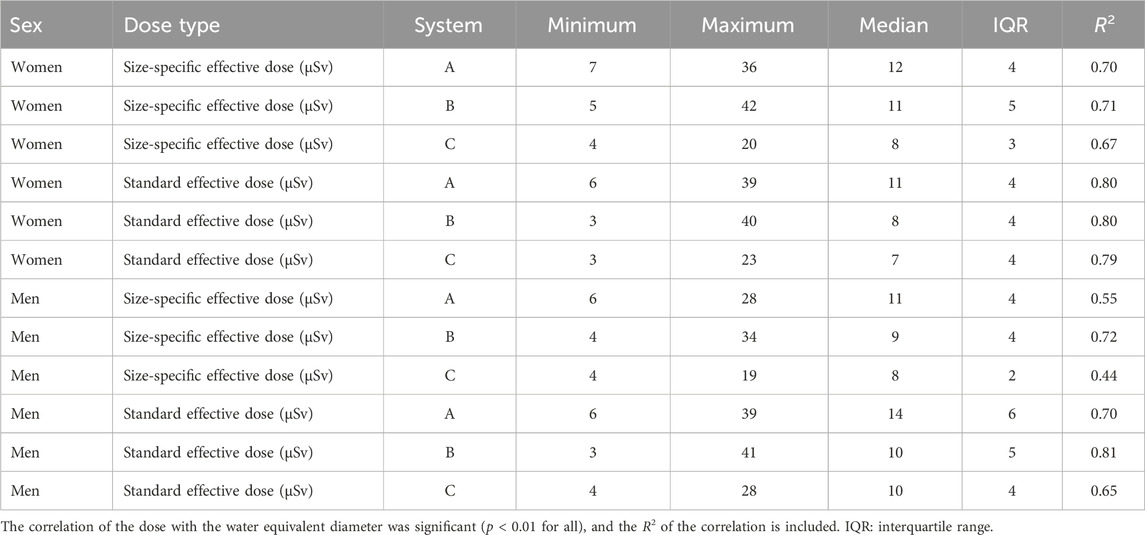
Table 5. Statistical parameters of the effective doses of the three systems (minimum, maximum, median, and interquartile range).
Although the median values of the size-specific and standard effective dose were similar, a paired test on each system showed significant differences between the distributions (p < 0.01 for all). This is illustrated in Figure 6, which shows the patient-specific differences (∆E). These differences ranged from −35% to 22% (median: −12% ± 16%) for female and from −20% to 69% (median: 16% ± 23%) for male patients. In 37% of the cases, the difference was outside the ±20% range.
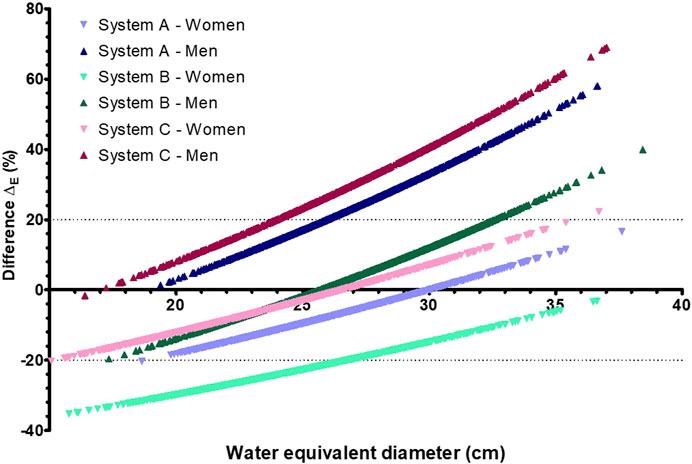
Figure 6. Difference (∆E) in effective dose between the size-specific effective dose and standard effective dose as a function of the water equivalent diameter for three radiography systems (A–C).
Both the size-specific and standard effective doses correlated with the WED (p < 0.01 for all three systems, R2 between 0.44 and 0.81). A full set of results are presented in Table 5. The mean-normalized dose curves are shown in Figure 7. For the standard effective dose, the normalized dose curve followed the normalized kerma-area product curve (Figure 7). This is due to the use of a single conversion factor multiplied by the kerma-area product of the exam to obtain the standard effective dose. The slope of the standard effective dose was steeper than that for the size-specific effective dose, when plotted as a function of the WED. This shows that differences between the size-specific and standard effective dose were relatively larger for patients with smallest and largest WEDs (Figure 6).
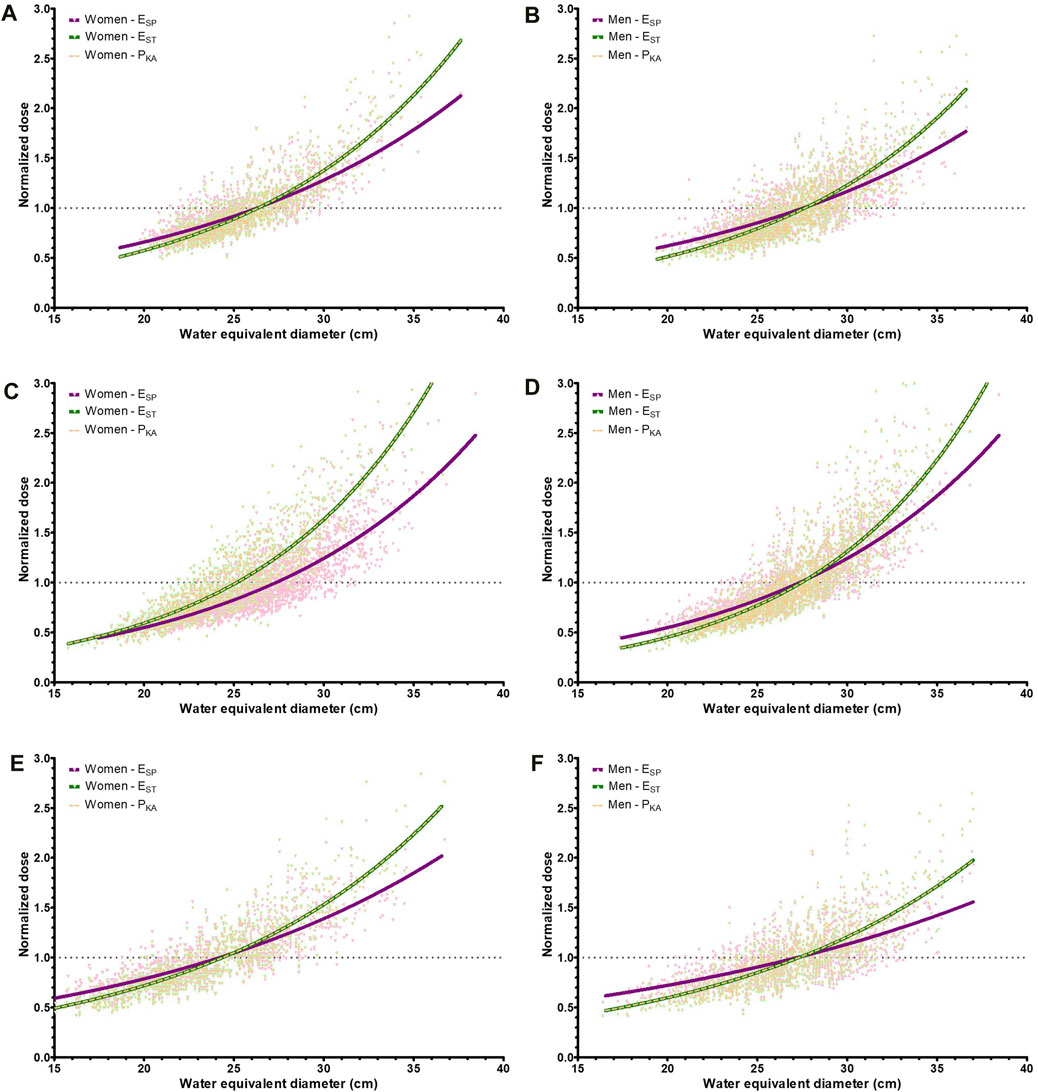
Figure 7. Caption: Normalized dose curves as a function of the water equivalent diameter for the size-specific effective dose (ESP), standard effective dose (EST), and dose area product (PKA). (A) System A, women (B) System A, men (C) System B, women (D) System B, men (E) System C, women (F) System C, men.
4 Discussion
A number of studies have shown the influence of patient size on the dose conversion factors for projection radiography [9, 10, 24]. In this retrospective study, a large dataset of examinations performed on three X-ray systems was used to practically implement a patient size-specific method. First, a patient size-related metric was estimated using a recently published methodology that only required radiography DICOM information [13]. This estimated patient size, that is, the WED, ranged from 15 cm to 38 cm for the patient dataset.
The patient-specific effective dose and lung and breast dose conversion factors correlated with patient size on all three systems (p < 0.01 for all), and an exponential curve fit between the conversion factors and WED was obtained. The conversion factors were lower for larger-sized patients due to the shielding of internal organs by adipose tissue and the larger volume of some organs. This effect is less pronounced in the neck region, explaining the weak correlation between thyroid dose conversion factors and the patient WED. This is consistent with thyroid dose conversion factors found in the literature [10].
The kerma-area product for all examinations ranged from 0.15 dGy.cm2 to 1.92 dGy.cm2. As expected, the use of automatic exposure control (AEC) results in a correlation between the kerma-area product and patient size [8], and therefore, both organ dose and effective dose will vary with WED. This fundamental principle was the basis for the estimation of the WED. The size-specific organ doses showed a large variation with patient WED, reflecting the variation in the kerma-area product and the size-specific conversion coefficients.
The median doses to the lungs, breasts, and thyroid of the patients were 21 ± 10 µGy, 5 ± 2 µGy, and 7 ± 4 µGy, respectively. These doses are consistent with values in the literature [25, 26]; however, literature organ doses are generally obtained using a single conversion factor and not adjusted for patient size as in this work. The dose to the lungs and thyroid correlated strongly with the patient WED (p < 0.01 for all three systems, R2 between 0.52 and 0.81), with higher doses for thicker patients. The thyroid dose curve as a function of water equivalent diameter was steeper than the lung dose curve. For breasts, which are located close to the detector during a chest PA radiography, the correlation was weaker (p < 0.01 for all systems, R2 between 0.01 and 0.28). This is due to the position of the breasts on the beam exit side, where the air-kerma becomes strongly linked to the target value of the AEC set for the system. When the organ dose was plotted as a function of the patient WED, the slope was shown to depend on the (anterior–posterior) position of the organ within the patient.
The differences between the size-specific and standard effective dose ranged from −35% to 69%, with a higher size-specific effective dose for slender patients and a lower dose for heavy patients compared to the standard effective dose. This is due to the use of size- and system-specific conversion factors in contrast to a single conversion factor for the chest PA exams. Large differences between patient-specific dosimetry and referenced-size dosimetry have also been shown for all the modalities in radiology [9] [27–29]. In 37% of the cases in this work, the difference was outside the ±20% range; for these patients, size-specific dosimetry should be performed to be within the maximum proposed dose deviation of ±20% [11]. The differences will become more pronounced in the case of cumulative dose calculations from repeated examinations. The deviations are expected to be similar in X-ray modalities where chest PA projections are performed and may even hold outside the chest region [27].
A limitation of the study was that the specific X-ray field of view was not included in the dose conversion factor, as the Monte Carlo simulations were performed for a fixed field of view, in line with the practice in the hospital. We have now undertaken action to improve this situation. For lung and breast doses, with both organs completely in the field of view, there will only be a minor influence on the conversion factors. This is not the case for the thyroid dose, as a smaller field of view would protect the thyroid dose from the primary beam, hence reducing the dose to this radiosensitive organ.
The data in this study came from three systems in our hospital. Therefore, the (median) values are determined by our specific population and the clinical operating point set for these X-ray systems. Patients are allocated to one of the X-ray rooms based on availability, so there should be no difference in patient population between the rooms. Additional research is needed to determine the influence of different systems and settings, such as the tube voltage and filtration, on the estimated dose conversion factors.
In conclusion, the novel methodology presented in this work enables a more size-specific approach in digital radiography dosimetry. This can be achieved routinely, on a large scale, as only basic DICOM information is required, along with a dedicated calculation of conversion factors per system. This can be performed just once, if shared within the community. This method can provide more accurate dosimetry results for patient dose reporting. For the chest PA exam, effective dose to obese patients was up to 69% lower than what would be estimated using reference-sized conversion factors, whereas effective dose to underweight patients was up to 35% higher. It can be anticipated that the impact in other X-ray exams is similar.
Data availability statement
The raw data supporting the conclusions of this article will be made available by the authors, without undue reservation.
Ethics statement
The studies involving human/animal participants were reviewed and approved by the Ethics Committee Research UZ/KU Leuven (Herestraat 49, B-3000 Leuven). The studies were conducted in accordance with the local legislation and institutional requirements. Written informed consent for participation was not required from the participants or the participants’ legal guardians/next of kin in accordance with the national legislation and institutional requirements.
Author contributions
AD: conceptualization, data curation, formal analysis, investigation, methodology, project administration, resources, software, validation, visualization, writing–original draft, and writing–review and editing. NF: writing–review and editing. NM: supervision, and writing–review and editing, HB: conceptualization, resources, supervision, and writing–review and editing.
Funding
The author(s) declare that financial support was received for the research, authorship, and/or publication of this article. This work was supported by the Flanders Innovation & Entrepreneurship agency (Grant No. HBC.2016.0233). It was conducted in cooperation between Qaelum NV (Leuven, Belgium) and the University of Leuven (Leuven, Belgium).
Conflict of interest
Authors AD and NF were employed by Qaelum NV.
HB is share holder of Qaelum NV.
The remaining authors declare that the research was conducted in the absence of any commercial or financial relationships that could be construed as a potential conflict of interest.
Publisher’s note
All claims expressed in this article are solely those of the authors and do not necessarily represent those of their affiliated organizations, or those of the publisher, the editors, and the reviewers. Any product that may be evaluated in this article, or claim that may be made by its manufacturer, is not guaranteed or endorsed by the publisher.
References
1. United Nations Scientific. UNSCEAR 2008 Report. Volume 1: sources and effects of ionizing radiation. United States: Medical radiation exposures (2010). Annex A. doi:10.18356/c2861fd7-en
2. World Health Organization. Obesity and overweight. Geneva, Switzerland: World Health Organization. Available from: https://www.who.int/news-room/fact-sheets/detail/obesity-and-overweight (Accessed July 19, 2024)
3. ICRP. The 2007 recommendations of the international commission on radiological protection. ICRP Publ 103. Ann. ICRP (2007) 37(2-4).
4. ICRP. Use of dose quantities in radiological protection. ICRP Publication 147. Ann ICRP (2021) 50(1). doi:10.1177/01466453209118
5. Ramon JC, Carter LM, Brown JL, Marquis H, Uribe CF, Zanzonico PB, et al. The risk index as a basis for risk/benefit analyses and protocol optimization in diagnostic nuclear imaging. Med Phys (2023) 50(12):73909. doi:10.1002/mp.16696
6. Martin CJ, Harrison JD, Rehani MM. Effective dose from radiation exposure in medicine: past, present, and future. Phys Med (2020) 79:87–92. doi:10.1016/j.ejmp.2020.10.020
7. Martin CJ. Effective dose: how should it be applied to medical exposures? Br J Radiol (2007) 80:639–47. doi:10.1259/bjr/25922439
8. Doyle P, Martin CJ. Calibrating automatic exposure control devices for digital radiography. Phys Med Biol (2006) 51(21):5475–85. doi:10.1088/0031-9155/51/21/006
9. Kelaranta A, Toroi P, Vock P. Incident air kerma to absorbed organ dose conversion factors for breast and lung in PA thorax radiography: the effect of patient thickness and radiation quality. Phys Med (2016) 32(12):1594–601. doi:10.1016/j.ejmp.2016.11.113
10. Kim H, Park M, Park S, Jeong H, Kim J, Kim Y. Estimation of absorbed organ doses and effective dose based on body mass index in digital radiography. Radiat Prot Dosimetry (2013) 153(1):92–9. doi:10.1093/rpd/ncs089
11. International Atomic Energy Agency. Dosimetry in diagnostic radiology: an international code of practice, technical reports series No. 457. Vienna: IAEA (2007).
12. AAPM task group 220. Use of water equivalent diameter for calculating patient size and size-specific dose estimates (SSDE) in CT: the report of AAPM task group 220. AAPM Rep (2014). doi:10.37206/146
13. Dedulle A, Fitousi N, Jacobs J, Marshall NW, Bosmans H. A methodology to estimate the patient diameter and thickness from thoracic and abdominal projection radiographs of adult patients. Phys Med Biol (2021) 66(14):145002. doi:10.1088/1361-6560/ac0d8c
14. Tapiovaaara M, Siiskonen T. Pcxmc - a pc-based Monte Carlo program for calculating patient doses in medical x-ray Examinations. Helsinki: Finnish Centre for Radiation and Nuclear Safety (2008). Report STUK-A139.
15. Qatarneh SM, Kiricuta IC, Brahme A, Tiede U, Lind BK. Three-dimensional atlas of lymph node topography based on the visible human data set. Anat Rec B New Anat (2006) 289(3):98–111. doi:10.1002/ar.b.20102
16. Moller TB, Reif E. Pocket atlas of cross sectional anatomy: computed tomography and magnetic resonance imaging. Vol. 1: Head, neck, spine and joints: Thieme. 1994.
17. Moller TB, Reif E. Pocket atlas of cross sectional anatomy. Computed tomography and magnetic resonance imaging. Vol. 2: Thorax, abdomen and pelvis: Thieme, 1994.
18. ICRP. Basic anatomical and physiological data for use in radiological protection reference values. ICRP Publ 89. Ann. ICRP (2002) 32(3-4):1–277. doi:10.1016/s0146-6453(03)00002-2
19. EURADOS. Second eurados school: voxel phantom development and implementation for radiation physics calculations (2014).
20. Kawrakow I, Rogers DWO. The EGSnrc code system: Monte Carlo simulation of electron and photon transport. NRCC report PIRS-701.
21. Dedulle A, Fitousi N, Zhang G, Jacobs J, Bosmans H. Two-step validation of a Monte Carlo dosimetry framework for general radiology. Phys Med (2018) 53:72–9. doi:10.1016/j.ejmp.2018.08.005
22. Hubbell JH, Selter SM. X-ray mass attenuation coefficients. In: NIST standard reference database 126.
23. AAPM task group 116. An exposure indicator for digital radiography, AAPM task group 116. AAPM Rep (2009). doi:10.37206/111
24. Zhang Y, Li X, Segars WP, Samei E. Comparison of patient specific dose metrics between chest radiography, tomosynthesis, and CT for adult patients of wide ranging body habitus. Med Phys (2014) 41(2):023901. doi:10.1118/1.4859315
25. Bacher K, Smeets P, Bonnarens K, De Hauwere A, Verstraete K, Thierens H. Dose reduction in patients undergoing chest imaging: digital amorphous silicon flat-panel detector radiography versus conventional film-screen radiography and phosphor-based computed radiography. AJR Am J Roentgenol (2003) 181(4):923–9. doi:10.2214/ajr.181.4.1810923
26. Theocharopoulos N, Perisinakis K, Damilakis J, Varveris H, Gourtsoyiannis N. Comparison of four methods for assessing patient effective dose from radiological examinations. Med Phys (2002) 29(9):2070–9. doi:10.1118/1.1500769
27. Golikov V, Druzhinina P. Technical Note: patient-weight dependence of the effective dose conversion coefficients for diagnostic x-ray imaging procedures. Med Phys (2020) 47(10):5366–72. doi:10.1002/mp.14446
28. Johnson P, Lee C, Johnson K, Siragusa D, Bolch WE. The influence of patient size on dose conversion coefficients: a hybrid phantom study for adult cardiac catheterization. Phys Med Biol (2009) 54(12):3613–29. doi:10.1088/0031-9155/54/12/001
Keywords: patient-specific dosimetry, radiography, phantoms, chest, organ doses, effective dose
Citation: Dedulle A, Fitousi N, Marshall N and Bosmans H (2024) Automated size-specific dosimetry for chest posterior–anterior projection radiography. Front. Phys. 12:1441316. doi: 10.3389/fphy.2024.1441316
Received: 30 May 2024; Accepted: 14 August 2024;
Published: 11 September 2024.
Edited by:
Johann Hummel, Medical University of Vienna, AustriaReviewed by:
Mazhar Hussain, Government College University, PakistanWesley Bolch, University of Florida, United States
Copyright © 2024 Dedulle, Fitousi, Marshall and Bosmans. This is an open-access article distributed under the terms of the Creative Commons Attribution License (CC BY). The use, distribution or reproduction in other forums is permitted, provided the original author(s) and the copyright owner(s) are credited and that the original publication in this journal is cited, in accordance with accepted academic practice. No use, distribution or reproduction is permitted which does not comply with these terms.
*Correspondence: Hilde Bosmans, aGlsZGUuYm9zbWFuc0B1emxldXZlbi5iZQ==