 Jie Liu1
 Wanqing Wang
94% of researchers rate our articles as excellent or good
Learn more about the work of our research integrity team to safeguard the quality of each article we publish.
Find out more
ORIGINAL RESEARCH article
Front. Phys., 18 September 2024
Sec. Fluid Dynamics
Volume 12 - 2024 | https://doi.org/10.3389/fphy.2024.1437171
Large amounts of dust are generated during digging operations in underground mines, and the transportation of dust is affected by the shape of the roadway section. In order to know the dust transportation law of different cross-section shapes when digging. Fluent software was used to simulate the distribution of wind flow field, dust transportation trajectory, and dust quality concentration in roadways with semicircular arch, three-centered arch, rectangle and trapezium, and then analyze and compare the influence of four cross-section shapes on dust transportation, and use gray correlation analysis to investigate the correlation between the time needed to reduce the dust quality concentration of the roadway to the safe value and the ventilation air volume and air supply distance. The results of the study show that the wind speed in the roadway is in the following order from high to low: rectangle > trapezium > three-centered arch > semicircular arch. Dust particles of each size rubbed each other after blasting, and there were fewer dust particles with larger sizes in the three-centered arch roadway. Both the air supply distance and ventilation air volume impact the dust removal effect; when the air supply distances are 5 m and 10 m, the three-centered arch has a better dust removal effect; when the air supply distances are 15 m and 20 m, the effect is better in the rectangular roadway and trapezoidal roadway; and when the ventilation air volume is increased, it is the three-centered arch. Through the gray correlation analysis, it can be seen that in order to improve the construction environment in the roadway after blasting, the rectangular section can be chosen when considering the air supply distance, and the three-centered arch can be chosen when considering the ventilation air volume.
During underground mine roadway operations, a large amount of dust is generated during drilling, blasting, shoveling, and other processes. When more dust is gathered per unit volume, the dust density increases and the dust concentration increases, resulting in the formation of a high concentration of dust [1], and the dust production after blasting in the boring face is particularly serious in all construction processes. The dust generated after blasting will be transported to the exit of the roadway under the action of the wind flow, but because the transport of dust in the roadway is affected by many factors, scholars in order to explore the dust transport law in the roadway began to use theory, experiments, and numerical simulation to carry out research on the different influencing factors[2], [3], and [4] derived the characteristics of dust distribution under different wind speeds by the numerical simulation of dust concentration distribution. [5], [6], and [7] investigated the effects of the position of the pressure-extraction cylinder opening and the pressure-extraction ratio on the dust distribution pattern and optimized the combined pressure-extraction ventilation parameters through the dust distribution pattern. [8], [9], [10], and [11] used the theory of gas–solid two-phase flow to obtain the dust transport law under different ventilation methods, which provides a certain basis for the selection of ventilation methods, and [12] also used the fluid dynamics model to consider the effect of time to study the dust behavior under two kinds of auxiliary ventilation systems. [13] and [14] used a combination of similar experiments and numerical simulations to conduct an in-depth study of the flow field and dust transport characteristics under different wind turbine heights. Based on the numerical simulation method, [15] and [16] investigated the influence of the distance from the air outlet of the wind turbine to the working surface on the distribution of the dust concentration and the effect of dust exhaustion. In addition, other scholars have investigated the dust transport and diffusion law for the ventilation air volume [17, 18], the location of the dust source [19], the relative humidity in the roadway [20], the number of extractor cylinders [21], and the dust removal device [22].
To summarize, at present, scholars have focused on the study of the influencing factors of dust transportation in the roadway, mostly on the study of the influence of wind speed, the location of the mouth of the pressurized and pumped air tube, the pressure and pumping ratio, the ventilation method, the height of the air tube, etc., on the dust transportation in a single cross-section and have not explored the differences in the distribution of dust under the shape of the other cross-section. However, the different shapes of the roadway sections will lead to different boundary conditions, and then the flow-field distribution in the roadway space will be different, and the distribution of wind speed, temperature and humidity, and the dilution and exclusion of pollutants in the roadway will all be affected. Therefore, in order to explore the distribution characteristics of dust under different section shapes, this paper uses Fluent fluid simulation software to simulate the distribution of wind flow field, dust transport trajectory, and concentration distribution after blasting in the roadway by establishing different section shapes of the roadway model. In addition, this paper further uses the gray correlation analysis method to analyze the correlation between the dust concentration and the air supply distance and ventilation air volume in the roadway of different section shapes, by comparing the correlation value and selecting the preferred section shape, which can provide certain design ideas and theoretical guidance for the mines to carry out the section design.
Computational fluid dynamics (CFD) methods have been widely used in the study of dust transport mechanisms [23]. In the present study, the dust generated after blasting will be transported in the direction of the roadway exit and will gradually settle under the action of the wind flow from the wind roadway outlet, which belongs to the research scope of the gas–solid two-phase flow [24]. Therefore, in this paper, the wind flow in the roadway is treated as a continuous phase, and the turbulence model is applied to solve its flow; the dust is treated as a discrete phase, and the motion trajectories of the dust particles are calculated by the discrete-phase model.
The fluid flow in the roadway will be constrained by the physical conservation law, and according to the field conditions and the Reynolds number calculation formula, it can be known that the fluid type in the roadway is completely turbulent. From the study by [25], it is known that for high Reynolds number turbulence, the standard k-ε model is more accurate than other models and has good stability and relatively high computational accuracy. Therefore, in this study, the standard k-ε turbulence equation is considered in addition to the mass conservation equation and momentum conservation equation under the press-in ventilation mode.
Mass conservation equation:
Momentum conservation equations:
In Equations 1–3, ρ is the density of the fluid, kg/m3; t is the time, s; u is the velocity of the fluid, m/s; x is the coordinate in the X, Y, and Z directions, m; i is the tensor sign, which is taken as 1, 2, and 3; j is the tensor sign, which is taken as 1, 2, and 3; Sm is the source term; P is the hydrostatic pressure, pa; τij is the stress tensor; and gi and Fi are the gravitational volumetric force and external volumetric force in the i-direction, respectively.
The equations for the turbulent kinetic energy k and dissipation rate ε for the standard k-ε model are as follows, respectively, [26]:
In Equations 4, 5 ρ is the density of the fluid, kg/m3; t is the time, s; ui is the velocity of the fluid in the i-direction, m/s; xi and xj are the coordinates in the i-direction and j-direction, respectively, m; μt is the turbulent viscosity coefficient, which can be solved for μt = (ρCμk2)/ε (where Cμ is a constant taken as 0.09), Pa·s; Gk is the turbulent kinetic energy induced by the mean velocity gradient; Gb is the turbulent kinetic energy induced by the buoyancy force; C1ε, C2ε, and C3ε are all constant terms; σk is the turbulence Plumptre number corresponding to k; σε is the turbulence Plumptre number corresponding to ε. Usually C1ε, C2ε, σk, and σε are taken as 1.44, 1.92, 1.00, and 1.30, respectively.
The force of dust particles in the roadway is complex, and in order to analyze its force state, assuming that the dust in the roadway is made of spherical particles, and without considering the collision between the particles, the force acting on the dust particles is mainly gravity, buoyancy, drag, pressure gradient force, Magnus lift force, Saffman lift force, Basset force, false mass force, etc. [27]. Since the density of dust particles is much greater than the density of air, the effect of buoyancy on dust particles can be neglected. In addition, pressure gradient force, Magnus lift force, Saffman lift force, Basset force, and the false mass force are also negligible due to their small magnitude. Then, the force balance equation for dust particles can be written as
In Equation 6 u is the fluid velocity, m/s; up is the velocity of dust particles, m/s; ρp is the density of dust particles, kg/m3; FD is the unit mass tugging force of dust particles, N.
In addition, FD can be calculated by the following formula:
In Equation 7 CD is the drag coefficient; dp is the diameter of dust particles, m; μ is the coefficient of dynamic viscosity; Re is the Reynolds number.
Re can be calculated by the following Equation 8:
Then, FD can be expressed as Equation 9
Then, the force balance equation for the dust particles can be finally expressed as Equation 10
Taking a metal mine in Yunnan Province underground roadway as a reference, the roadway section shape is found to be a three-centered arch, using the pressure-entry ventilation, in which the diameter of the wind pipe is 0.8 m, the central axis is 2 m high from the bottom plate of the roadway, the wind speed of the wind pipe outlet is 4 m/s, and the distance from the face of the excavation is 10 m. In order to study the different section shapes, under the premise of meeting the transportation needs of this mine, this paper designs three other different section shapes, i.e., semicircular arch, rectangle, and trapezoidal, based on the original three-centered arch roadway section. As the size of the section area of the roadway determines the excavation cost, and in order to ensure that the volume of the ventilation space in the roadway is the same, so in the design of the other three section sizes, it is necessary to ensure that their section areas are the same as the original three-centered arch section area, the specific section shape, and size, as shown in Figure 1.

Figure 1. Dimensions of the roadway section: (A) semicircular arch; (B) three-centered arch; (C) rectangle; and (D) trapezium.
In view of the fact that most of the dust particles are gathered in the working face of the roadway within 30–50 m [28], the range of 50 m from the face of the roadway is taken as the research object. Since the settlement and discharge of dust can be regarded as a non-stationary fluid diffusion process, and there is a certain difference between numerical simulation and the actual working conditions, the model is simplified to consider only the influence of the pressure-entry wind pipe on the distribution of the wind flow field and does not take into account the leakage of the wind pipe. Therefore, SpaceClaim software was used to carry out 1:1 isobaric modeling, and the geometric model of each duct was obtained as shown in Figure 2.
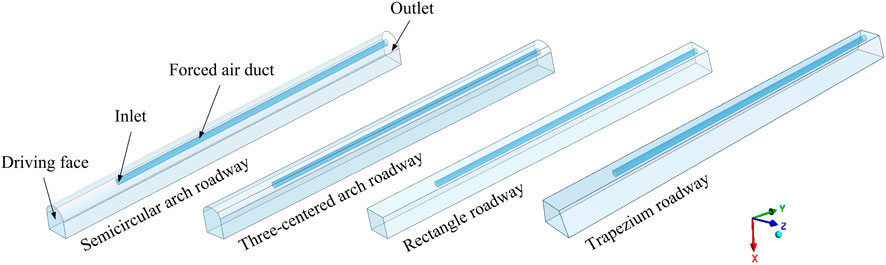
Figure 2. Geometric model.
The geometric model is imported into ICEM CFD, and non-structural tetrahedral meshing is used, and the quality of the meshes is checked to meet the requirements and reach the calculation standard, and the meshing model is shown in Figure 3. The mesh model that meets the quality requirements is imported into Ansys Fluent, and according to the actual situation of the project, the outlet of the pressure-entry wind turbine is set as the velocity inlet, the outlet of the excavation roadway is set as the outflow, the wall surfaces of the excavation roadway are all non-slip wall surfaces, and the whole excavation surface is the source of the dust jet. The other parameters of the computational model are shown in Table 1.
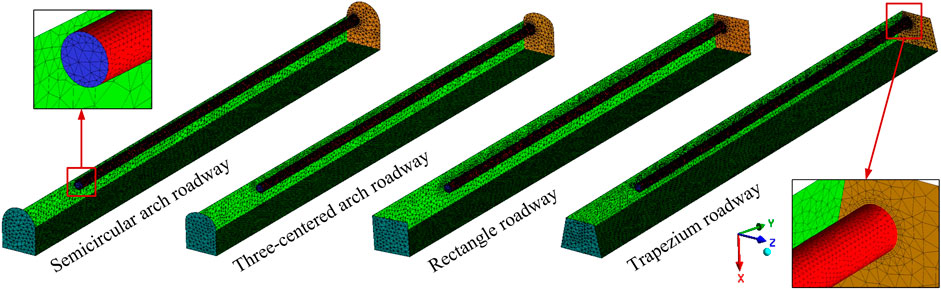
Figure 3. Meshing.
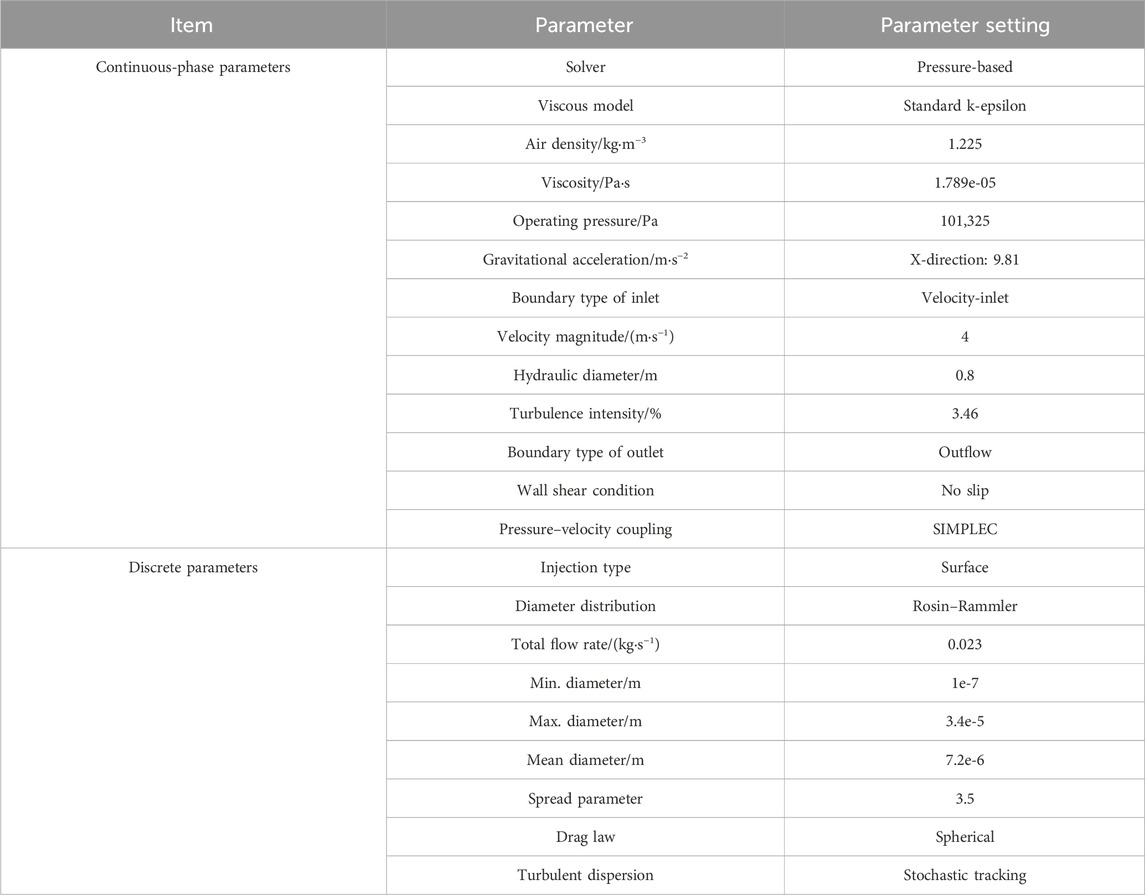
Table 1. Computational model parameterization.
In numerical simulation analysis, the quality of meshing greatly affects the efficiency of simulation runs and the accuracy of results, while the wind flow in the mine is the main influencing factor that restricts the diffusion of dust [29]. Therefore, wind speed and dust concentration in the roadway at 1.5 m above the height of the human breathing zone were selected as the parameters for checking the independence of the grid, and the ICEM CFD software was used to mesh the four physical models, and three schemes with different numbers of grids were obtained for each physical model, in which the number of MA grids for semicircular arch roadways was 295,893, 413,010, and 727,921; the number of MB grids for tri-centered arch roadways was 308,023, 414,634, and 708,712; the number of MC grids for rectangular roadways was 284,917, 422,592, and 662,875; and the number of MD grids for trapezoidal roadways was 292,778, 427,347 and 703,208, respectively. Simulations were performed for each of the three scenarios to obtain the wind speed distribution and dust concentration distribution for different grid numbers, as shown in Figure 4. As can be seen from the figure, although there are differences in the number of grid divisions for the four cross-section shapes of the roadway, the trends of wind speed and dust concentration are relatively close to each other, and all of them increase first and then decrease, which satisfies the independence verification. Therefore, taking into account the performance of the computer and computational efficiency, all of them use medium grid number to divide the grid and simulate, in which the average quality of the grid is greater than 0.7.
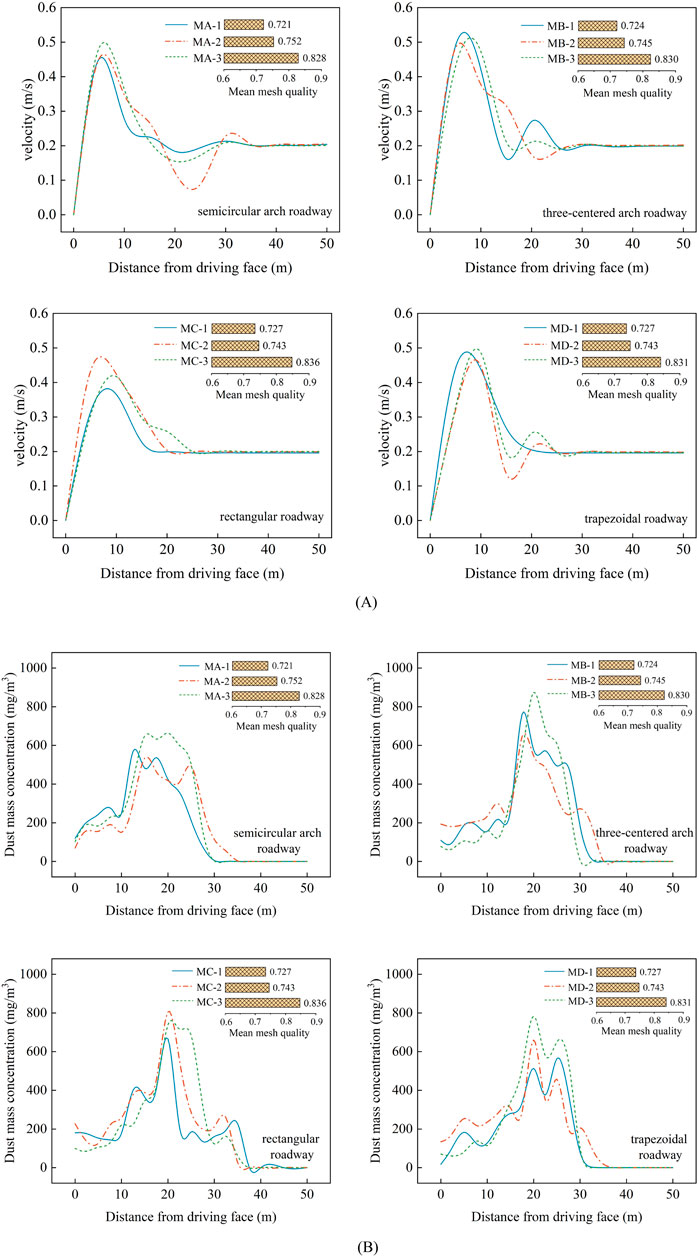
Figure 4. Grid independence test: (A) Comparison of wind speed distribution; (B) Comparison of dust concentration distribution.
In order to ensure the accuracy of the numerical simulation results, according to the original three-centered arch roadway wind speed and dust field measurement data and numerical simulation of the data for comparison, the results are shown in Figure 5. It can be seen that the measured data and simulated data are relatively close, the trend is basically the same, and the error is controlled within 10%, which verifies the accuracy of the numerical simulation.
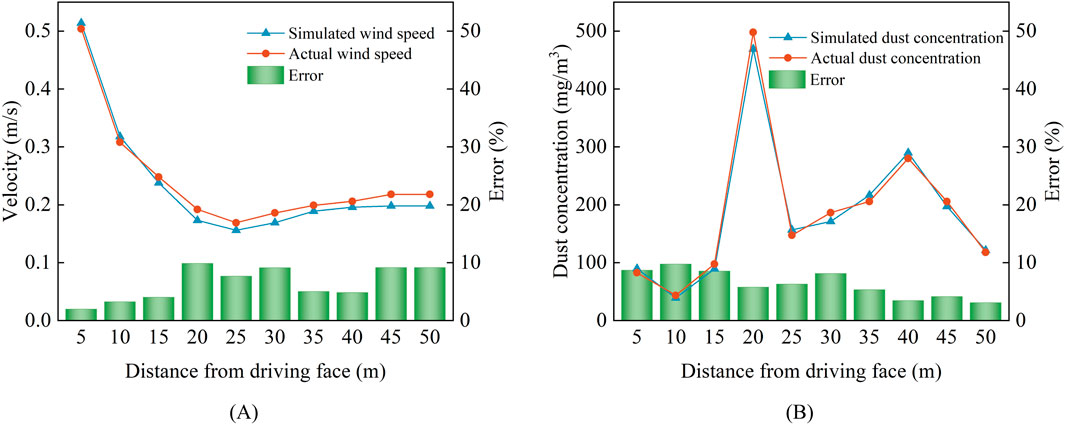
Figure 5. Model validation: (A) wind speed validation and (B) dust concentration validation.
The distribution of the wind flow field in the roadway is an important factor affecting the diffusion of dust, and the dust generated by blasting will be carried by the wind flow and diffused to other areas from the digging face, so solving the wind flow field and analyzing its distribution pattern can help understand the dust distribution pattern [30]. The wind flow traces in each roadway under the pressure-entry ventilation condition are shown in Figure 6. From the figure, it can be seen that the high-speed fresh airflow from the outlet of the wind pipe is directed to the digging surface, forming a high-speed wall jet, but due to the obstruction of the digging surface, the wind pipe is placed on the left side of the roadway, resulting in the wind flow to the wall, mainly to the lower right side of the roadway, and a part of the wind flow is turned to form a vortex at the digging surface, while the other part of the air flow continues to flow to the central part of the roadway, forming a vortex zone, a transition zone, and a stabilization zone. It can be seen that although there are differences in the shape of each roadway section, the trajectory of the formed wind flow is similar.
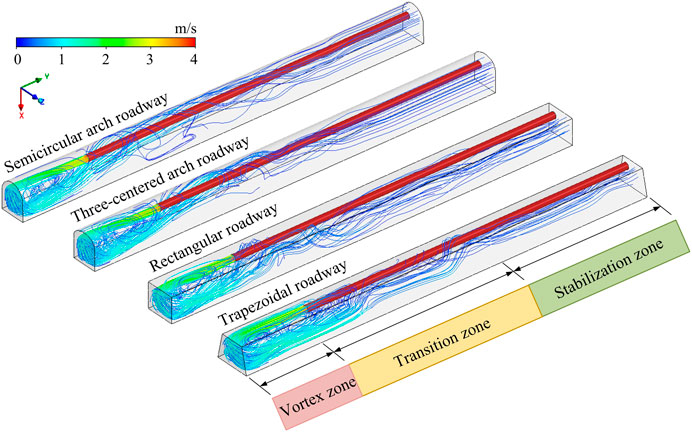
Figure 6. Distribution of wind flow traces in each roadway.
It can be seen from the wind flow traces of each roadway that the wind flow changes near the boring face are more complicated. In order to better understand the distribution of the wind flow field as well as to improve the accuracy of the data, 11 cross-sections were set up in the roadway, and the average wind speed of each section can be calculated by arranging multiple measurement points on the section, and the statistical value of the wind speed on each section is shown in Table 2.
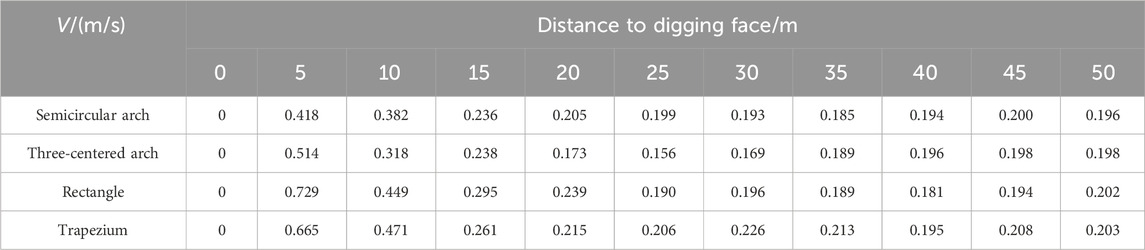
Table 2. Wind speed magnitude statistics.
According to the average wind speed of each roadway section, a wind speed change curve is created, as shown in Figure 7. From the figure, it can be observed that the wind speed of each roadway shows an increasing and then decreasing trend, and the wind speed fluctuation is most obvious in the range of 10 m from the digging surface, all of them reach the peak, from high to low in the order of rectangle > trapezium > three-centered arch > semicircular arch. The reason for this situation is mainly due to the formation of backflow after the wind jet to the wall, the flow direction is opposite to the direction of the jet, and the interaction between the two leads to the formation of the vortex in one part and the flow along the exit of the roadway in the other part. Therefore, in the range of 10 m from the digging face, the wind speed fluctuation is obvious, and the different shapes of the section result in differences in the distribution of wind speed in the internal space of the roadway, and then the size of the peak wind speed in each roadway is different. The size of wind speed affects the movement of dust, and different peak wind speeds in each roadway will result in different dust transportation conditions. In addition, at approximately 15 m from the exit of the roadway, the wind flow of each roadway enters the “stable section,” and the wind speed is maintained at approximately 0.2 m/s.
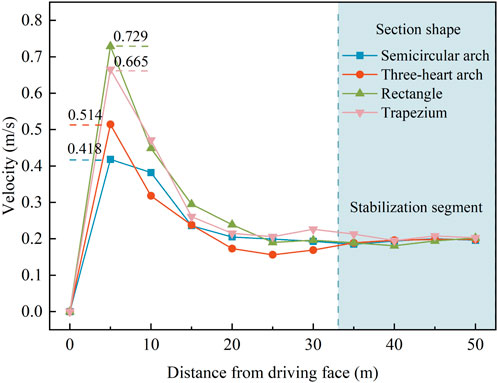
Figure 7. Trend of average wind speed at each section.
At the end of the convergence of the steady-state calculations, the discrete-phase model was turned on, the jet source was set up in the face of the excavation, and the plane of the respiratory belt at a height of 1.5 m was selected for the study so that the cloud diagrams of the dust transportation at different moments in the various passages were obtained, as well as the changes of the dust mass concentration of the different cross-sections with time, as shown in Figure 8.
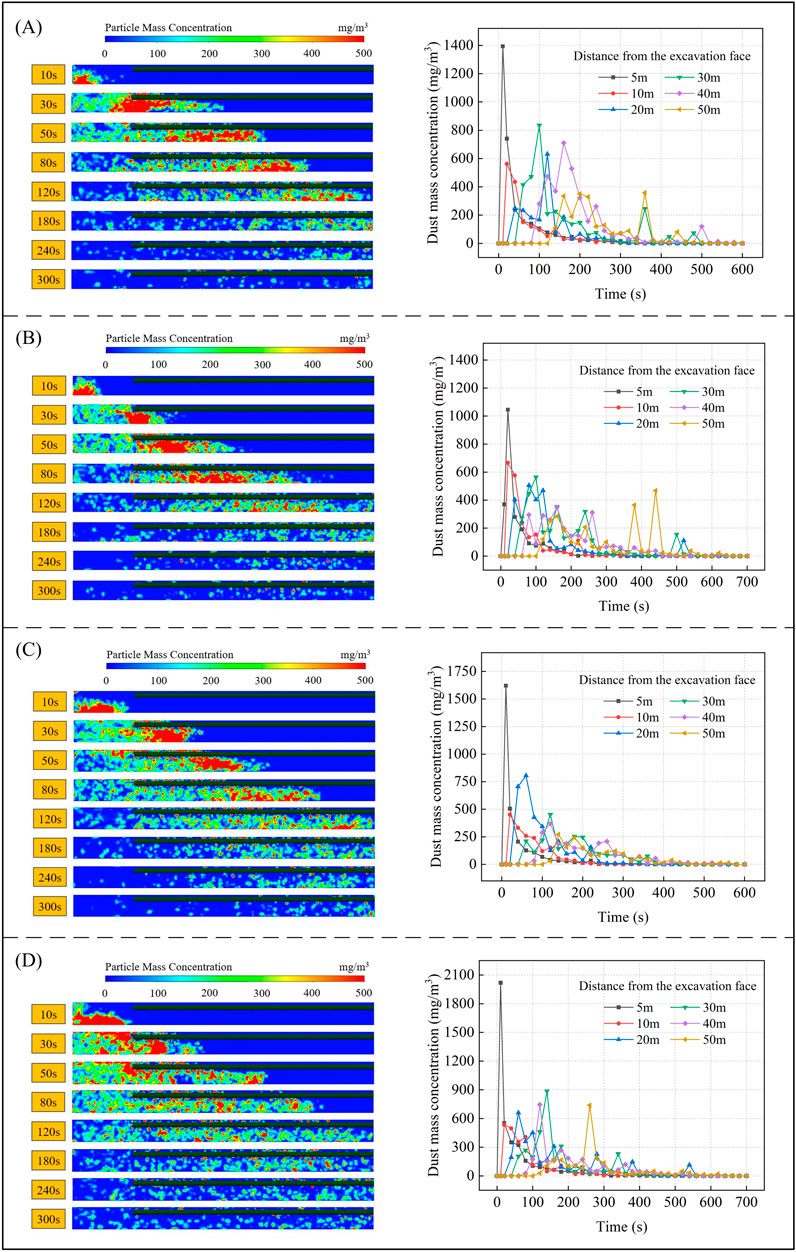
Figure 8. Dust transportation and cross-section concentration along each roadway: (A) semicircular arch roadway; (B) three-centered arch roadway; (C) rectangular roadway; and (D) trapezoidal roadway.
Under the action of press-in ventilation, the wind flow plays an important role in the transportation of dust after blasting, as shown in Figure 8:
(1) After blasting operations in the digging face, dust will be transported from the digging face to the exit direction of the roadway with the change in time, and due to the placement of the wind turbine on the left side of the roadway, under the effect of high-speed jet and backflow, the right side of the roadway of the dust mass concentration is higher than that on the left side. After 10 s of ventilation, dust is the first to move to the rectangular and trapezoidal roadway duct outlet, and dust in the semi-circular arch and three-arched roadway gathered more in the vicinity of the digging surface; after 50 s of ventilation, dust is transported to the middle of the three-centered arch roadway, but more than the semi-circular arch, rectangular, and trapezoidal roadway in the middle; after 120 s of ventilation, the dust is transported to the exit of the four roadways.
(2) With the increase in ventilation time, the dust wrapped by the wind flow gradually filled the whole roadway, the distribution range of dust gradually increased, the range of the dust quality concentration less than 500 mg/m3 also gradually increased, and the dust quality concentration near the digging face gradually decreased. After 10–50 s of ventilation, the dust quality concentration is the highest in the trapezoidal roadway within the range of 10 m from the wind pipe to the digging face, and the dust distribution range is relatively close; after 300 s of ventilation, the trapezoidal roadway has a close distribution of dust compared with the other three roadways, and the dust quality concentration is the highest.
(3) The dust mass concentration in each cross-section increased rapidly and then decreased gradually, but due to the influence of the shape of the roadway section, the dust mass concentration in the semicircular arch roadway fluctuated more when ventilated for 300–400 s; the dust mass concentration in the three-centered arch roadway fluctuated more when ventilated for 350–500 s, and the fluctuation of the dust mass concentration in the rectangle and trapezoidal roadway was smaller and the trend was more gentle. After 10 min of ventilation, the dust quality concentration in each roadway was lower than 10 mg/m3.
After ventilation for 5 min, the diffusion of dust particles from different section shapes in the roadway was obtained by selecting the same time interval, as shown in Figure 9. In general, dust particles are generated from the digging face and then diffused forward under the action of the press-in wind flow, but due to the different shapes of the set sections, there are differences in the settling of dust particles of different grain sizes in the roadway:
(1) From the diffusion situation, the peak wind speed in the rectangular and trapezoidal roadway is larger than that in the semicircular arch and three-centered arch roadway in the range of 10 m from the digging face. Therefore, the dust particles in the rectangular and trapezoidal roadway exceeded the outlet of the wind pipe first after diffusion from the digging face during 10 s of ventilation. The dust particles in the three-centered arch roadway diffused the slowest for a ventilation of 30 s and did not arrive at the middle of the roadway, but the dust particles in the roadway were the first ones to arrive at the vicinity of the outlet of the roadway when the ventilation was 90 s.
(2) From the point of view of dust distribution, the dust particles of various sizes in the roadway are pressed with each other; with the increase in ventilation time, the range of dust particle sizes near the digging surface gradually decreases. The larger dust particles will settle in the bottom plate of the roadway, and the smaller dust particles float in the air and continue to move forward with the wind flow. When ventilated for 180 s, there are differences in the settlement location and particle size distribution of dust particles in each roadway, in which the dust particles in the trapezoidal roadway settle at the outlet of the wind pipe; the dust particles in the semicircular arch roadway settle at about 10 m from the outlet of the wind pipe; and there are fewer dust particles with larger particle sizes in the three-centered arch roadway, and the distribution of the dust is more sparse.
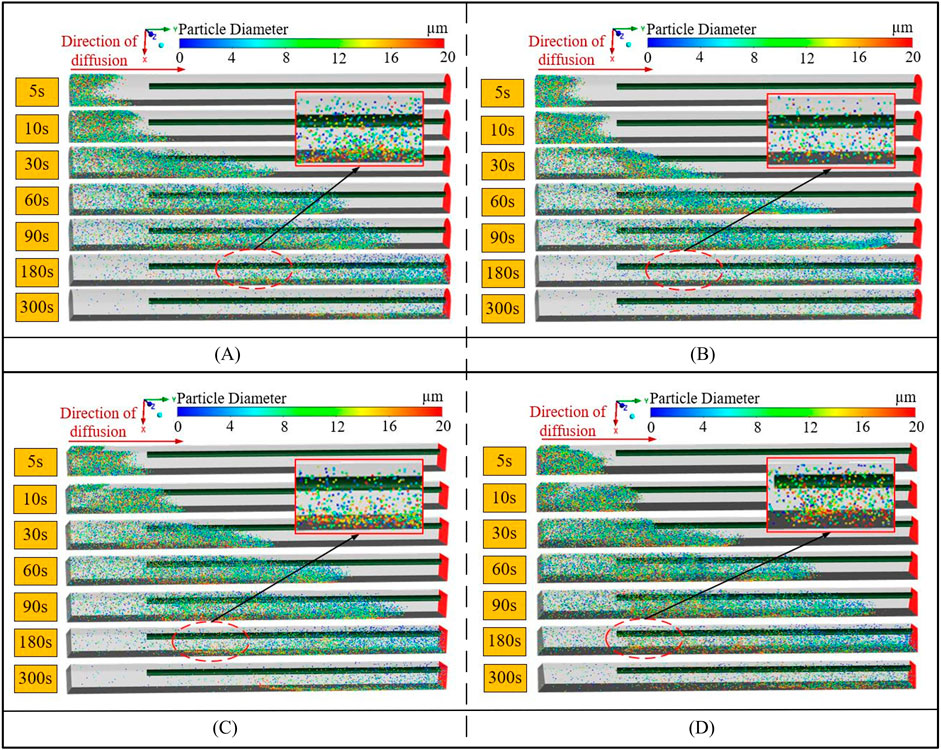
Figure 9. Diffusion of dust particles of different sizes with time: (A) Semicircular arch roadway; (B) Three-centered arch roadway; (C) Rectangular roadway; and (D) Trapezoidal roadway.
In order to investigate the distribution of dust in different cross-section shapes of the roadway under different air supply distances, the effective range is estimated according to the effective range formula
When the outlet of the wind pipe is 5 m away from the digging face, the wind flow can quickly reach the digging face to eliminate the dust, so within 10 m away from the digging face, the quality concentration of dust in each roadway is low. As the distance from the digging face increases, the wind speed of the wind flow decreases, resulting in the existence of high concentration areas of dust in the middle and lower parts of the roadway, and the dust concentration is higher at the bottom plate of the roadway, of which the dust concentration is the lowest in the semicircular arch roadway in the Y = 10 m section, and the dust in the trapezoidal roadway is farther away from the exit, as shown in Figure 10A. It can be seen through the change in the dust mass concentration in each roadway section, in the vortex zone, except for the three-centered arch roadway, and the dust concentrations in other roadways are gradually increasing; the dust concentrations in each roadway have reached the peak in the transition zone and stable zone, with a difference of 332.10 mg/m3 between the highest and lowest concentrations. The peak dust concentration of the four cross-section shapes is of the following order: semicircular arch > rectangle > trapezium > three-centered arch, as shown in Figure 10B. From the fitting curve shown in Figure 10C, it is observed that the diffusion of dust in each roadway has a certain regularity. With the increase in ventilation time, the dust diffusion distances are logistic function increases, which are important for predicting the dust diffusion distance in different time periods in the digging face of the roadway, for which the best-fitting relationship formula is shown in Table 3. As can be seen from the fitted curves for each roadway, before 40 s of ventilation, dust diffusion in the semicircular arch roadway is faster, and dust diffusion in the trapezoidal roadway is slower; after 40 s of ventilation, dust diffusion in the semicircular arch roadway is slowed down, and dust diffusion in the triple-centered arch roadway and rectangular roadway is accelerated, and dust diffusion to the exit of the roadway is in the following order: three-centered arch > rectangle > semicircular arch > trapezium in the four cross-sectional shapes. Therefore, when the outlet of the wind pipe is 5 m away from the digging face, the three-centered arch has a better ventilation and dust removal effect.
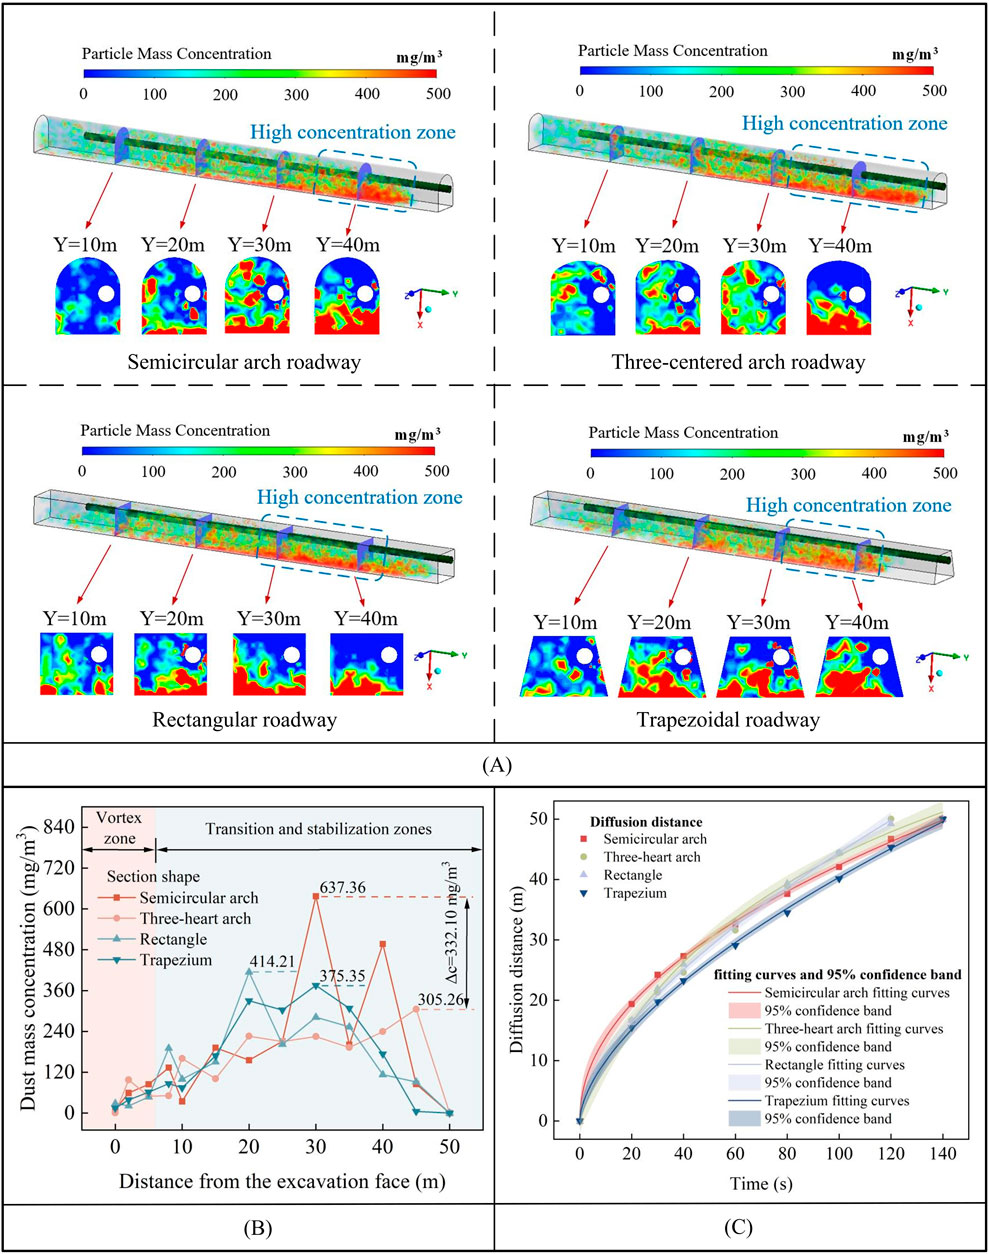
Figure 10. Dust distribution at the outlet of the wind pipe 5 m from the digging face: (A) Distribution of dust concentration; (B) Variation of dust mass concentration in each cross-section; and (C) Dust diffusion distance versus time curve.
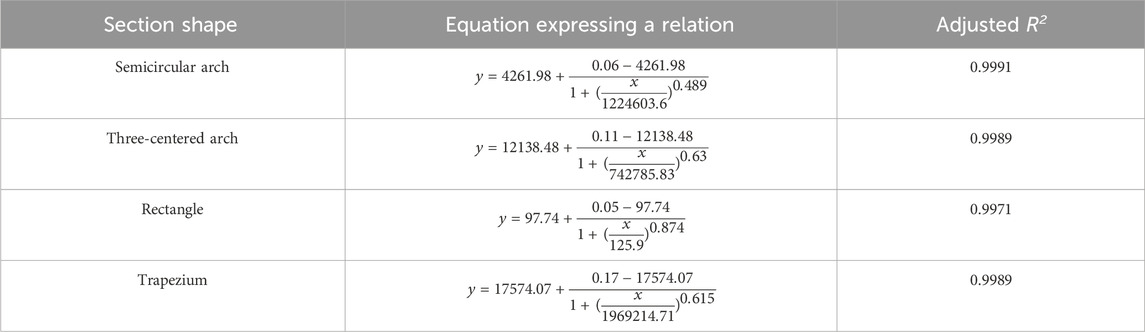
Table 3. Relationship between dust dispersion distance and ventilation time.
When the outlet of the wind pipe is 10 m away from the digging surface, the dust concentration is higher at the bottom plate of each roadway, and the range of dust distribution is more uniform, and all of them diffuse to the outlet of the roadway within the same time range, but except for the trapezoidal roadway, the high concentration area for dust particles in the other roadways is mostly situated in the lower part of the roadway, as shown in Figure 11A. It can be seen through the change in the dust mass concentration in each roadway section due to the similar shape of the semicircular arch and three-centered arch and the similar shape of the rectangular and trapezoidal roadway, resulting in the similar trend of dust concentrations between the two roadway types; in the vortex zone, the fluctuation of the dust concentration in each roadway is small, and the fluctuation of the dust concentration in each roadway is larger in the transition zone and the stabilization zone, but all of the dust concentrations reach the peak value, and the difference between the highest and the lowest concentrations is 294.48 mg/m3, and the peak dust concentrations of the four section shapes were in the following order trapezium > semicircular arch > three-centered arch > rectangle, as shown in Figure 11B. From the fitting curve shown in Figure 11C, it can be seen that the diffusion pattern of dust with time in each roadway also obeys the logistic function distribution, and its best fitting relationship equation is shown in Table 4. From the fitted curves for each roadway, it can be observed that the dust diffusion distances in rectangular and trapezoidal roadways are more similar, but before 40 s of ventilation, the dust diffusion in the semicircular arch roadway is faster, and the dust diffusion in the three-centered arch roadway is slower; after 40 s of ventilation, the dust in the three-centered arch roadway is the first one to be diffused to the exit of the roadway, and the four section shapes of dust diffusion to the exit of the roadway are in the order of three-centered arch > rectangle > trapezium > semicircular arch. Therefore, when the outlet of the wind pipe is 10 m away from the digging face, the section shape with better ventilation and dust removal effect is the three-centered arch.
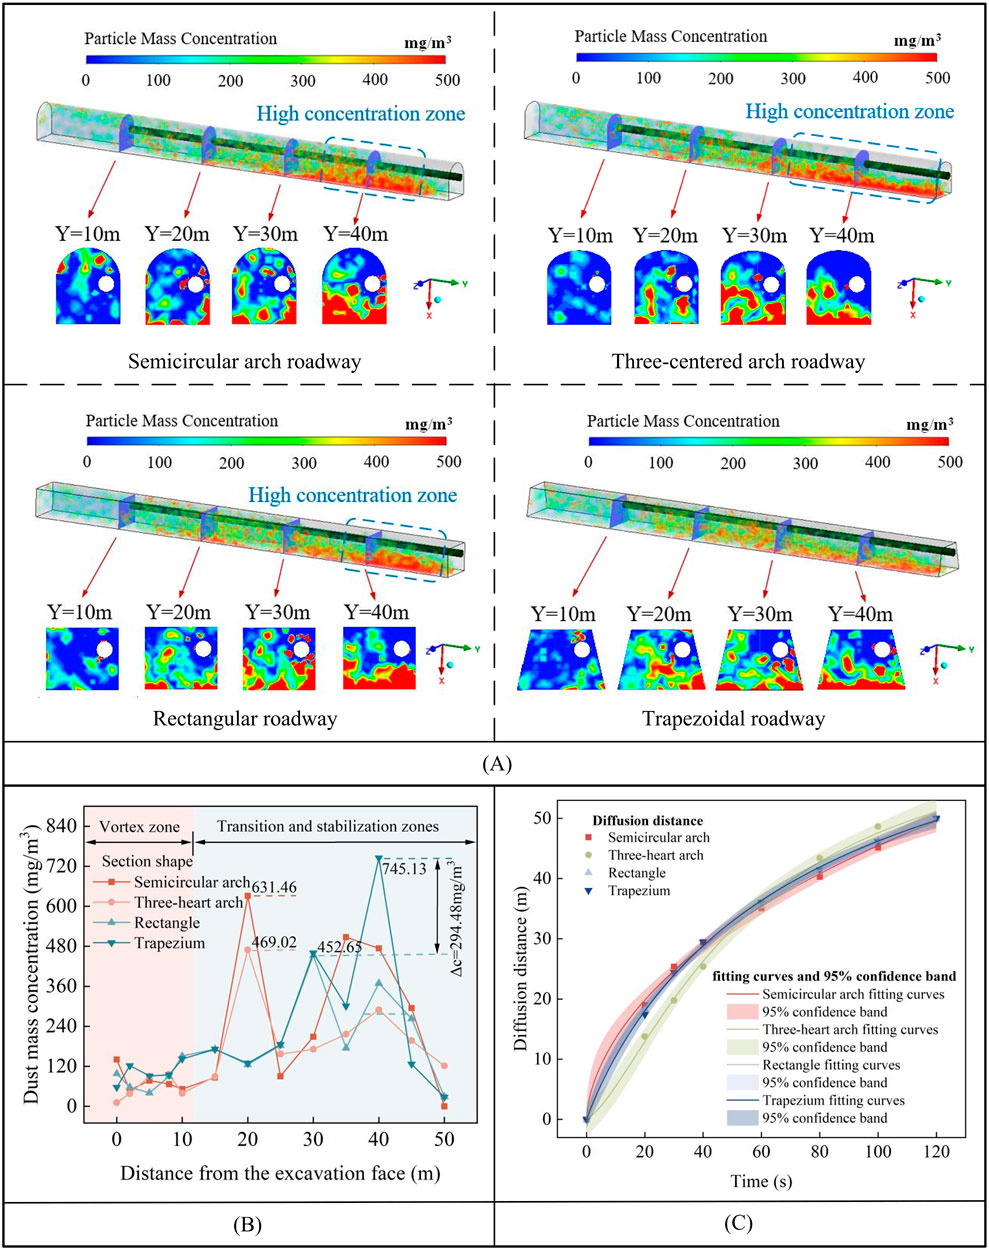
Figure 11. Dust distribution at the outlet of the wind pipe 10 m from the digging face: (A) Distribution of dust concentration; (B) Variation of dust mass concentration in each cross-section; and (C) Dust diffusion distance versus time curve.
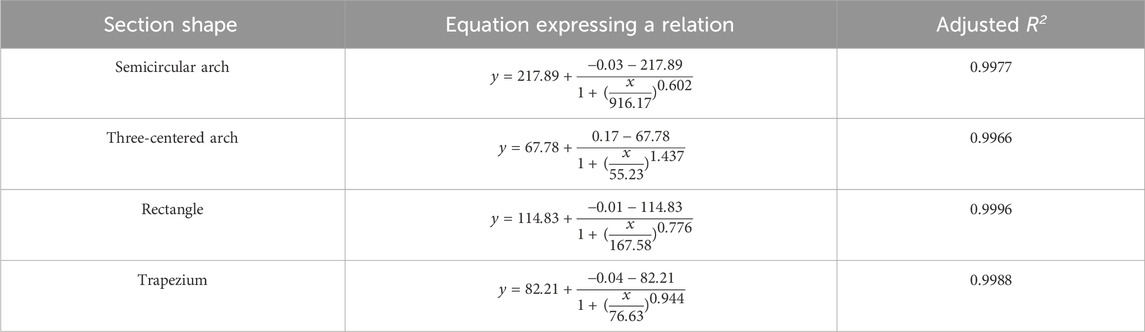
Table 4. Relationship between dust dispersion distance and ventilation time.
When the outlet of the wind pipe is 15 m away from the digging face, due to the increase in the distance of air supply, it takes more time for the wind flow to reach the digging face, so compared with other roadways, the dust concentration area in the trapezoidal roadway is mostly concentrated in the vicinity of the digging face. With increasing distance from the face, the wind flow speed decreases, except for the semicircular arch roadway, and the size of the dust distribution range on the Y = 40 m cross-section is in the order of three-centered arch > rectangle > trapezium, as shown in Figure 12A. It can be seen through the change in dust mass concentrations in each roadway section that the dust concentration peaked in the trapezoidal roadway in the vortex zone, and the dust concentration fluctuated less in other roadways; in the transition zone and the stability zone, except for the trapezoidal roadway, the other three roadways reached the peak concentrations, and the difference between the highest and the lowest concentrations was 2,142.65 mg/m3, and the peak concentration of the dust particles of the four cross-sectional shapes was of the order trapezium > semicircular arch > three-centered arch > rectangle, as shown in Figure 12B. From the fitting curve shown in Figure 12C, it is observed that with the increase in air supply distance, the speed of dust diffusion in each roadway also began to change, but the change in dust diffusion distance with time still obeys the distribution of logistic function, and its best fitting relationship formula is shown in Table 5. As can be seen from the fitted curves, dust diffusion is fastest in the semicircular arch roadway and slowest in the trapezoidal roadway; before 80 s of ventilation, dust diffusion is faster in the three-centered arch roadway than in the rectangular roadway; however, after 80 s of ventilation, dust diffusion distances are similar between the three-centered arch roadway and the rectangular roadway, and the order of dust diffusion to the exit of the roadway in the four cross-sectional shapes is semicircular arch > three-centered arch = rectangle > trapezium. Therefore, when the outlet of the wind pipe is 15 m away from the digging face, the rectangular section has better ventilation and dust removal effect.
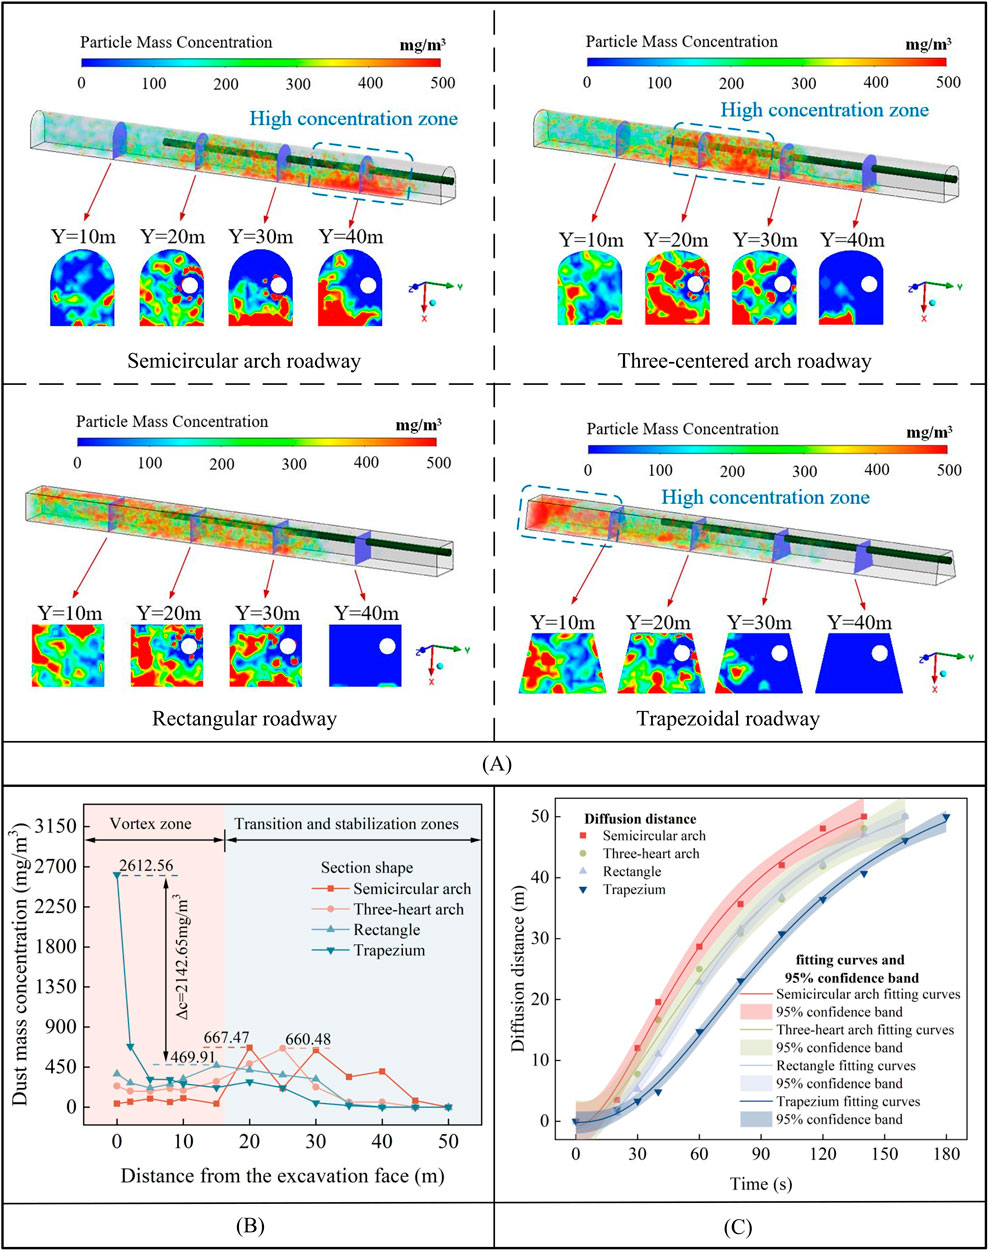
Figure 12. Dust distribution at the outlet of the wind pipe 15 m from the digging face: (A) Distribution of dust concentration; (B) Variation of dust mass concentration in each cross-section; and (C) Dust diffusion distance versus time curve.

Table 5. Relationship between dust dispersion distance and ventilation time.
When the outlet of the wind pipe is 20 m away from the digging face, due to the long distance of the air supply, it is affected by the air resistance, which leads to the continuous attenuation of the wind speed in the process of the wind flow from the outlet of the wind pipe to the digging face, which slows down the diffusion speed of the dust so that there is no dust in the cross-section of the roadway at Y = 40 m. In addition, the dust in the rectangular roadway is mostly distributed near the digging face, and the dust mass concentration is high, as shown in Figure 13A. It can be seen through the change in the dust mass concentration in each roadway section that the dust concentration peaked in the rectangular roadway, trapezoidal roadway, and semicircular arch roadway in the vortex zone; the dust concentration peaked in the three-centered arch roadway in the transition zone and stability zone, and the difference between the highest and lowest concentrations was 7,062.82 mg/m3, and the peak dust concentration of the four section shapes is in the following order: rectangle > semicircular arch > trapezium > three-centered arch, as shown in Figure 13B. From the fitting curve shown in Figure 13C, it is observed that although the distance of diffusion of dust particles in each roadway varies greatly, there is still a certain law to follow, and the four kinds of roadways obey the distribution of logistic function, and its best fitting relationship formula is shown in Table 6. From the fitted curves, it can be seen that the dust diffusion is slow in all the roadways before 40 s of ventilation, which is mainly due to the increase in the air supply distance and the increase in the time for the wind flow to reach the digging face from the outlet of the wind pipe. However, with the increase in the ventilation time, before 120 s of ventilation, dust diffusion is the fastest in the semicircular arch roadway and the slowest in the rectangular roadway; after 120 s of ventilation, dust diffusion is accelerated in the rectangular roadway and the three-center-arched roadway, and the order of dust diffusion to the exit of the roadway in the four cross-sectional shapes is trapezium > three-centered arch > semicircular arched > rectangle. Therefore, when the outlet of the wind pipe is 20 m away from the digging face, the trapezoidal section has better ventilation and dust removal effect.
Figure 13. Dust distribution at the outlet of the wind pipe 20 m from the digging face: (A) Distribution of dust concentration; (B) Variation of dust mass concentration in each cross-section; and (C) Dust diffusion distance versus time curve.
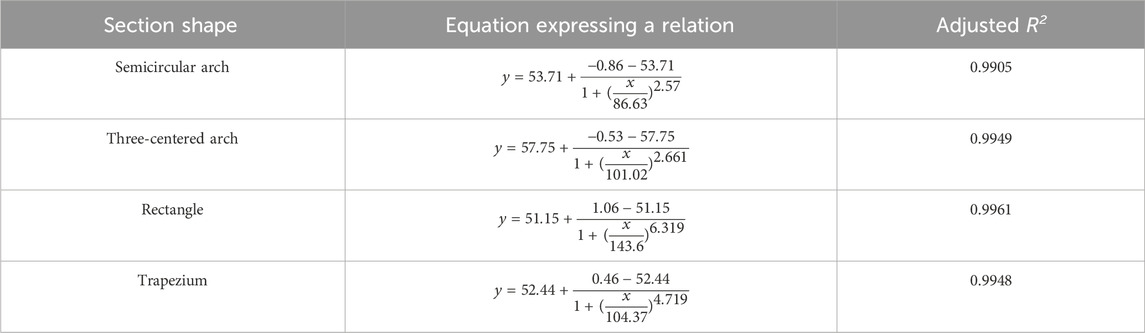
Table 6. Relationship between dust dispersion distance and ventilation time.
We investigate the distribution of dust in roadways with different section shapes under different ventilation airflows. According to the “metal non-metallic mine safety regulations,” it is stipulated that the average wind speed in the section of the roadway should not exceed 6 m/s, so the wind pipe outlet air volumes of 120.64, 180.96, 241.27, and 301.59 m3/min are selected for analysis, and when the flow field is stable in the roadway, the simulation obtains the distribution of dust concentration in the roadway and the mean value of the concentration of the cross-section along the roadway after the ventilation for 1 min, which is shown in Figure 14.
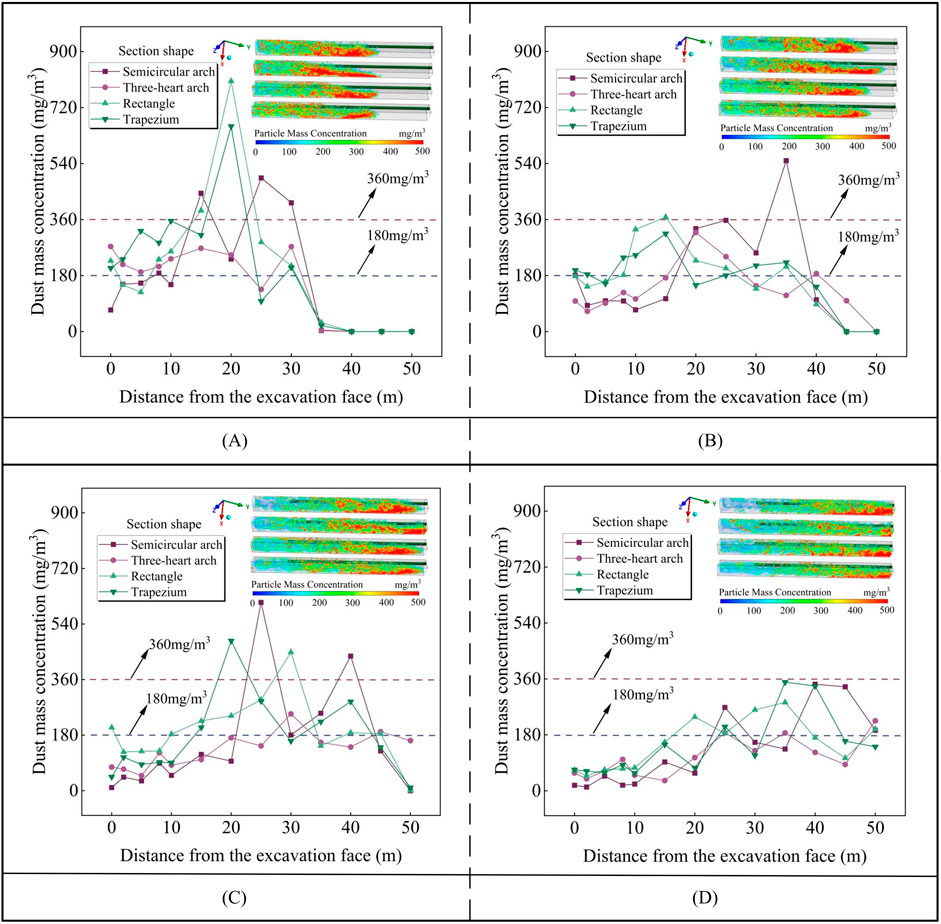
Figure 14. Variation of dust quality concentration in each roadway under different ventilation airflow rates: (A) Ventilation air volume is 120.64 m3/min; (B) Ventilation air volume is 180.96 m3/min; (C) Ventilation air volume is 241.27 m3/min; and (D) Ventilation air volume is 301.59 m3/min.
As can be seen from the figure, the dust generated by blasting in the boring face spreads in the direction of the roadway exit, and with the increase in ventilation air volume, the time required for the wind flow to reach the boring face becomes shorter, and dust diffusion is accelerated, and the time to reach the exit of the roadway will be shortened. In addition, due to the wrapping effect of the wind flow, the dust mass concentration in the area near the digging face is gradually decreasing. When the ventilation airflow is 120.64 m3/min, the dust in the four cross-section shapes of the roadway spread to the middle of the roadway, and the areas with high dust concentration are mostly gathered in the range of 10–30 m from the digging face; the dust concentration is higher than 180 mg/m3 in the roadway, except for the semicircular arch roadway at the digging face, and the peak value of the dust concentration in each roadway is of the following order: rectangle > trapezium > semicircular arch > three-centered arch from high to low, as shown in Figure 14A. When the ventilation airflow is 180.96 m3/min, the dust particles diffuse to the middle and lower part of each roadway, but none of them reach the roadway exit, in which the dust spreads the fastest in the three-centered arch roadway; the dust concentration in the three-centered arch, rectangle, and trapezoidal roadway reaches the peak value in the range of 10–20 m from the digging surface, and the dust concentration in the semicircular arch roadway reaches the peak value in the range of 10–20 m from the roadway exit, and the dust concentration is higher than 360 mg/m3, where the peak dust concentration from high to low is semicircular arch > rectangle > three-centered arch > trapezium, as shown in Figure 14B. When the ventilation airflow is 241.27 m3/min, the dust spreads to the lower part of each roadway, and the dust concentration is lower than 180 mg/m3 in all the roadways, except the rectangular roadway at the digging face; the dust concentration fluctuates greatly in the range of 15–45 m from the digging face, and the dust concentration in each roadway reaches the peak value, with the following descending order: semicircular arch > trapezium > rectangle > three-centered arch, as shown in Figure 14C. When the ventilation airflow is 301.59 m3/min, the dust concentration fluctuates less in the range of 10 m from the digging face, and the value of the dust concentration in the roadway is decreasing compared with the ventilation airflow of 120.64, 180.96, and 241.27 m3/min; the dust concentration in the roadway reaches the peak in the range of 10–20 m from the exit of the roadway, and all of the dust particle concentrations are less than 360 mg/m3, and the order from high to bottom is trapezium > semicircular arch > rectangle > three-centered arch, as shown in Figure 14D. In summary, with the increase in the ventilation air volume, the dust concentration in each roadway will change, and the peak value of the dust concentration fluctuates greatly. By comparing the dust concentration in each roadway, the three-centered arch is found to have better ventilation and dust removal effect.
In order to further determine the effect of section shape on the effectiveness of ventilation and dust removal, as well as to select the optimal section shape, gray correlation analysis was used to explore the correlation between dust quality concentration, ventilation airflow, and air supply distance in each roadway. Gray correlational analysis is used to determine the degree of correlation and influence between factors by comparing the trends between the main features of the system and the main influencing factors [31]. The results of numerical simulation parameters are shown in Table 7. x0 is the time required to reduce the dust quality concentration to a safe value within 50 m of the digging face and is the reference sequence. x1 and x2 are the distance of the air supply and the air volume of ventilation, respectively, which are the comparison sequences.
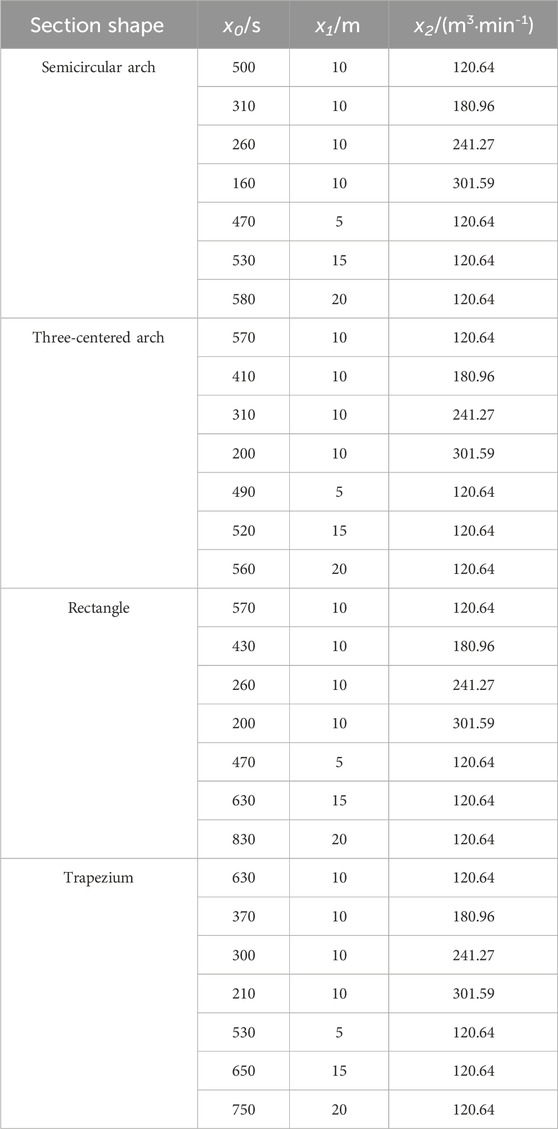
Table 7. Data on the main factors influencing safe time.
MATLAB software was used to substitute the data, and the correlation between the reduction in the dust quality concentration to the safe value in each roadway within the range of 50 m and each factor was obtained through gray correlation analysis, as shown in Figure 15.
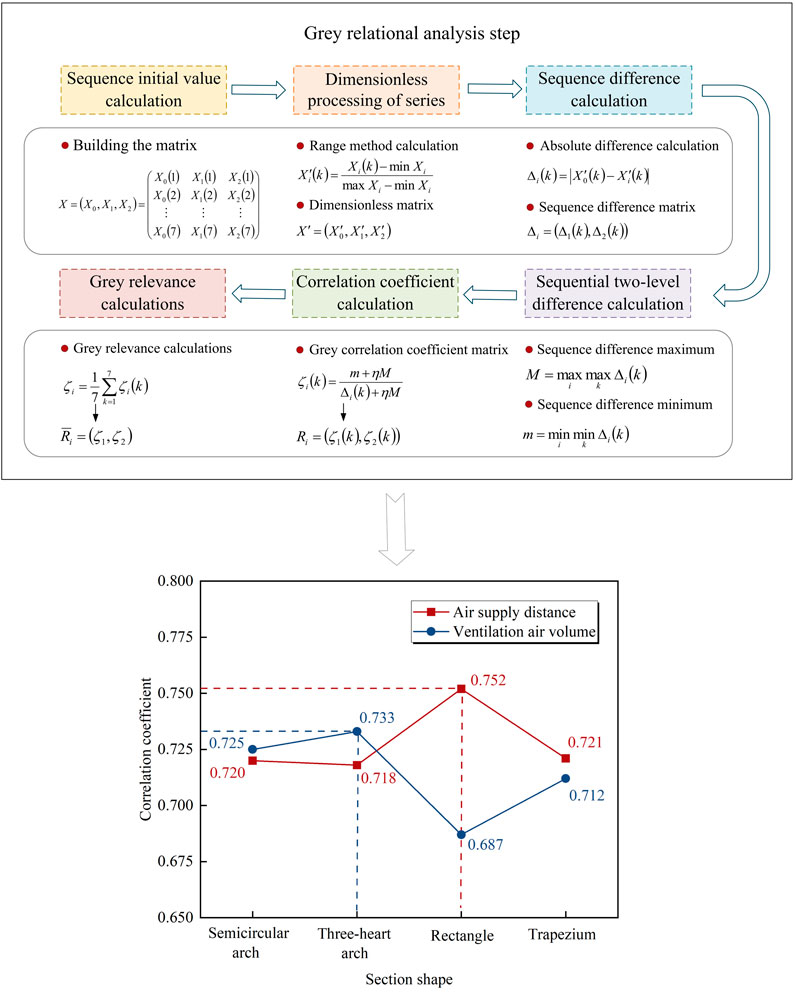
Figure 15. Gray correlation value for each roadway.
The larger the gray correlation, the greater the influence on dust transport after blasting in the roadway boring face, and vice versa. According to Figure 15, the main influences on the time required to reduce the dust mass concentration to a safe value will be different for each roadway due to the influence of the shape of the section. Three-centered arch roadways are more susceptible to the influence of ventilation airflow compared to semicircular arch roadways, rectangular roadways, and trapezoidal roadways. Rectangular roadways are more susceptible to the influence of the distance of air supply compared to semicircular arch roadways, three-centered arch roadways, and trapezoidal roadways. Therefore, in order to improve the construction environment of the roadway after blasting, combining the results of gray correlation degree analysis, the dust characteristics under different air supply distance, and ventilation airflow, rectangular shape can be selected when the ventilation airflow is 120.64 m3/min and the air supply distance is 15 m, and three-centered arch shape is selected when the ventilation airflow is 301.59 m3/min and the air supply distance is 10 m.
(1) Under the conditions of press-in ventilation, although there are differences in the shapes of the roadway sections, the trajectories of the wind flow are similar, showing the vortex zone, transition zone, and stabilization zone, and the wind speeds are in the following order: rectangle > trapezium > three-centered arch > semicircular arch. At 15 m from the exit of the roadway, the wind flow of each roadway enters the “stable section,” and the average wind speed of the roadway section is reduced to approximately 0.2 m/s and gradually stabilized.
(2) After blasting, the dust mass concentration in each roadway section increased rapidly and then decreased gradually, among which the dust concentration fluctuated more in the semicircular arch and three-centered arch roadways. In addition, the dust particles of each particle size in each roadway are pressed with each other, but affected by the shape of the roadway section; the three-centered arch roadway is the first one to arrive near the exit with the ventilation of 90 s, and with the ventilation of 180 s, fewer larger dust particles are found in the roadway, and the distribution of the dust is more sparse.
(3) Setting different ventilation parameters with different cross-section shapes can lead to different dust removal effects. Appropriately shortening or lengthening the air supply distance, there are differences in the distribution of dust in the roadway of each cross-section shape, but the dust diffusion distance obeys the logistic function distribution. When the air supply distances are 5 m and 10 m, the ventilation and dust removal effect is better in the three-centered arch roadway; when the air supply distances are 15 m and 20 m, the effect is better in the rectangular roadway and trapezoidal roadway. When the ventilation airflow is increased, the dust diffusion is accelerated in each roadway, and the dust concentration is gradually reduced, but the peak concentration fluctuates greatly, and by comparing the dust concentration in each roadway, it is found that the three-centered arch has better ventilation and dust removal effect.
(4) The time required to reduce the dust mass concentration to a safe value in both semicircular arch and three-centered arch roadways was mostly affected by the ventilation airflow, followed by the distance of air supply, while the opposite was true for rectangular and trapezoidal roadways, with gray correlation coefficients of semicircular arch roadway (0.720, 0.725), three-centered arch roadway (0.718, 0.733), rectangular roadway (0.752, 0.687), and trapezoidal roadway (0.721, 0.712). Therefore, in order to improve the construction environment after blasting in the roadway, rectangular shape can be chosen when considering the distance of air supply, and the three-centered arch shape can be chosen when considering the ventilation air volume to accelerate dust diffusion.
(5) The research in this paper is limited to the theoretical study on the shape of the roadway section, without taking into account the influence of temperature exchange, wall roughness, internal facilities, and other factors, and because currently, in the practical engineering application, the design of the roadway section is only considered in the case of transportation and pressure of the surrounding rock and no mines in China have adopted various roadway section shapes in the excavation, the follow-up work can be carried out on the distribution of dust in the roadway of different section shapes via laboratory testing. In addition, this study is not only applicable to the design of mine roadway sections but also provides theoretical references for tunnels and urban underground projects.
The original contributions presented in the study are included in the article/Supplementary Material; further inquiries can be directed to the corresponding author.
JL: funding acquisition, writing–original draft, and writing–review and editing. XL: writing–original draft and writing–review and editing. WW: funding acquisition and writing–review and editing. LT: data curation and writing–review and editing. CH: software and writing–review and editing. FC: data curation and writing–review and editing. YC: investigation and writing–review and editing.
The author(s) declare that financial support was received for the research, authorship, and/or publication of this article. This research was funded by the Key Research and Development Plan of Yunnan Province (grant number 202203AC100003), Yunnan Fundamental Research Projects (grant number 202201AU070110), Yunnan University of Finance and Economics Scientific Research Fund Project (grant number 2021D04), and the Key Research and Development Project of Yunnan Province (grant number202003AC100002).
The authors declare that the research was conducted in the absence of any commercial or financial relationships that could be construed as a potential conflict of interest.
All claims expressed in this article are solely those of the authors and do not necessarily represent those of their affiliated organizations, or those of the publisher, the editors, and the reviewers. Any product that may be evaluated in this article, or claim that may be made by its manufacturer, is not guaranteed or endorsed by the publisher.
1. Cai XJ, Nie W, Yin S, Liu Q, Hua Y, Guo L, et al. An assessment of the dust suppression performance of a hybrid ventilation system during the tunnel excavation process: numerical simulation. Process Saf Environ Prot (2021) 152:304–17. doi:10.1016/j.psep.2021.06.007
2. Wang BQ, Zhang C, Liu J. Simulation experimental study on fine dust distribution over roadway section under different wind speeds. China Saf Sci J (2018) 28(03):44–9. doi:10.16265/j.cnki.issn1003-3033.2018.03.008
3. Chen JS, Jiang ZA, Wang M. Numerical simulation and experimental research on dust concentration distribution in belt conveyer roadway. J Hunan Univ (Natural Sciences) (2015) 42(06):127–34. doi:10.16339/j.cnki.hdxbzkb.2015.06.021
4. Hu SY, Liao Q, Wang HT, Feng GR, Xu LH, Huang YS, et al. Gas-solid two-phase flow at high-gassy fully mechanized within high gassy coal seam. J China Coal Soc (2019) 44(12):3921–30. doi:10.13225/j.cnki.jccs.2019.1008
5. Zhang MK, Jia XW, Zhang Q, Ma SL. Optimization study of ventilation parameters of combined pressure and pumping type for general excavation face. Mining Technology (2023) 23(03):13–6. doi:10.13828/j.cnki.ckjs.2023.03.005
6. Xiao JF, Xu F, Fan SX, Lu P, Shen X, Chen ZW. Simulation of dust diffusion in fully mechanized excavation face having large cross-section under FPNA ventilation condition. China Saf Sci J (2017) 27(02):127–32. doi:10.16265/j.cnki.issn1003-3033.2017.02.023
7. Wen H, Mi WS, Fan SX, Xu Y, Cheng X. Simulation study on crucial parameters of long-compressive and short-suction ventilation in large section roadway excavation of LongWangGou coal mine. Environ Sci Pollut Res (2023) 30(3):6435–53. doi:10.1007/s11356-022-22568-x
8. Wang M. Similar simulation study on the flow field structure and the law of dust settlement of heading roadway. Mining Saf and Environ Prot (2021) 48(03):56–61. doi:10.19835/j.issn.1008-4495.2021.03.011
9. Wang M, Jiang ZZ, Tian DM, Zhang C. Numerical simulation on compound ventilation and dust removal in fully mechanized excavation face of rock roadway. J North China Inst Sci Technology (2019) 16(05):11–7.
10. Yu HM, Chen WM, Xie Y, Peng H. Micro-scale pollution mechanism of dust diffusion in a blasting driving face based on CFD-DEM coupled model. Environ Sci Pollut Res Int (2018) 25(22):21768–88. doi:10.1007/s11356-018-1992-4
11. Chu XL, Wei W, Long ZH, Jiang CW, Liu Q, Nie. W Research on air flow and dust distribution law of heading face under different ventilation modes and air pressures. Saf Coal Mines (2023) 54(02):35–9. doi:10.13347/j.cnki.mkaq.2023.02.007
12. Toraño J, Torno S, Menéndez M, Gent M. Auxiliary ventilation in mining roadways driven with roadheaders: validated CFD modelling of dust behaviour. Tunnelling Underground Space Technology (2011) 26(1):201–10. doi:10.1016/j.tust.2010.07.005
13. Jiang W. Flow field and dust migration law of forced ventilation in fully mechanized heading face. Jiaozuo, Henan, Cnina: School of Safety Science and Engineering, Henan University of Science and Technology (2018).
14. Wei JP, Xu XY, Jiang W. Influences of ventilation parameters on flow field and dust migration in an underground coal mine heading. Scientific Rep (2020) 10(1):8563. doi:10.1038/s41598-020-65373-7
15. Li Y, Zhang K, Shi JF, Yan T, Wang L. Influence of ventilation arrangement of digging face on dust transportation pattern. Mining Technology (2022) 22(02):193–6. doi:10.13828/j.cnki.ckjs.2022.02.050
16. Ma DH, Li ZM, Zuo C, Tong LB, Shang YL. Numerical simulation optimization study of dust exhaust ventilation parameters in solo header roadway. Mining Technology (2023) 23(04):217–21. doi:10.13828/j.cnki.ckjs.2023.04.049
17. Xiu ZH, Nie W, Yan JY, Chen D, Cai P, Liu Q, et al. Numerical simulation study on dust pollution characteristics and optimal dust control air flow rates during coal mine production. J Clean Prod (2020) 248:119197. doi:10.1016/j.jclepro.2019.119197
18. Zhou G, Hu YT, Song RX, Sun B, Liu Y, Yang Y. Numerical simulation investigation on optimal air volume for dilution dust-gas by forced ventilation in fully mechanized driving face. Environ Sci Pollut Res (2023) 30(7):17723–40. doi:10.1007/s11356-022-23152-z
19. Jiang W, Xu XY, Wen ZH, Wei L. Applying the similarity theory to model dust dispersion during coal-mine tunneling. Process Saf Environ Prot (2021) 148:415–27. doi:10.1016/j.psep.2020.10.026
20. Zhou G, Zhang LC, Liu RL, Sun B, Kong Y, Huang Z. Numerical simulation investigation for the pollution characteristics of dust particles in the fully mechanized mining face under different air humidity conditions. J Environ Chem Eng (2021) 9(6):106861. doi:10.1016/j.jece.2021.106861
21. Han M, Wang JG, Wang K. Study on the influence of multiple exhaust pipes on dust removal in fully mechanized excavation face. Mining Saf and Environ Prot (2022) 49(05):114–8. doi:10.19835/j.issn.1008-4495.2022.05.019
22. Gui CG, Geng F, Tang JH, Niu H, Zhou F, Liu C, et al. Gas–solid two-phase flow in an underground mine with an optimized air-curtain system: a numerical study. Process Saf Environ Prot (2020) 140:137–50. doi:10.1016/j.psep.2020.04.028
23. Xiao Y, Yang XE, Wang ZP, Li QW, Deng J. Diffusion characteristics of coal dust associated with different ventilation methods in underground excavation tunnel. Process Saf Environ Prot (2024) 184:1177–91. doi:10.1016/j.psep.2024.02.065
24. Jiang ZA, Zeng FB, Feng X, Zhang GL, Yang B, Wang YP. Dynamic model and influencing factors of dust pollution after blasting in high altitude tunnel. J China Coal Soc (2023) 48(01):263–78. doi:10.13225/j.cnki.jccs.Z022.1563
25. Zhao B, Chen JJ. Numerical analysis of particle deposition in ventilation duct. Building Environ (2006) 41(6):710–8. doi:10.1016/j.buildenv.2005.02.030
26. Zhang W, Xue S, Tu QY, Shi G, Zhu Y. Study on the distribution characteristics of dust with different particle sizes under forced ventilation in a heading face. Powder Technology (2022) 406:117504. doi:10.1016/j.powtec.2022.117504
27. Luo YD. Numerical simulation and optimization of ventilation and dust exhaust in long distance tunneling. Jiangxi Univ Sci Technology (2020). doi:10.27176/d.cnki.gnfyc.2020.000637
28. Zhang K, Chen TM, Wang BY, Ma LJ, Liu YQ, Zhang M. Simulation study on dust transport law of extraction ventilation in fully mechanized roadway. Coal Mine Modernization (2022) 31(06):74–7+83. doi:10.13606/j.cnki.37-1205/td.2022.06.022
29. Zhang GL, Jiang ZA, Yang B, Yao SH, Peng Y, Wang YM. Numerical simulation of the minimum mine dust exhausting wind speed under high altitude environment. J China Coal Soc (2021) 46(07):2294–303. doi:10.13225/j.cnki.jccs.2020.0122
30. Zhang XH, Shang ZZ, Feng Z, Liu YJ. Numericaly simulated distribution of the airflow and dust movement in the respiratory zone at the fullvmechanized mining face with great mining height. J Saf Environ (2021) 21(02):570–5. doi:10.13637/j.issn.1009-6094.2020.0056
Keywords: section shape, dust transport, numerical simulation, ventilation parameters, correlation analysis
Citation: Liu J, Luo X, Wang W, Teng L, Hao C, Cai F and Chen Y (2024) Comparative analysis of the influence of different shapes of shaft sections on dust transportation. Front. Phys. 12:1437171. doi: 10.3389/fphy.2024.1437171
Received: 23 May 2024; Accepted: 27 August 2024;
Published: 18 September 2024.
Edited by:
Minping Wan, Southern University of Science and Technology, ChinaReviewed by:
Feifei Qin, Northwestern Polytechnical University, ChinaCopyright © 2024 Liu, Luo, Wang, Teng, Hao, Cai and Chen. This is an open-access article distributed under the terms of the Creative Commons Attribution License (CC BY). The use, distribution or reproduction in other forums is permitted, provided the original author(s) and the copyright owner(s) are credited and that the original publication in this journal is cited, in accordance with accepted academic practice. No use, distribution or reproduction is permitted which does not comply with these terms.
*Correspondence: Wanqing Wang, enoyMTI3QHludWZlLmVkdS5jbg==
Disclaimer: All claims expressed in this article are solely those of the authors and do not necessarily represent those of their affiliated organizations, or those of the publisher, the editors and the reviewers. Any product that may be evaluated in this article or claim that may be made by its manufacturer is not guaranteed or endorsed by the publisher.
Research integrity at Frontiers
Learn more about the work of our research integrity team to safeguard the quality of each article we publish.