 Gaël Craveiro
 Sylvain Leblond
 Xavier Mougeot
 Matthieu Vivier2
- 1Université Paris-Saclay, CEA, List, Laboratoire National Henri Becquerel (LNE-LNHB), Palaiseau, France
- 2IRFU, CEA, Université Paris-Saclay, Gif-sur-Yvette, France
The distortions of measured beta spectra are addressed by means of unfolding algorithms. Two different approaches, the Maximum-Likelihood Expectation-Maximization and the Tikhonov regularization, are tested on various simulated spectra, for which the initial spectrum to retrieve is known, and on a 99Tc spectrum measured with our dedicated setup. Statistical uncertainties of distorted measured spectra are propagated by determining the covariance matrices. Both algorithms provide satisfactory results but Tikhonov performs overall better for most of the studied radionuclides. Highlight is made on the necessity to employ at least two independent methods to ensure the accuracy of the unfolded spectra and to estimate the internal bias of each algorithm.
1 Introduction
The study of the beta spectrum, i.e., the energy distribution of electrons emitted from radioactive isotopes undergoing beta decay, is of great interest in many fields of modern Physics. In fundamental physics, the shape of beta spectra is used to test the Standard Model [1], to search for evidences of new physics [2], or to investigate the antineutrino reactor anomaly (see, e.g., [3–7]). A precise knowledge of beta spectra is also essential in ionizing radiation metrology for primary standardization of pure beta emitters [8–11], or in nuclear medicine for microdosimetry [12, 13] and internal radiotherapy [14].
Precise measurement of beta spectra is challenging because the beta particles are very likely to (back)scatter, to lose energy in dead volumes or to emit bremsstrahlung radiation. The measured spectrum is therefore distorted by the various interactions of the beta particles with the detection system, as well as by its geometrical acceptance and energy resolution. The traditional method to account for these effects is to incorporate the influence of the detection system into the adjustment procedure of the beta spectrum shape [1]. However, this solution requires a theoretical a priori for the beta spectrum and thus biases the deduced results. Some of the theoretical ingredients of the modelling can also be very difficult to recalculate by other researchers, which complicates the reproducibility of the results. Alternatively, experimental distortions can be corrected without relying on any theoretical model using a procedure called unfolding.
Unfolding is a statistical procedure which aims at recovering the true, initial distribution from the observed one. Such a procedure is non-trivial because the unfolding problem is mathematically ill-posed. This problem is common across many fields and numerous algorithms have been developed to tackle similar challenges in the context of neutron spectroscopy [15], tomography [16–18], high-energy physics (HEP) [19–21], or total absorption gamma-ray spectroscopy (TAGS) [22]. However, application of these techniques to beta spectrometry still remains poorly explored. Paulsen et al. in [23] developed a matrix inversion approach to correct for bremsstrahlung photon escape in order to unfold this phenomenon from the beta spectra measured with high-precision low-temperature detectors. Based on this pioneering work, our beta spectrometry group recently adapted the method to unfold beta spectra measured with silicon detectors [24, 25], accounting for the geometrical acceptance and the various materials and dead layers. This approach was nevertheless incomplete as it did not include the energy resolution of the detector.
The present study investigates the performance of unfolding methods applied to the analysis of beta spectra that can be measured with our setup. Close attention was paid to estimate the uncertainty of the unfolded spectrum in order to allow the extraction of physical quantities, such as endpoint energy and shape factor, with well-controlled accuracy. Two different approaches have been selected: the Maximum-Likelihood Expectation-Maximization (MLEM) algorithm and the Tikhonov regularization. In Section 2, these two approaches are presented together with a method to propagate statistical uncertainties. In Section 3, validation and comparison of both algorithms are performed in two steps: first by unfolding a series of simulated spectra, with known input shape; and then by unfolding a 99Tc spectrum measured with our silicon-based detection system. Eventually, we provide some recommendations drawn from our findings. One should note that if the response matrix employed is based on precise pulse simulations of our apparatus, similar conclusions are expected for different experimental configurations as long as the simulation reproduces accurately the phenomena that distort the spectrum.
2 Methods
2.1 Statement of the problem
In beta spectroscopy, as with any detector-based spectroscopic analysis, the observed energy distribution of the emitted beta particles is influenced by the interaction between the electrons and the detection system. These interactions typically result in phenomena such as scattering, finite energy resolution or limited efficiency, which distort the measured spectrum. The recorded spectrum, therefore, represents a convolution of the true beta spectrum with the response of the detection system. To recover the information of interest, the initial emitted spectrum, a mathematical approach is taken. Let
where
The goal of the unfolding problem is to estimate the true spectrum
The true spectrum
In the present work, we investigate two different types of algorithm for unfolding beta spectra. First, the Maximum-Likelihood Expectation-Maximization, an iterative algorithm aiming to find the MLE and for which the regularization is achieved by stopping the algorithm before convergence. Second, the Tikhonov regularization that formulates unfolding as an optimization problem and adds a penalty term to the cost function to stabilize the solution. The usage of two different types of algorithm provides a simple way to better understand the results of the unfolding process and its associated limitations.
2.2 Maximum-Likelihood Expectation-Maximization
MLEM is a well-known method for solving the unfolding problem. It is based on the Expectation-Maximization (EM) algorithm, an iterative method for determining the MLE of parameters from incomplete data [27]. For a Poisson regression model with likelihood function, such as in Eq. 2, the iterative MLEM algorithm is written as
where
where
Beyond retrieving the unfolded spectrum, it is critical for many applications to have a robust estimation of the associated uncertainties. The covariance matrix can be calculated from the uncertainty propagation of
where
the elements of the Jacobian are given by the Eq. 7 as shown in [19]
The variance of the MLEM unfolded spectrum is then estimated from the diagonal elements of
2.3 Tikhonov regularization
Tikhonov regularization aims to solve the unfolding problem by adding a penalty term to the least squares problem. As beta spectra are well known to be smooth, the penalty term can introduce this information by favoring solutions with a small bin-to-bin variation. This results in the following objective function to be minimized:
where the parameter
where
It is noteworthy that the GCV function and the covariance only take the analytical form given above in the case where the minimization of Eq. 8 does not involve any non-negativity constraint. Nevertheless, we found that they are good approximations for our analysis because the average counting rate per bin is high enough in our practical cases, which was validated with various bootstrap tests.
3 Validation and comparison of unfolding methods
In the following sections, the unfolding methods are applied to simulated spectra and to an experimental spectrum. The former were obtained from Monte Carlo simulations of the detection system, described in [24], using theoretical spectra as input. For both simulated and measured spectra, the response matrix was generated from a series of mono-energetic, isotropic electron simulations performed with the Penelope 2014 Monte Carlo code [31]. For comparison purpose, an identical energy binning of 1 keV was considered for all beta spectra in both true and measured spaces. In accordance with the performances of our detection system, an energy threshold of 15 keV and a 9 keV energy resolution were applied.
3.1 Quantification of the comparisons
One of the challenges in unfolding is the optimal determination of the regularization parameter that best reproduces the true spectrum. For the MLEM method, this parameter is the number of iterations, determined with the MLEM-STOP criterion. For the Tikhonov method, the GCV criterion was chosen to estimate the regularization parameter.
To quantify the accuracy of the two algorithms, the root mean square error (RMSE) between the unfolded spectrum
A small RMSE indicates an accurate reconstruction of the true spectrum while a large value suggests a strong deviation.
When applying a given method to a simulated spectrum, the true spectrum is known: it is the input theoretical spectrum. The RMSE can then serve as a criterion for the unfolding algorithm to estimate the true spectrum: by selecting the regularization parameter that minimizes the RMSE, one can construct an optimal estimator of the true emitted spectrum. This optimal estimator is used as a reference to study the regularization parameter deduced without any a priori on the initial spectrum.
For the comparative analysis conducted in Section 3.2, four statistical indicators have been defined:
3.2 Evaluation on simulated data
In this section, the performances of the MLEM and Tikhonov algorithms are evaluated on simulated beta spectra. Twelve pure beta-emitting sources, with various spectrum shapes, energy ranges and counting statistics, were considered to investigate the performance of the two unfolding methods and their sensitivity to statistical fluctuations. Special care was taken to select isotopes whose decay matches the experimental limitations of our detection system: sufficiently long half-lives, simple decay schemes (i.e., a single or a very dominant beta transition), and endpoint energies ranging from 60 keV to 800 keV. Simulated beta spectra were determined from theoretical spectra provided by the BetaShape code [32] convoluted with the response matrix of our apparatus and adding Poisson noise. To minimize the computational time, the size of the response matrix was adapted to the transition energy, with no effect on the unfolding because the simulated spectrum vector is null above the endpoint energy.
We provide as Supplementary Material the full results of our investigation for the twelve selected isotopes: the four RMSE described in Section 3.1 in different tables; and the plots of the theoretical and unfolded spectra. A typical example of unfolding can be seen in Figure 1 for a 36Cl beta source simulated with

Figure 1. Comparison between the true spectrum of the simulated 36Cl beta source with the unfolded spectra obtained with the MLEM method (A) and with the Tikhonov method (B). The relative deviations with the true spectrum are respectively plotted in panel (C, D).
The performance of the algorithms was studied in a two-steps approach: i) using the knowledge of the input theoretical spectrum; and ii) without any a priori, as in the analysis of a real measurement. The direct comparison between the unfolded spectra was first made using
The bias caused by the GCV and MLEM-STOP criteria are then evaluated by comparison with the optimal regularizations. The ratios
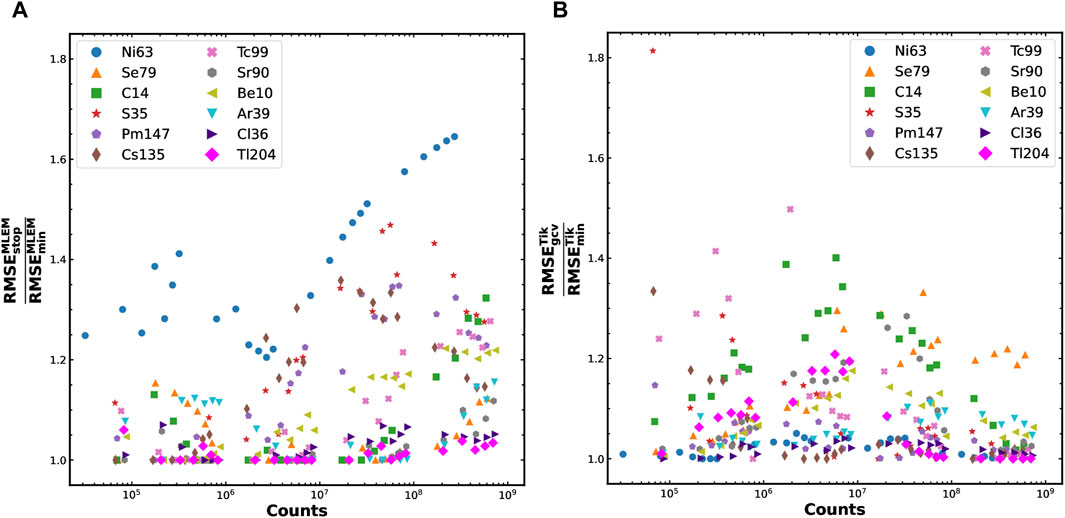
Figure 2. Evolution of the RMSE ratios for the 12 radionuclides as a function of the counting statistics. Panel (A) shows the ratio of
Figure 3 presents the direct comparison of the performances of the MLEM and Tikhonov methods, evaluated respectively with the MLEM-STOP and the GCV criteria. The ratio
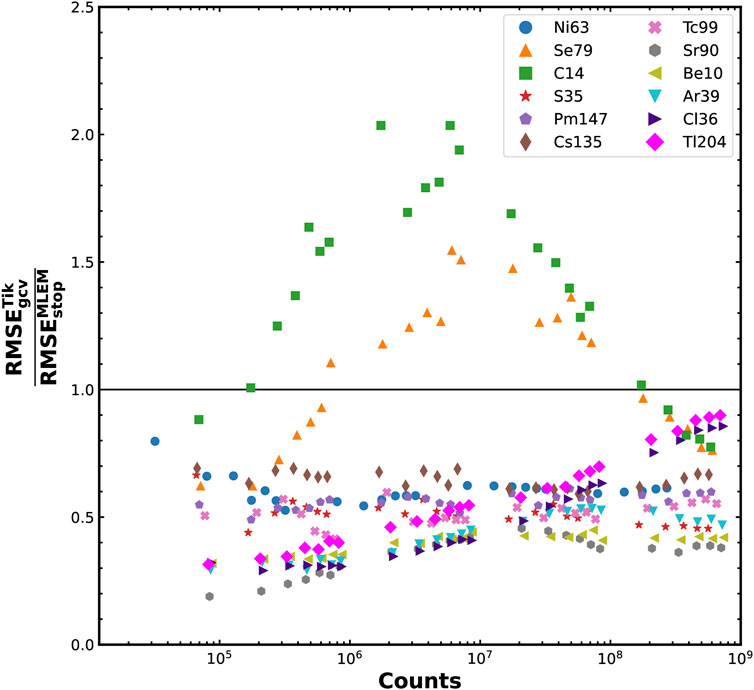
Figure 3. Evolution of the ratio of
The spectra uncertainties were estimated by propagation of the statistical component in Eqs 5, 10. The results are plotted at the 68% confidence level in Figure 1 but cannot be distinguished from the main shape when looking at the whole spectrum. As a matter of fact, the relative uncertainties are below 1% for both methods except in the energy bins close to the endpoint, where they can reach 10% or more due to the small number of counts. It important to highlight that, most notably at low statistics, the deviation between the two algorithms are often larger than the propagated statistical uncertainties. This implies that the choice of an unfolding algorithm introduces a systematic bias at least comparable to the statistical fluctuations. Such phenomenon was expected, and it was recently addressed at the cost of an iterative bootstrap bias-correction [34]. However, a similar treatment was not considered in the present work because the systematic uncertainties on the response matrix are expected to be dominant.
3.3 Evaluation on measured data
In order to evaluate the performance of MLEM and Tikhonov methods on realistic data, the beta spectrum from a 99Tc source previously measured with our detection setup was unfolded. For this measurement, the total event counts was
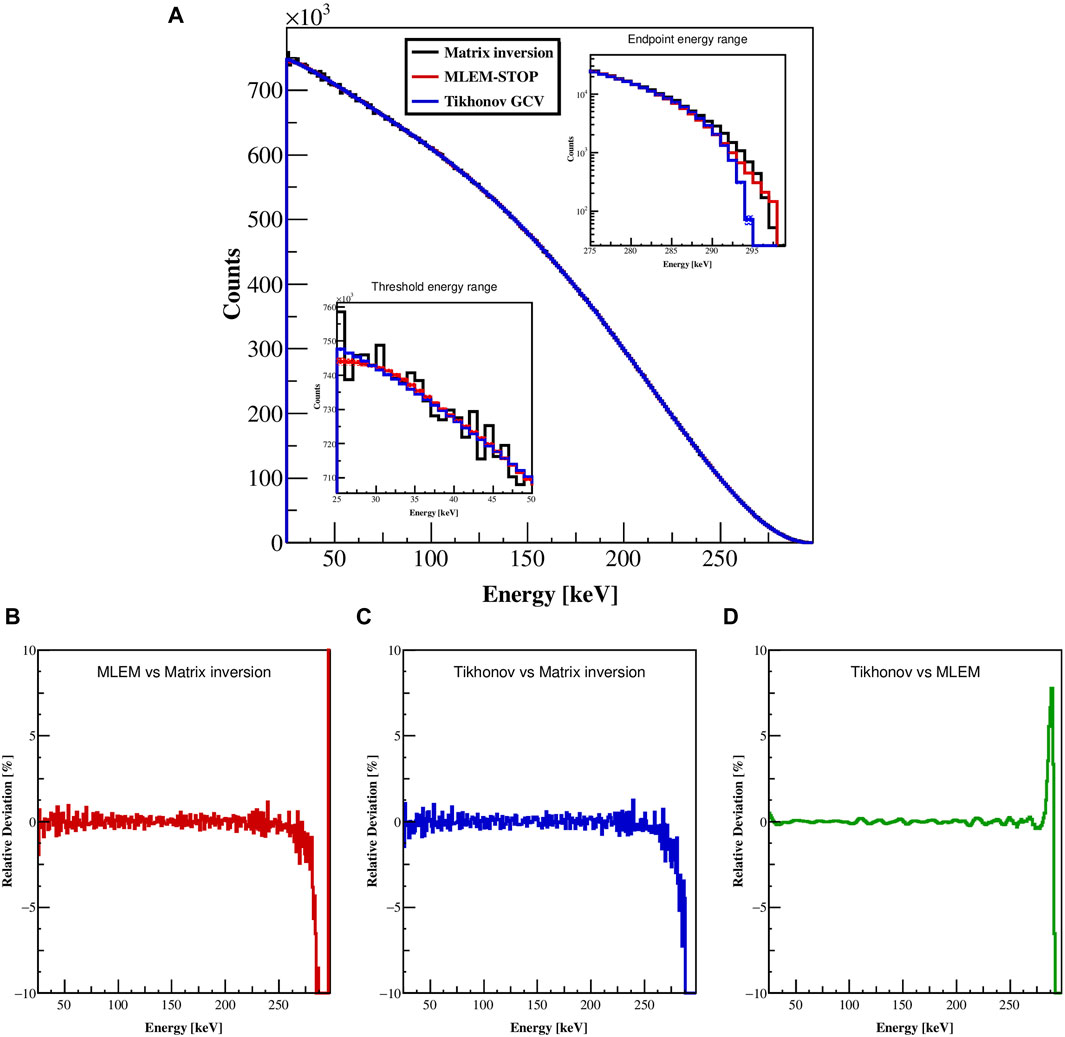
Figure 4. Comparison of the unfolded spectra obtained with the matrix inversion method, the MLEM method and the Tikhonov method of the measured spectrum of 99Tc decay. The upper panel (A) shows the full energy range of the spectra along with two insets which display the energy bins closed to the energy threshold and the endpoint energy. Panel (B–D) depict the relative deviation between the MLEM and matrix inversion spectra, between the Tikhonov and matrix inversion spectra and between the Tikhonov and MLEM spectra, respectively.
For the MLEM algorithm, the MLEM-STOP stopping criterion is reached after six iterations. For the Tikhonov regularization, the GCV minimization estimates a regularization parameter of
At the endpoint, both MLEM and matrix inversion spectra exhibit a comparable trend and have counts up to 298 keV, while Tikhonov spectrum falls down more rapidly to 295 keV. A higher endpoint energy is expected for the matrix inversion method as energy resolution is not accounted for. However, the MLEM unfolding process takes this resolution into account and consequently, the spectrum should be closer to the Tikhonov unfolded spectrum. Similarly to previous observations, this effect is caused by the MLEM-STOP criterion that underestimates the correct number of iterations, leading to an over-regularized spectrum. On the opposite, the endpoint energy obtained with Tikhonov is much more consistent with the most precise 99Tc Q-value of 295.82 (16) keV determined recently with cryogenic detectors [35].
Statistical uncertainties have been propagated following the procedure described in Section 2. Average relative uncertainties have been calculated from 30 keV to 280 keV for the measured spectrum (0.22%) and for the unfolded spectra with matrix inversion (0.09%), MLEM (0.12%) and Tikhonov (0.06%) approaches. The average uncertainties are smaller for the unfolded spectra due to the account of the covariances between the energy bins in the algorithms. The matrix inversion uncertainty appears comparable to the other approaches but the specific response matrix of this method does not include the energy resolution of the detection system.
4 Conclusion
The precise knowledge of beta spectra is valuable for several communities and new measurements are expected in the near future [36]. Robust unfolding algorithms will be necessary to establish unbiased spectrum shapes. In this work, we have studied in minute detail the unfolding of a beta spectrum from all the experimental distortions caused by our 4
The present study highlights that unfolding a beta spectrum remains a thorny process that can easily lead to a misbehavior of any algorithm. The performances of a given algorithm can be sensitive to the spectrum shape, in a way that for sure depends on the detection system. Overall, Tikhonov approach seems to perform better than MLEM, most notably at the edges of the spectrum. However, a reversed conclusion was found for some specific spectrum shapes and counting statistics. We recommend to analyze experimental data with at least two independent algorithms to test the sturdiness of their results. A reasonable analysis can thus be based on Tikhonov approach as the main unfolding method, and the use of MLEM to confirm the results and estimate an internal bias. Finally, it is worth mentioning that all the spectra of our study are single dominant beta transitions, while most beta decaying nuclei feed several nuclear states. Due to the smooth nature of beta spectra, MLEM and Tikhonov algorithms should provide comparable performances on a total spectrum with several branches.
Additional algorithms could also be explored to better estimate this systematic uncertainty component, e.g., based on Markov Chain Monte Carlo methods [15, 34] that allow to choose the regularization strength in a Bayesian framework. Finally, it will also be of importance to assess the uncertainty of the response matrix by quantifying the influence of the simulation input parameters, such as the detection system geometry, the cross-sections of the various scattering processes, or the source auto-absorption. This uncertainty is expected to be the dominant component over the unfolding process.
Data availability statement
The raw data supporting the conclusions of this article will be made available by the authors, upon resonable request.
Author contributions
GC: Conceptualization, Investigation, Methodology, Software, Validation, Visualization, Writing–original draft, Writing–review and editing. SL: Conceptualization, Formal Analysis, Investigation, Methodology, Supervision, Validation, Writing–original draft, Writing–review and editing. XM: Conceptualization, Formal Analysis, Investigation, Methodology, Resources, Supervision, Validation, Writing–original draft, Writing–review and editing. MV: Conceptualization, Formal Analysis, Methodology, Supervision, Writing–review and editing.
Funding
The author(s) declare that financial support was received for the research, authorship, and/or publication of this article. This project was supported in part by the French Agence Nationale de la Recherche under Grant No. ANR-20-CE31-0007-01 (bSTILED).
Conflict of interest
The authors declare that the research was conducted in the absence of any commercial or financial relationships that could be construed as a potential conflict of interest.
Publisher’s note
All claims expressed in this article are solely those of the authors and do not necessarily represent those of their affiliated organizations, or those of the publisher, the editors and the reviewers. Any product that may be evaluated in this article, or claim that may be made by its manufacturer, is not guaranteed or endorsed by the publisher.
Supplementary material
The Supplementary Material for this article can be found online at: https://www.frontiersin.org/articles/10.3389/fphy.2024.1435615/full#supplementary-material
References
1. Rozpedzik D, Keukeleere LD, Bodek K, Hayen L, Lojek K, Perkowski M, et al. Study of weak magnetism by precision spectrum shape measurements in nuclear beta decay. J Phys Conf Ser (2023) 2586:012141. doi:10.1088/1742-6596/2586/1/012141
2. Herczeg P. Beta decay beyond the standard model. Prog Part Nucl Phys (2001) 46:413–57. doi:10.1016/S0146-6410(01)00149-1
3. Mention G, Fechner M, Lasserre T, Mueller TA, Lhuillier D, Cribier M, et al. Reactor antineutrino anomaly. Phys Rev D (2011) 83:073006. doi:10.1103/PhysRevD.83.073006
4. Sonzogni AA, Johnson TD, McCutchan EA. Nuclear structure insights into reactor antineutrino spectra. Phys Rev C (2015) 91:011301. doi:10.1103/PhysRevC.91.011301
5. Hayes AC, Vogel P. Reactor neutrino spectra. Annu Rev Nucl Part Sci (2016) 66:219–44. doi:10.1146/annurev-nucl-102115-044826
6. Hayen L, Kostensalo J, Severijns N, Suhonen J. First-forbidden transitions in the reactor anomaly. Phys Rev C (2019) 100:054323. doi:10.1103/PhysRevC.100.054323
7. Périssé L, Onillon A, Mougeot X, Vivier M, Lasserre T, Letourneau A, et al. Comprehensive revision of the summation method for the prediction of reactor ν¯e fluxes and spectra. Phys Rev C (2023) 108:055501. doi:10.1103/PhysRevC.108.055501
8. Kossert K, Mougeot X. The importance of the beta spectrum calculation for accurate activity determination of 63ni by means of liquid scintillation counting. Appl Radiat Isot (2015) 101:40–3. doi:10.1016/j.apradiso.2015.03.017
9. Kossert K, Marganiec-Galazka J, Mougeot X, Nähle OJ. Activity determination of 60co and the importance of its beta spectrum. Appl Radiat Isot 134 (2018) 212–8. in ICRM 2017 Proceedings of the 21st International Conference on Radionuclide Metrology and its Applications.
10. Kossert K, Mougeot X. Improved activity standardization of 90sr/90y by means of liquid scintillation counting. Appl Radiat Isot (2021) 168:109478. doi:10.1016/j.apradiso.2020.109478
11. Bobin C, Thiam C, M’Hayham MD, Mougeot X. Activity standardization of 60co and 106ru/106rh by means of the tdcr method and the importance of the beta spectrum. Appl Radiat Isot (2023) 201:110993. doi:10.1016/j.apradiso.2023.110993
12. Cross WG, Ing H, Freedman N. A short atlas of beta-ray spectra. Phys Med Biol (1983) 28:1251–60. doi:10.1088/0031-9155/28/11/005
13. Kassis AI. The amazing world of auger electrons. Int J Radiat Biol (2004) 80:789–803. doi:10.1080/09553000400017663
14. Boswell CA, Brechbiel MW. Development of radioimmunotherapeutic and diagnostic antibodies: an inside-out view. Nucl Med Biol (2007) 34:757–78. doi:10.1016/j.nucmedbio.2007.04.001
15. Zhu H, Altmann Y, Fulvio AD, McLaughlin S, Pozzi S, Hero A. A hierarchical bayesian approach to neutron spectrum unfolding with organic scintillators. IEEE Trans Nucl Sci (2019) 66:2265–74. doi:10.1109/TNS.2019.2941317
16. Shepp LA, Vardi Y. Maximum likelihood reconstruction for emission tomography. IEEE Trans Med Imaging (1982) 1:113–22. doi:10.1109/TMI.1982.4307558
17. Green P. Bayesian reconstructions from emission tomography data using a modified em algorithm. IEEE Trans Med Imaging (1990) 9:84–93. doi:10.1109/42.52985
18. Ben Bouallègue F, Crouzet JF, Mariano-Goulart D. A heuristic statistical stopping rule for iterative reconstruction in emission tomography. Ann Nucl Med (2013) 27:84–95. doi:10.1007/s12149-012-0657-5
19. Adye T. Unfolding algorithms and tests using RooUnfold. In: PHYSTAT 2011. Geneva: CERN (2011). p. 313–8. doi:10.5170/CERN-2011-006.313
20. Brenner L, Balasubramanian R, Burgard C, Verkerke W, Cowan G, Verschuuren P, et al. Comparison of unfolding methods using roofitunfold. Int J Mod Phys A (2020) 35:2050145. doi:10.1142/S0217751X20501456
21. Kuusela MJ. Uncertainty quantification in unfolding elementary particle spectra at the Large Hadron Collider. Lausanne, Switzerland: EPFL (2016). Ph.D. thesis.
22. Tain J, Cano-Ott D. Algorithms for the analysis of β-decay total absorption spectra. Nucl Instr Methods Phys Res Section A: Acc Spectrometers, Detectors Associated Equipment (2007) 571:728–38. doi:10.1016/j.nima.2006.10.098
23. Paulsen M, Kossert K, Beyer J. An unfolding algorithm for high resolution microcalorimetric beta spectrometry. Nucl Instr Methods Phys Res Section A: Acc Spectrometers, Detectors Associated Equipment (2020) 953:163128. doi:10.1016/j.nima.2019.163128
24. Singh A, Mougeot X, Leblond S, Loidl M, Sabot B, Nourreddine A. Development of a 4π detection system for the measurement of the shape of β spectra. Nucl Instr Methods Phys Res Section A: Acc Spectrometers, Detectors Associated Equipment (2023) 1053:168354. doi:10.1016/j.nima.2023.168354
25. Singh A. Metrological study of the shape of beta spectra and experimental validation of theoretical models. Université de Strasbourg (2020). Ph.D. thesis.
26. Cowan G. Unfolding. Statistical data analysis. New York: Oxford University Press (1998). p. 153–87.
27. Dempster AP, Laird NM, Rubin DB. Maximum likelihood from incomplete data via the em algorithm. J R Stat Soc Ser B (Methodological) (1977) 39:1–22. doi:10.1111/j.2517-6161.1977.tb01600.x
28. Bro R, De Jong S. A fast non-negativity-constrained least squares algorithm. J Chemometrics: A J Chemometrics Soc (1997) 11:393–401. doi:10.1002/(sici)1099-128x(199709/10)11:5<393::aid-cem483>3.3.co;2-c
29. Tenorio L. Statistical regularization of inverse problems. SIAM Rev (2001) 43:347–66. doi:10.1137/s0036144500358232
30. Fraïsse B, Bélier G, Méot V, Gaudefroy L, Francheteau A, Roig O. Complete neutron-multiplicity distributions in fast-neutron-induced fission. Phys Rev C (2023) 108:014610. doi:10.1103/PhysRevC.108.014610
31. Nuclear Energy Agency Penelope-2014: a code system for Monte Carlo simulation of electron and photon transport. Workshop Proc (Citeseer) (2006) 4:7. doi:10.1787/4e3f14db-en
32. Mougeot X. Atomic exchange correction in forbidden unique beta transitions. Appl Radiat Isot (2023) 201:111018. doi:10.1016/j.apradiso.2023.111018
33. Montgomery L, Landry A, Al MG, Mathew F, Kildea J. A novel mlem stopping criterion for unfolding neutron fluence spectra in radiation therapy. Nucl Instr Methods Phys Res Section A: Acc Spectrometers, Detectors Associated Equipment (2020) 957:163400. doi:10.1016/j.nima.2020.163400
34. Kuusela M, Panaretos VM. Statistical unfolding of elementary particle spectra: empirical Bayes estimation and bias-corrected uncertainty quantification. The Ann Appl Stat (2015) 9:1671–705. doi:10.1214/15-AOAS857
35. Paulsen M, Ranitzsch P, Loidl M, Rodrigues M, Kossert K, Mougeot X, et al. High precision measurement of the 99Tc β spectrum (2023).
Keywords: beta spectra, experimental distortions, unfolding, MLEM, Tikhonov, uncertainties
Citation: Craveiro G, Leblond S, Mougeot X and Vivier M (2024) Unfolding experimental distortions in beta spectrometry. Front. Phys. 12:1435615. doi: 10.3389/fphy.2024.1435615
Received: 20 May 2024; Accepted: 22 July 2024;
Published: 12 August 2024.
Edited by:
Alejandro Algora, University of Valencia, SpainReviewed by:
Magali Estienne, UMR6457 Laboratoire de Physique Subatomique et des Technologies Associées (SUBATECH), FranceMarco La Commara, University Federico II, Italy
Copyright © 2024 Craveiro, Leblond, Mougeot and Vivier. This is an open-access article distributed under the terms of the Creative Commons Attribution License (CC BY). The use, distribution or reproduction in other forums is permitted, provided the original author(s) and the copyright owner(s) are credited and that the original publication in this journal is cited, in accordance with accepted academic practice. No use, distribution or reproduction is permitted which does not comply with these terms.
*Correspondence: Sylvain Leblond, c3lsdmFpbi5sZWJsb25kQGNlYS5mcg==