 Md Motiur Rahman Sagar1*
 Angelika Svetlove1
 Lorenzo D’Amico2,3Diana Pinkert-Leetsch4Jeannine Missbach-Guentner4
 Elena Longo2
 Giuliana Tromba2Hanibal Bohnenberger5
 Frauke Alves1,4,6
 Christian Dullin1,2,4,7
- 1Translational Molecular Imaging, Max-Plank-Institute for Multidisciplinary Sciences, Goettingen, Germany
- 2Elettra Synchrotron SCpa Trieste, Trieste, Italy
- 3Department of Physics, University of Trieste, Trieste, Italy
- 4Institute for Diagnostic and Interventional Radiology, University Medical Center Goettingen, Goettingen, Germany
- 5Clinical Pathology, University Medical Center Goettingen, Goettingen, Germany
- 6Clinic for Haematology and Medical Oncology, University Medical Center Goettingen, Goettingen, Germany
- 7Diagnostic and Interventional Radiology, University Hospital Heidelberg, Heidelberg, Germany
Synchrotron radiation propagation-based phase-contrast micro-computed tomography (SR
1 Introduction
Micro computed tomography (micro-CT) has become a well-established method to study fixed tissue specimens in 3D at cellular resolution - an application often called virtual histology [1–3]. Especially, phase contrast computed tomography with its elevated soft-tissue contrast is often utilized for this purpose as it does not require any additional staining of the tissue and performs well in standard formalin fixed and paraffin embedded (FFPE) tissue [4]. In addition, it has been shown that propagation based imaging (PBI) acquisition does not interfere with subsequent histological analysis [3, 5], allows guiding the histological sectioning process to regions of interest [6] and enables the registration of additional follow-up spatially resolved analysis techniques such as classical histology [7] or atomic force microscopy [8]. Moreover, PBI can be used to supplement studies that deal with 3D structural analysis [9–11] of tissue specimens. Due to these facts, PBI based tissue analysis is becoming more prevalent in biomedical research [12–19].
The principle of PBI is to generate images in which the contrast is predominantly related to phase shifts rather than to x-ray attenuation as used in classical CT. To this end, typically, a so-called phase retrieval algorithm is employed prior to 3D reconstruction. Phase retrieval algorithms rely either on the acquisition of data at multiple sample-to-detector distances [20] or in case of single-distance, on rigorous assumptions regarding the optical properties of the studied specimens. Probably, the most popular algorithm for single distance phase retrieval is the homogeneous form of the Transport-of-Intensity equation (TIE-HOM) [21], which assumes that the studied object is weakly absorbing or has a constant ratio between absorption and phase shift - conditions that in multi-tissue specimens are strictly never fulfilled. As a consequence the parameter of the algorithm can be tuned to generate sharp interfaces only for a specific material combination, leaving other interfaces slightly blurred. This effect has been described by Beltran et al. [22] proposing a combination of multiple phase retrieval steps.
In addition, the quality of the obtained PBI scans highly depends on the method and quality of the sample preparation. While FFPE is doubtlessly the most widely used method for preserving tissue and making it available for subsequent analysis, it has several limitations when used in combination with PBI: a) air bubbles within the embedded tissue or on its surface are often unavoidable leading to strong contrast in PBI; b) the typical high x-ray radiation dose can cause progressive crack formation resulting in motion artifacts in the reconstructed data; and c) the granulated paraffin used in the embedding process of FFPE specimens are prone to become brittle when imaged under a strong x-ray exposure which in turn complicates the subsequent sectioning process for histological analysis. Other embedding materials such as agarose or resin are often not suitable alternatives either. Agarose tends to boil especially at the tissue surface while being scanned under strong x-ray radiation, and due to required re-embedding step of specimens into paraffin, follow-up histological analysis becomes more challenging. This problems of air bubble formation and movement has also been seen in Agar by Strotton et al. [23]. Resin withstands strong irradiation but is usually not suitable for routine soft-tissue histology due to long embedding time and more complicated cutting procedures [24].
In this study, we compare PBI based virtual histology of human colon cancer biopsies scanned as FFPE tissue blocks with images obtained of the same samples embedded in Phytagel following optical clearing and scanned in the optical clearing solution benzyl alcohol/benzyl benzoate (BABB). Here we show that the SR
2 Methods
2.1 Ethics
Human colon carcinoma specimens from different patients were obtained from the Department of Pathology, University Medical Center (Göttingen, Germany) where pathological diagnosis was made as part of each patient’s treatment plan. The study was performed according to the guidelines of the local ethics committee of the University Medical Center Göttingen (permission number 24/4/20) and in accordance with the declaration of Helsinki.
2.2 Sample preparation
Human colon carcinoma specimens were formalin fixed (4% PFA for 24 h) and paraffin embedded using the following steps (3 h 60% ethanol, 3 h 75% ethanol, 3 h 96% ethanol, 3 h 100% ethanol, 3 h xylol, transferred and kept in warm paraffin prior embedding). A histology section of 2.5
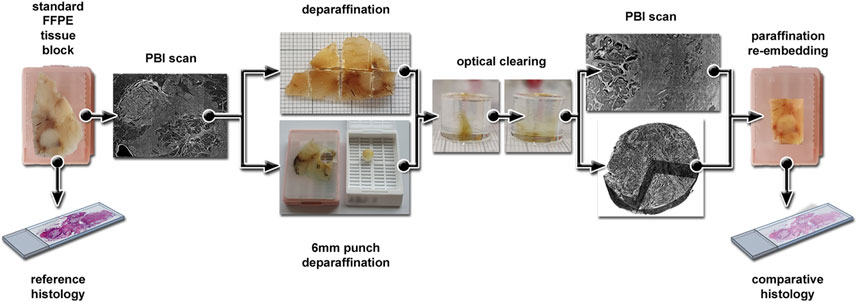
Figure 1. Visualization of the experimental workflow. Standard FFPE tissue blocks of human colon cancer specimens were used and a reference H&E stained histological section prepared. First, a PBI scan was performed and the specimen was either deparaffinized and split into pieces of approximately 5 × 5 mm size, or punch biopsies of 6 mm diameter were obtained followed by a deparaffinization step. The samples were then embedded in Phytagel and optical cleared in BABB followed by a second PBI scan. To demonstrate the compatibility of the clearing protocol with classical histology the optical cleared samples were re-embedded in paraffin blocks and cut in 2
2.3 Phase contrast microCT imaging and image reconstruction
All samples were scanned at the SYRMEP beamline of the Italian synchrotron Elettra using PBI with a white/pink beam setup. After the acquisition, single-distance phase retrieval (TIE-HOM [21]) was applied prior to 3D reconstruction with a standard filtered back projection algorithm. Parameters used are summarized in Table 1.
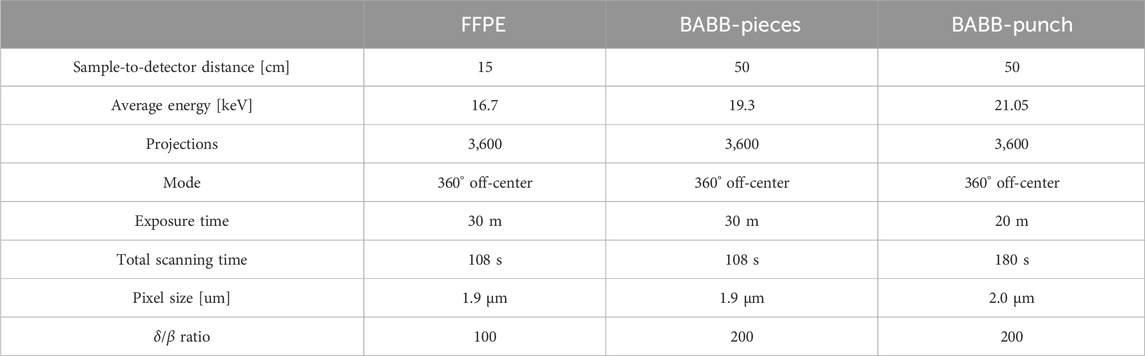
Table 1. Acquisition and image reconstruction parameters for the different specimen types.
2.4 Parameters used for quantitative image quality assessment
For a comprehensive image quality assessment the following parameters such as contrast, noise and sharpness need to be calculated in parallel. Here we evaluated contrast-to-noise ratio (CNR) between homogeneous tissue regions and the embedding material (paraffin or Phytagel respectively). The CNR is calculated using the following equation:
here,
2.5 Software
Phase retrieval and reconstruction of the synchrotron data was performed with SYRMEP Tomo Project (STP v1.5.2) [27]. CNR and FWHM were calculated using values extracted from micro-CT data using Fiji [28]. Statistical analysis and display of the result was done with statannot v0.2.3 [29] and seaborn v0.12.2 [30] using a Welch T-test with Bonferroni correction for multiple comparison (**** = p < 1e-4, *** = p < 1e-3, ** = p < 0.01, * = p < 0.05 and ns = not significant).
3 Results and discussion
3.1 Visual image quality assessment
In Figure 2, a visual comparison of a specimen imaged in FFPE condition (Figure 2A, magnified regions Figures 2B, C) and after optical clearing (Figure 2D, magnified region Figure 2E) is presented with a corresponding histological slice taken prior PBI imaging (Figure 2F). Five consecutive scans were performed to cover the core part of the FFPE specimen. The scanned region is indicated on the histological image (turquoise rectangle, Figure 2F). Note, that anatomical structures such as mucin rich areas (#), lymphatic tissue (blue arrow head), fat ($), and muscle structures (m) can be identified. The magnified area in Figure 2B highlights the image quality that was achieved in a mucin rich region of the specimen scanned in FFPE condition where artifacts such as air inclusion are visible in Figure 2C (§). One of the optical cleared tissue pieces (indicated in yellow in Figure 2F) of the same specimen is shown in Figure 2D. While a direct comparison of the grey values in 3D rendering of the PBI scans is difficult to achieve, the optical cleared PBI data did not show any artifacts and the tissue structures and contrast appeared to be consistent with the PBI data set of the FFPE specimen as further indicated in the detailed 2D view (Figure 2E). The red arrow heads in Figure 2A and f indicate the deformation that occurred during the histological sectioning process of FFPE blocks, which also caused tissue ruptures, e.g., in areas marked with white asterisks (Figure 2F).
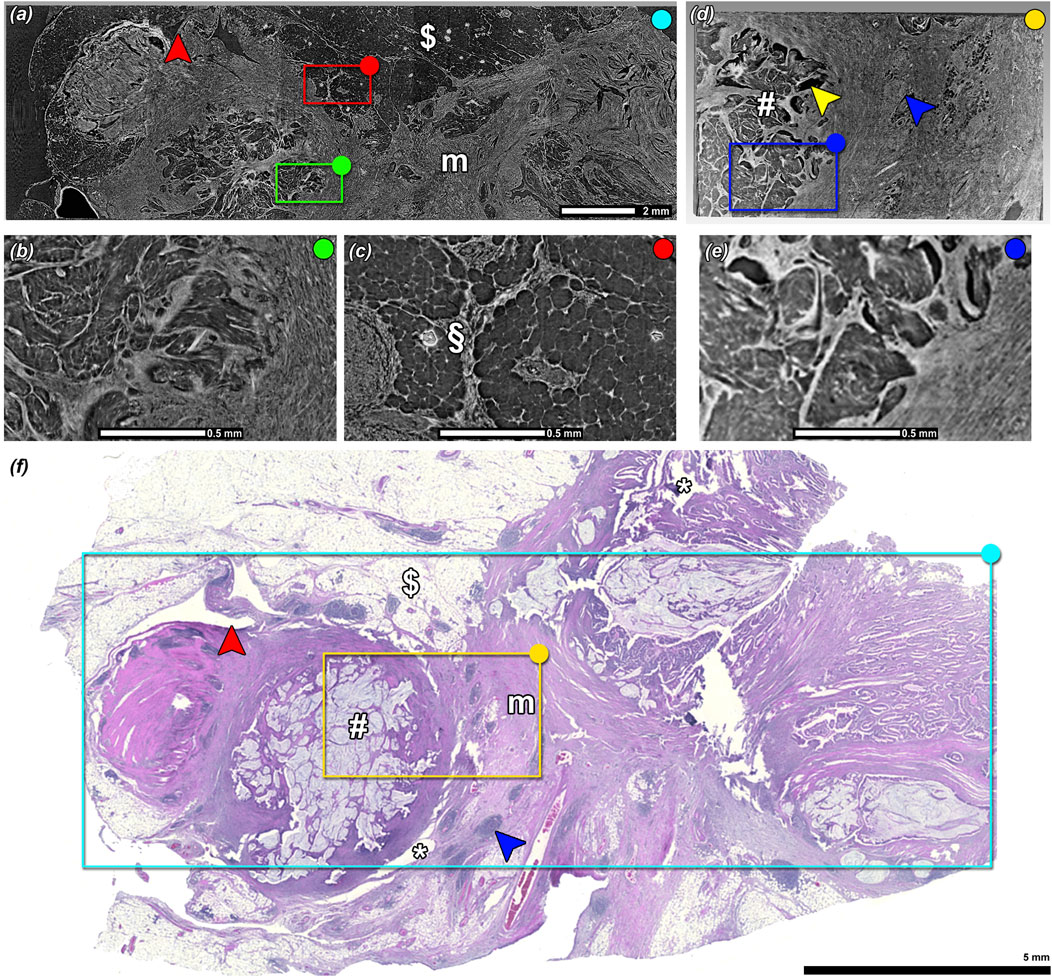
Figure 2. Comparison of PBI image between standard FFPE and BABB optical cleared tissue specimens. PBI scans obtained in FFPE condition (A) before optical clearing where (B) and (C) highlights the magnified regions of (A). (D) PBI scans after BABB optical clearing where (E) shows the magnified region of (D). (F) A-priori performed H&E stained histological section. (#) marks cancer derived mucin, ($) fat tissue, (m) tumor induced fibrotic desmoplasia, (blue arrow head) lymph follicle. While the FFPE scan had some artifacts such as air bubbles (§), note that none of those were found in the scan of the BABB cleared sample. The red arrow head indicates a region in which strong tissue deformation occurred in the histological sectioning process. The (*) marks regions that were ruptured. By visually assessing (B) and (E) the BABB sample data seems to provide comparable contrast and level of details found in the FFPE sample data.
Micro-CT scans of the BABB optical cleared sample showed different tissue structures in details analogous to the FFPE tissue specimen. In addition, the BABB samples were free from apparent artifacts like air inclusions but showed minor shrinkage in the mucin rich regions (yellow arrow head, Figure 2D). The fact that all data were acquired with the same pixel size and obtained image quality appeared to be similar if not better in the BABB specimens, proving that indeed optical clearing is a viable alternative tissue preparation method for PBI setup. Although tissue embedded in other materials such as in agarose gel has been successfully scanned at synchrotron CT setups by different groups [5, 23], typically the large dose deposition bears the risk of melting the agarose gel which results in air bubble formation, especially at the tissue surface. Here using Pythagel instead of agarose gel in combination with optical clearing resulted in vastly transparent tissue specimens, thus the dose deposition was reduced and as a consequence no bubble formation was observed.
3.2 Quantitative image quality assessment
For quantitative image quality analysis, the CNR between tissue and embedding material was calculated. The evaluated noise in a tissue region by measuring standard deviation of the gray values is constrained by the heterogeneity of the tissue structures and therefore overestimated the actual noise. Thus, the calculated CNR values underrepresented the real CNR of the data set. Figure 3A shows an example for a BABB cleared punch specimen. Clearly the complex architecture of the specimen can be resolved nearly at a cellular level. As shown in Figure 3B, a significant increase in CNR from FFPE (1.4
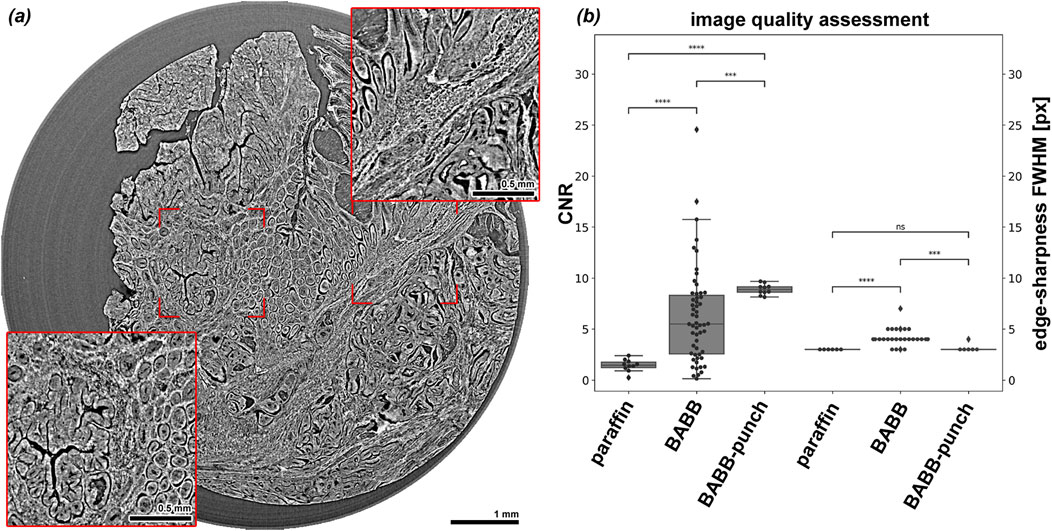
Figure 3. Image quality of BABB cleared colon cancer samples in ideal specimen conditions and quantitative image quality analysis results. (A) Shows a representative slice through a scan of a BABB-punch biopsy sample. Clearly, the tissue architecture can be visualized in great detail. (B) Displays that significantly higher CNRs were obtained in BABB cleared tissue pieces and even higher values in the BABB cleared punched biopsies, while the edge sharpness stayed roughly the same in both conditions, here 3 to 4 pixels (px).
The images of BABB cleared samples show a higher CNR and a comparable edge sharpness to the FFPE tissue. The punched samples with a diameter of 6 mm and precise cylindrical shape are ideal for PBI CT imaging at this resolution of 2
To further illustrate the differences in the obtained image quality as well as to motivate the choice of the different parameter, Figure 4 shows edge profiles in Figures 4A–4C of a BABB-punch and Figures 4D–4F of a FFPE specimen. The data was reconstructed with
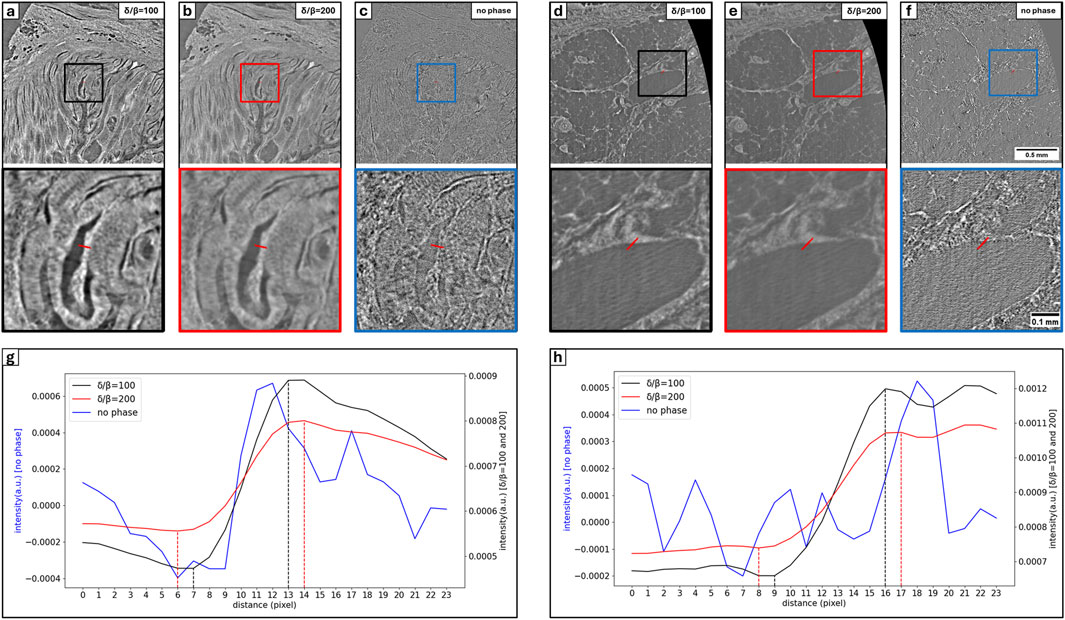
Figure 4. Comparison of intensity profile at the tissue interface with phytagel and paraffin for BABB punch and FFPE specimen respectively. Considered intensity profile (red line) is illustrated in (A–C) for the BAAB punch and in (D–F) for the FFPE specimen with corresponding zoomed region (bottom rectangle). In both conditions specimens are reconstructed with
3.3 Compatibility for subsequent histological analysis
Following the imaging session and after removal of the Phytagel, the BABB optical cleared samples were re-embedded into paraffin. Next we validated if classical histology would still be possible to obtain comparable quality to routine paraffin sections. Figure 5 shows approximately the same region of the original H&E stained histological section (Figure 5A) in comparison to the PBI image (Figure 5B) and to H&E stained section of the re-embedded specimen (Figure 5C). A precise registration of the three data sets could not be achieved as changing the condition of the specimen led to small deformations. However, it can be seen in Figure 5C that the overall quality of the H&E staining is not diminished compared to the standard workflow using standard paraffin sections (Figure 5A). Thus, we propose that BABB optical clearing can be an applicable method for sample preparation for PBI alternative to FFPE tissue blocks even if the use of light sheet microscopy (LSM) is not intended, for which the clearing protocol was originally invented. However, the Phytagel embedded BABB cleared specimens cannot directly be cut with a classical microtome. Re-embedding in paraffin is required which led to comparable quality of histological images but may introduce tissue shrinkage and deformation rendering spatial integration of other imaging data as shown by [8] more challenging.
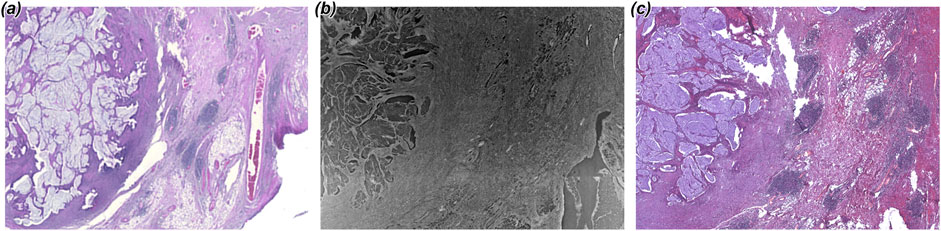
Figure 5. Comparison of H&E stained sections before and after optical clearing. (A) shows a region from the H&E stained histological slice obtained at the beginning of the workflow. (B) shows the PBI imaging result of the corresponding BABB cleared piece. (C) Presents a H&E stained slice after re-paraffinization and re-embedding of the same piece. While the colors are slightly different, no diminished quality of the histological section was found.
3.4 Applicability for other optical clearing methods
In this publication we focused solely on BABB clearing protocol. The contrast for specimen phase contrast CT seems way higher for dehydrated tissue then for fresh tissue or tissue in aqueous solutions as for instance demonstrated by Takeda et al. [31]. The good results with BABB are therefore most likely based on its ethanol content. Thus, it can be assumed that clearing protocols based on aqueous solutions will result in lower contrast in phase contrast CT. However, further tests are required to validate this assumption.
3.5 Summary
Here we present an alternative tissue sample preparation method and compared the image quality of PBI micro-CT scans of standard FFPE embedded with proposed BABB cleared human colon cancer specimens. The usage of the BABB optical clearing protocol yielded in an equivalent CNR and edge sharpness. In addition, typical challenges of FFPE tissue scans such as air inclusions and crack formation did not occur in the BABB specimens. We also show that optical clearing does not obstruct the possibility of subsequent classical histological analysis. Thus, we believe that BABB clearing not only is suitable for LSM but also presents a possible tissue preparation protocol for PBI virtual histology approaches. In addition, deep learning methods where both LSM and micro-CT data are used to train models to predict clinical outcomes [32] by detecting morphological features in the tissue would benefit tremendously from the fact that the same specimens in the same conditions could be used in both methods.
Data availability statement
The raw data supporting the conclusions of this article will be made available by the authors, without undue reservation.
Ethics statement
The studies involving humans were approved by the local ethics committee of the University Medical Center Göttingen (permission number 24/4/20). The studies were conducted in accordance with the local legislation and institutional requirements. The human samples used in this study were acquired from gifted from another research group. Written informed consent for participation was not required from the participants or the participants’ legal guardians/next of kin in accordance with the national legislation and institutional requirements.
Author contributions
MS: Conceptualization, Data curation, Formal Analysis, Investigation, Methodology, Software, Visualization, Writing–original draft, Writing–review and editing. AS: Data curation, Investigation, Methodology, Software, Writing–review and editing. LD: Data curation, Investigation, Methodology, Software, Visualization, Writing–review and editing. DP-L: Methodology, Writing–review and editing. JM-G: Funding acquisition, Methodology, Writing–review and editing. EL: Data curation, Investigation, Writing–review and editing. GT: Conceptualization, Methodology, Project administration, Resources, Supervision, Writing–review and editing. HB: Formal Analysis, Methodology, Writing–review and editing. FA: Conceptualization, Funding acquisition, Methodology, Project administration, Resources, Supervision, Writing–review and editing. CD: Conceptualization, Data curation, Formal Analysis, Funding acquisition, Investigation, Methodology, Project administration, Software, Supervision, Visualization, Writing–original draft, Writing–review and editing.
Funding
The author(s) declare that financial support was received for the research, authorship, and/or publication of this article. The project was partially funded by the Niedersächsisches Ministerium für Wissenschaft und Kultur (MWK, ZN3822) and the EuroBioImaging (www.eurobioimaging.eu) initiative.
Acknowledgments
The authors thank Julia Fascher, Sabine Wolfgramm, Bettina Jeep, Sarah Garbode, Bärbel Heidrich and Regine Kruse for excellent technical assistance. We also like to express our gratitude to all members of the phase contrast CT imaging node of EuroBioImaging at the Italian synchrotron including the engineering department and the scientific computing group.
Conflict of interest
Authors LD, EL, GT and CD were employed by Elettra Synchrotron SCpa Trieste.
The remaining authors declare that the research was conducted in the absence of any commercial or financial relationships that could be construed as a potential conflict of interest.
Publisher’s note
All claims expressed in this article are solely those of the authors and do not necessarily represent those of their affiliated organizations, or those of the publisher, the editors and the reviewers. Any product that may be evaluated in this article, or claim that may be made by its manufacturer, is not guaranteed or endorsed by the publisher.
References
1. Albers J, Pacilé S, Markus MA, Wiart M, Vande Velde G, Tromba G, et al. X-ray-based 3d virtual histology—adding the next dimension to histological analysis. Mol Imaging Biol (2018) 20:732–41. doi:10.1007/s11307-018-1246-3
2. Frohn J, Pinkert-Leetsch D, Missbach-Güntner J, Reichardt M, Osterhoff M, Alves F, et al. 3d virtual histology of human pancreatic tissue by multiscale phase-contrast x-ray tomography. J Synchrotron Radiat (2020) 27:1707–19. doi:10.1107/s1600577520011327
3. Donato S, Arana Peña LM, Arfelli F, Brombal L, Colmo L, Longo R, et al. Integrating x-ray phase-contrast imaging and histology for comparative evaluation of breast tissue malignancies in virtual histology analysis. Scientific Rep (2024) 14:5831. doi:10.1038/s41598-024-56341-6
4. Saccomano M, Albers J, Tromba G, Dobrivojević Radmilović M, Gajović S, Alves F, et al. Synchrotron inline phase contrast μct enables detailed virtual histology of embedded soft-tissue samples with and without staining. J synchrotron Radiat (2018) 25:1153–61. doi:10.1107/S1600577518005489
5. Dullin C, Ufartes R, Larsson E, Martin S, Lazzarini M, Tromba G, et al. μct of ex-vivo stained mouse hearts and embryos enables a precise match between 3d virtual histology, classical histology and immunochemistry. PloS one (2017) 12:e0170597. doi:10.1371/journal.pone.0170597
6. Albers J, Markus MA, Alves F, Dullin C. X-ray based virtual histology allows guided sectioning of heavy ion stained murine lungs for histological analysis. Scientific Rep (2018) 8:7712. doi:10.1038/s41598-018-26086-0
7. Albers J, Svetlove A, Alves J, Kraupner A, di Lillo F, Markus MA, et al. Elastic transformation of histological slices allows precise co-registration with microct data sets for a refined virtual histology approach. Scientific Rep (2021) 11:10846. doi:10.1038/s41598-021-89841-w
8. D’Amico L, Svetlove A, Longo E, Meyer R, Senigagliesi B, Saccomano G, et al. Characterization of transient and progressive pulmonary fibrosis by spatially correlated phase contrast microct, classical histopathology and atomic force microscopy. Comput Biol Med (2024) 169:107947. doi:10.1016/j.compbiomed.2024.107947
9. Khan A, Markus AM, Svetlove A, Hülsmann S, Alves F, Dullin C (2023). Monitoring the response to nintedanib treatment in a mouse model of lung fibrosis using longitudinal x-ray based lung function measurement. Research Squ. doi:10.21203/rs.3.rs-2780852/v1
10. de Oliveira CS, González AT, Hedtke T, Kürbitz T, Heilmann A, Schmelzer CE, et al. Direct three-dimensional imaging for morphological analysis of electrospun fibers with laboratory-based zernike x-ray phase-contrast computed tomography. Mater Sci Eng C (2020) 115:111045. doi:10.1016/j.msec.2020.111045
11. Eckermann M, Frohn J, Reichardt M, Osterhoff M, Sprung M, Westermeier F, et al. 3d virtual pathohistology of lung tissue from covid-19 patients based on phase contrast x-ray tomography. Elife (2020) 9:e60408. doi:10.7554/elife.60408
12. Taba ST, Baran P, Lewis S, Heard R, Pacile S, Nesterets YI, et al. Toward improving breast cancer imaging: radiological assessment of propagation-based phase-contrast ct technology. Acad Radiol (2019) 26:e79–e89. doi:10.1016/j.acra.2018.07.008
13. Horng A, Brun E, Mittone A, Gasilov S, Weber L, Geith T, et al. Cartilage and soft tissue imaging using x-rays: propagation-based phase-contrast computed tomography of the human knee in comparison with clinical imaging techniques and histology. Invest Radiol (2014) 49:627–34. doi:10.1097/rli.0000000000000063
14. Peña LA, Donato S, Bonazza D, Brombal L, Martellani F, Arfelli F, et al. Multiscale x-ray phase-contrast tomography: from breast ct to micro-ct for virtual histology. Physica Med (2023) 112:102640. doi:10.1016/j.ejmp.2023.102640
15. Riedel M, Hammel JU, Moosmann J, Beckmann F, Schwarzenberg F, Schuetz P, et al. Quantitative phase-contrast x-ray micro ct for visualization of mouse lymph nodes. Dev X-Ray Tomography XIV (Spie) (2022) 12242:224–30. doi:10.1117/12.2631184
16. Barbone GE, Bravin A, Mittone A, Grosu S, Ricke J, Cavaletti G, et al. High-spatial-resolution three-dimensional imaging of human spinal cord and column anatomy with postmortem x-ray phase-contrast micro-ct. Radiology (2021) 298:135–46. doi:10.1148/radiol.2020201622
17. Eckermann M, Van der Meer F, Cloetens P, Ruhwedel T, Möbius W, Stadelmann C, et al. Three-dimensional virtual histology of the cerebral cortex based on phase-contrast x-ray tomography. Biomed Opt express (2021) 12:7582–98. doi:10.1364/boe.434885
18. Cercos-Pita J-L, Fardin L, Leclerc H, Maury B, Perchiazzi G, Bravin A, et al. Lung tissue biomechanics imaged with synchrotron phase contrast microtomography in live rats. Scientific Rep (2022) 12:5056. doi:10.1038/s41598-022-09052-9
19. Pinkert-Leetsch D, Frohn J, Ströbel P, Alves F, Salditt T, Missbach-Guentner J. Three-dimensional analysis of human pancreatic cancer specimens by phase-contrast based x-ray tomography–the next dimension of diagnosis. Cancer Imaging (2023) 23:43. doi:10.1186/s40644-023-00559-6
20. Langer M, Cloetens P, Guigay JP, Valton S, Peyrin F. Quantitative evaluation of phase retrieval algorithms in propagation based phase tomography. In: 2007 4th IEEE international symposium on biomedical imaging: from Nano to Macro (IEEE) (2007). p. 552–5.
21. Paganin D, Mayo SC, Gureyev TE, Miller PR, Wilkins SW. Simultaneous phase and amplitude extraction from a single defocused image of a homogeneous object. J Microsc (2002) 206:33–40. doi:10.1046/j.1365-2818.2002.01010.x
22. Beltran MA, Paganin DM, Uesugi K, Kitchen MJ. 2d and 3d x-ray phase retrieval of multi-material objects using a single defocus distance. Opt Express (2010) 18:6423–36. doi:10.1364/oe.18.006423
23. Strotton MC, Bodey AJ, Wanelik K, Darrow MC, Medina E, Hobbs C, et al. Optimising complementary soft tissue synchrotron x-ray microtomography for reversibly-stained central nervous system samples. Scientific Rep (2018) 8:12017. doi:10.1038/s41598-018-30520-8
24. Maglio M, Salamanna F, Brogini S, Borsari V, Pagani S, Nicoli Aldini N, et al. Histological, histomorphometrical, and biomechanical studies of bone-implanted medical devices: hard resin embedding. Biomed Res Int (2020) 2020:1–13. doi:10.1155/2020/1804630
25. Cardiff RD, Miller CH, Munn RJ. Manual hematoxylin and eosin staining of mouse tissue sections. Cold Spring Harbor Protoc (2014) 2014:pdb.prot073411. doi:10.1101/pdb.prot073411
26. Dullin C, di Lillo F, Svetlove A, Albers J, Wagner W, Markus A, et al. Multiscale biomedical imaging at the syrmep beamline of elettra-closing the gap between preclinical research and patient applications. Phys Open (2021) 6:100050. doi:10.1016/j.physo.2020.100050
27. Brun F, Pacilè S, Accardo A, Kourousias G, Dreossi D, Mancini L, et al. Enhanced and flexible software tools for x-ray computed tomography at the Italian synchrotron radiation facility elettra. Fundamenta Informaticae (2015) 141:233–43. doi:10.3233/fi-2015-1273
28. Schindelin J, Arganda-Carreras I, Frise E, Kaynig V, Longair M, Pietzsch T, et al. Fiji: an open-source platform for biological-image analysis. Nat Methods (2012) 9:676–82. doi:10.1038/nmeth.2019
29. Charlier F, Weber M, Izak D, Harkin E, Magnus M, Lalli J, et al. Statannotations (2022). doi:10.5281/zenodo.7213391
30. Waskom ML. seaborn: statistical data visualization. J Open Source Softw (2021) 6:3021. doi:10.21105/joss.03021
31. Takeda T, Kunii T, Sirai R, Ohizumi T, Maruyama H, Hyodo K, et al. Ethanol fixed brain imaging by phase-contrast x-ray technique. J Phys Conf Ser (2013) 425:022004. doi:10.1088/1742-6596/425/2/022004
Keywords: optical clearing, BABB, FFPE, synchrotron, x-ray, phase-contrast, micro-CT, virtual histology
Citation: Sagar MMR, Svetlove A, D’Amico L, Pinkert-Leetsch D, Missbach-Guentner J, Longo E, Tromba G, Bohnenberger H, Alves F and Dullin C (2024) Optical clearing: an alternative sample preparation method for propagation based phase contrast
Received: 16 May 2024; Accepted: 13 August 2024;
Published: 26 August 2024.
Edited by:
Silvia Capuani, National Research Council (CNR), ItalyReviewed by:
Naoto Yagi, Japan Synchrotron Radiation Research Institute, JapanJuergen Goldschmidt, Leibniz Institute for Neurobiology (LG), Germany
Copyright © 2024 Sagar, Svetlove, D’Amico, Pinkert-Leetsch, Missbach-Guentner, Longo, Tromba, Bohnenberger, Alves and Dullin. This is an open-access article distributed under the terms of the Creative Commons Attribution License (CC BY). The use, distribution or reproduction in other forums is permitted, provided the original author(s) and the copyright owner(s) are credited and that the original publication in this journal is cited, in accordance with accepted academic practice. No use, distribution or reproduction is permitted which does not comply with these terms.
*Correspondence: Md Motiur Rahman Sagar, bW90aXVyLnNhZ2FyQG1waW5hdC5tcGcuZGU=