 Ning Zhao
 Yongyi Fang
- State Grid Shijiazhuang Electric Power Supply Company, Shijiazhuang, Hebei, China
Identifying cable insulation defects is crucial for preventing system failures and ensuring the reliability of electrical infrastructure. This paper introduces a novel method leveraging the Markov transition field (MTF) and Transformer network to improve the precision of cable insulation defect identification and enhance the algorithm's noise resistance. Firstly, the algorithm performs modal transformation on the time series data acquired by the ultrasonic probe through MTF, generating corresponding images. Following this, the image data are input into a pre-trained Transformer network to achieve automated feature extraction. Subsequently, a multi-head attention mechanism is introduced, which assigns weights to the features extracted by the Transformer network, thereby emphasizing the most critical information for the identification task. Finally, more accurate defect identification is achieved based on the weighted features. The results demonstrate that this method achieves higher accuracy and stronger noise resistance compared to traditional image processing and recognition methods, making it a robust solution for cable insulation defect identification.
1 Introduction
In the safe operation of power systems, the detection of cable insulation defects plays a crucial role, and its importance cannot be overlooked [1]. Currently, the analysis process of cable insulation defects mostly employs numerical computation methods [2]. These methods primarily involve numerically solving the physical processes and mathematical models of cable insulation defects to predict and analyze the characteristics of insulation defects [3]. In the identification of cable insulation defects, commonly used numerical computation methods include the finite element method, the finite difference method, and the boundary element method [4, 5]. In modern industry and daily life, as the primary medium for transmitting electrical energy, the stability and reliability of cables have a crucial impact on ensuring the continuity and safety of the power supply [6, 7]. Therefore, conducting accurate and effective detection of cable insulation defects is a key component of the maintenance and operation of power systems [8, 9]. In the field of cable insulation defect detection for power systems, due to the combined effects of external environmental factors, material aging, and construction quality issues, the insulation layer of the cable may exhibit various types of defects such as cracks, holes, and water trees [10, 11]. If these defects are not detected and addressed in a timely manner, they may cause cable failures and could even lead to serious power system accidents [12, 13]. Therefore, conducting systematic research to enhance the accuracy and efficiency of detection technology is of great significance for preventing and reducing the occurrence of power accidents.
With the advancement of technology, the detection technology for cable insulation defects is also continuously improving. Reference [14] proposes a new method for detecting and locating defects in cross-linked grounded configuration cable sheaths. Through simulation and actual case validation, this method can effectively identify and locate various types of defects, and it enhances the stability of detection under low load currents by using an improved capacitive current subtraction method. Reference [15] addresses the issue of cable defect localization by proposing a method for selecting the upper limit scanning frequency based on short-time Fourier transform. Through simulation and experimental validation, this method can effectively reduce the impact of high-frequency signal attenuation on defect localization and improve the accuracy of localization. Research results indicate that compared with traditional frequency domain reflectometry, the proposed method has higher performance in both single-point and multi-point defect localization. Reference [16] addresses the issue of internal defect detection in cable terminals by proposing a non-destructive testing technology based on the microwave reflection method. By establishing a theoretical model and simulating with CST software, the impact of defect type, size, silicone rubber thickness, and detection distance on the reflection coefficient was analyzed. Experiments confirmed the feasibility of the theoretical model and simulation results, successfully detecting a tiny defect of two square millimeters, proving the efficiency and practicality of the method. Reference [17] addresses the analysis and diagnosis of shielded cable faults by establishing a two-dimensional model of a cable with defects using the finite element method and calculating its characteristic impedance. Reference [18] conducts experimental research on single-ended partial discharge (PD) measurements using a high-frequency current transformer to address the issue of simultaneous activity of multiple PD defects in medium-voltage underground power cables. By analyzing the reflected pulses with time-domain reflectometry, two PD sources at different locations were successfully identified and located. The research results indicate that the proposed method can effectively distinguish signals from different PD sources and accurately determine the location of the PD sources, which is of great significance for the detection and maintenance of PD defects in actual cable networks. The deficiency of current cable insulation defect detection techniques lies in the fact that, although various methods can effectively identify and locate defects, they often fail to accurately identify the type of insulation defects. This leads to a lack of targeted detection and analysis methods for different types of defects in practical applications, thereby affecting the accuracy of the detection results and the specificity of maintenance work. Therefore, enhancing the accuracy of defect identification and developing technologies capable of recognizing and differentiating various types of defects are directions that current research needs to focus on and improve.
Research on intelligent classification methods for cable insulation defects is crucial for enhancing the reliability and safety of power systems [19, 20], as it ensures precise identification and effective management of various defects, thereby preventing potential power failures and accidents. Reference [21] addresses the issue of insulation defect identification in direct current cross-linked polyethylene (DC XLPE) cables by conducting research on a new method based on Contourlet transform and Tsallis entropy feature extraction, and employs a corrected output code classifier optimized by an adaptive cuckoo search algorithm for defect identification. The results indicate that this method has a high classification accuracy rate in identifying typical insulation defects of cables and provides a new approach for the identification of insulation defect types in DC XLPE cables. Reference [22] proposes a diagnostic method based on the time-frequency domain reflectometry for fault classification in multi-core cables. By converting the reflected signals into images and utilizing advanced image processing algorithms, combined with artificial neural networks for fault classification. Experimental results show that this method can improve the accuracy and reliability of fault diagnosis in multi-core cable systems, especially suitable for fault classification of terminal block faults in cables of varying lengths. Reference [23] addresses the issue of internal defects in the insulation of power cables by proposing a machine learning diagnostic scheme based on PD pattern analysis. Through waveform analysis and feature extraction, the method employs support vector machine (SVM) and ensemble tree algorithms to identify and classify internal sources of PD of various shapes and sizes. Experimental results demonstrate that the proposed method can effectively identify and classify defects in the insulation of cables, with an accuracy rate ranging from 96% to 92%. Reference [24] introduces a novel method for fault classification in power distribution cables based on the detection of the DC component using magneto sensitivity. The method reconstructs the current using a stochastic optimization algorithm, extracts the DC component with mathematical morphology, and identifies the type of fault accordingly. Experiments have proven that this method can effectively classify faults, is robust, and does not require pre-calibration. However, existing intelligent classification methods rely on specific technologies, are sensitive to noise, and require extensive preprocessing for practical application.
The principal contributions encapsulated within this paper are delineated as follows:
(1) The paper presents a groundbreaking integration of the Markov transition field (MTF) with Transformer network architecture, facilitating the conversion of time series data, as captured by ultrasonic probing, into image modalities through a process of modality transformation. This innovative step significantly enriches the data’s representational capacity, thereby yielding a more comprehensive informational substrate that is instrumental for downstream tasks of feature extraction and defect recognition.
(2) The paper employs a pre-trained Transformer network for the automated extraction of features, complemented by the introduction of a multi-head attention mechanism that assigns weights to these features. This strategic enhancement ensures that the information critical for the recognition task is effectively brought into prominence. Consequently, the approach not only bolsters the precision of defect recognition but also fortifies the algorithm’s resilience to noise. It distinguishes itself particularly in the context of identifying insulation defects within cables, showcasing exceptional performance in this niche yet critical domain.
2 Fundamental theory
2.1 Markov transition field
MTF is a method for transforming temporal data into spatial image data. This method extends the Markov state transition matrix, fully preserves the discretized temporal dynamic information by sequentially expressing the state transition matrix, and ultimately generates a two-dimensional image through fuzzy kernel aggregation. Given a time series signal
Each element wij in the MTF represents the transition probability between points separated by a time interval of |i-j|, wij|i-j|=1 indicates that there is only one interval in the transition process along the time axis, wij for a time interval of 0 is a special case, representing the probability of each quantile transitioning to itself. Considering that when n is large, using the original MTF to directly generate an image would result in an excessively large image, which occupies more computer storage space and is not conducive to rapid calculation and analysis by on-site intelligent devices or power grid back-end systems. To address this, a fuzzy kernel{1/m2}m×m is used to average each non-overlapping pixel to obtain a two-dimensional image of the aggregated m×m dimensional MTF.
2.2 Transformer network
In recent years, the Chat Generative Pre-trained Transformer has garnered widespread attention due to its powerful creativity and logical reasoning capabilities. The model employs a Transformer as its underlying architecture, which, through the introduction of a self-attention mechanism, enables the network to process positional information in the input sequence in parallel, better understands the interdependencies between input sequences, thereby significantly improving training and inference speeds. Therefore, in Generative Adversarial Networks, using the Transformer as the generator’s architecture can endow the model with stronger expressive and generalization capabilities. Compared to Convolutional Neural Networks, the Transformer can establish global dependencies within images, thereby capturing more global image information. To adapt to image tasks, the model in this paper has been adjusted from the traditional structure by removing the decoder and retaining only the encoder. The structure of the Transformer network is shown in Figure 1. The Transformer network used in this paper is pre-trained through self-supervised learning on an ultrasonic detection dataset, utilizing modal transformation technology to convert time series data into images, and combining a multi-head attention mechanism to extract and weight features, thereby enhancing the accuracy and robustness of cable insulation defect identification.
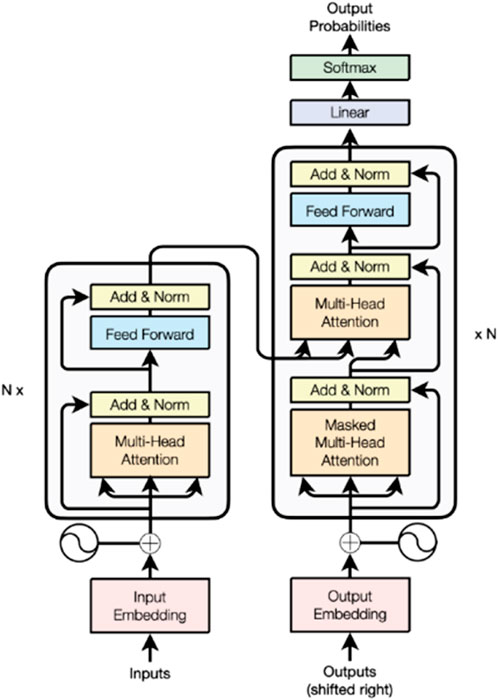
Figure 1. Schematic diagram of the transformer network architecture.
The encoder mainly consists of a multi-head attention mechanism and a multi-layer perceptron. A single attention mechanism involves each input containing three different vectors, namely, the Query vector (Q), Key vector (K), and Value vector (V). Their results are obtained by performing matrix multiplications of the input feature map X with three weight matrices Wq, Wk, and Wv, respectively, as shown in Eq 3.
Attention scores for each input vector are then calculated using the softmax function, as shown in Eq. 4:
In the equation: dk represents the dimensionality of either the Query (Q) or the Key (K) vectors, with the understanding that the dimensionality of Q and K is equal.
The multi-head attention mechanism, denoted as MultiHead, is shown in Eq. 5:
Concat denotes the concatenation operation, headh represents the output of the h attention head, Wo is the weight matrix.
2.3 Multi-head attention mechanism
The multi-head attention mechanism, by simulating human visual attention, allows the model to focus on the most critical parts of the input data. This mechanism not only enhances the model’s ability to express features but also improves the accuracy of defect identification by parallel processing of high-dimensional features. Specifically, the multi-head attention mechanism enables the model to receive information from different subspaces, thereby more effectively capturing and distinguishing various defect characteristics during the feature extraction and classification process. By assigning different weights to the features extracted by the Transformer network, this mechanism emphasizes information that is vital for the identification task, significantly enhancing the accuracy of cable insulation defect identification and the algorithm’s robustness to noise. At any given moment, out of a large amount of input data, only a small fraction of features are typically important. The attention mechanism allows the model to focus more on these critical parts, thereby improving the overall performance of the model.
The field of deep learning typically employs soft attention mechanisms for computation, which fuse the various input vectors by weighting and summing them according to an attention distribution. Assuming a set of extracted features, denoted as H = [h1, h2 , hk], is given as input, along with a task-related query vector β, the relevance between β and each input hi is calculated using the attention scoring function s (hi,β), which is then followed by the normalization of the obtained scores using the Softmax function, resulting in an attention distribution A = [a1, a2 , ak ] that corresponds to the input features, and ultimately, the input information is weighted and summed according to the attention distribution to produce the output result Y. As shown in Eqs 6-7.
The attention scoring function s (hi, β) typically includes four forms: additive model, dot product model, scaled dot product model, and bilinear model. As shown in Eqs 8-11.
where W0, U, and v are all learnable parameter matrices or vectors, D is the dimension of the input vector; ftanh () is the hyperbolic tangent activation function.
Multi-head attention is the cornerstone of the Transformer model [25], Compared to the standard attention mechanism, multi-head attention allows the output of the attention layer to contain representational information from different subspaces, thereby enhancing the model’s expressive power. It utilizes different query vectors βi to focus on different parts of the input information, to achieve the goal of analyzing the current input information from different perspectives, as shown in Figure 2. It mainly consists of three steps: First, the input features extracted are represented as H = [ℎ1,ℎ2,
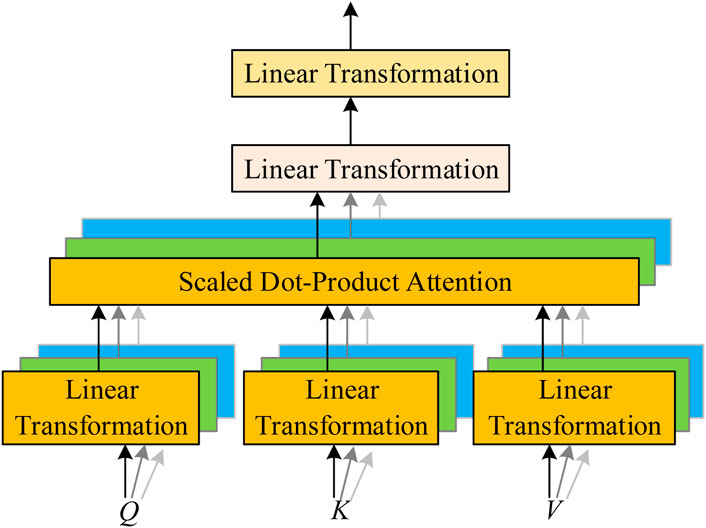
Figure 2. Multi-head attention structure.
Where WQ, WK, WV are the linear transformation parameters for the query, key, and value spaces, respectively; Dk is the matrix composed of the dimensionality of each key; k is the element vector in the key space; v is the element vector in the value space; T is the transpose transformation; λ is the number of query vectors; fConcat ( ) is the feature concatenation function; μ is the dimensionality after the linear transformation.
2.4 Recognition algorithm based on the integration of MTF and transformer network
This paper proposes an integrated recognition algorithm of MTF and Transformer network, as shown in Figure 3. A Transformer network with greater expressive power is used as the generator, and a Spectral Normalization Convolutional Neural Network (SN-CNN) that meets the Lipschitz continuity constraint is designed as the discriminator. The multi-head attention mechanism of the Transformer generator endows the model with superior expressive power; the concisely structured SN-CNN discriminator reduces the computational complexity of the image generation model and performs well. The method is highly noise-resistant, utilizing a pre-trained Transformer network and multi-head attention mechanism to focus on critical identification information while suppressing noise. It incorporates a denoising process through in-depth median filtering, ensuring accurate defect detection even with noisy ultrasonic signal data. The model’s predictions transform complex data into intuitive images, automatically extract key features, and use a multi-head attention mechanism to highlight important information, explaining the identification results of cable insulation defects in a user-friendly manner, thereby enhancing the end-users’ understanding of the model’s decision-making logic.
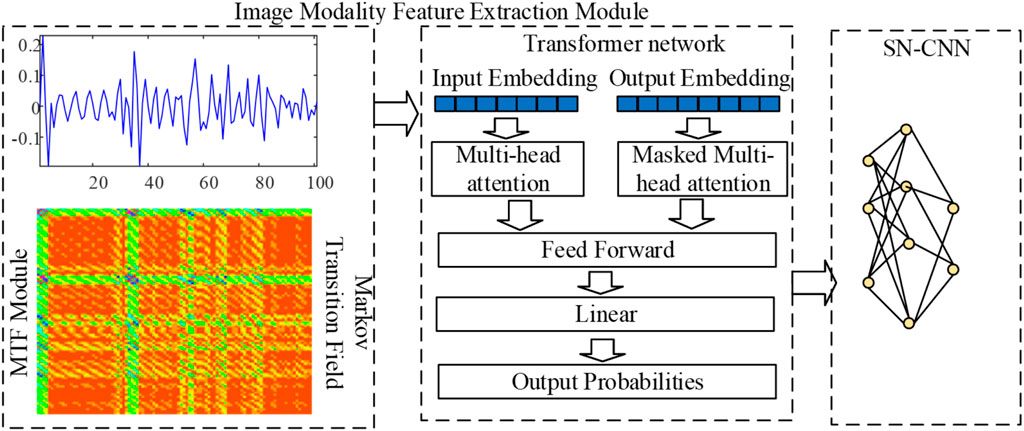
Figure 3. MTF and transformer network fusion recognition algorithm.
3 Ultrasound-based cable insulation defect detection
3.1 Test platform construction
The experimental platform for cable insulation defect detection based on ultrasonic technology is shown in Figure 4. Its core components include a cable terminal sample, an ultrasonic probe, a power supply, an ultrasonic visualization platform, and a USB communication cable. During the cable insulation defect detection process, the ultrasonic probe is coated with a coupling agent to ensure direct contact with the cable insulation surface. The role of the coupling agent is to reduce the acoustic impedance loss as the ultrasonic waves travel from the probe into the cable insulation material, thereby enhancing the signal transmission efficiency. Once the ultrasonic waves successfully penetrate the interior of the cable insulation sample, they interact with the internal structure and produce reflections upon encountering defects or material interfaces. These reflected signals are then captured by the ultrasonic probe and transmitted to a digital controller. The digital controller is responsible for processing and analyzing the echo signals, including operations such as signal amplification, filtering, and conversion. The processed signals are then presented in waveform on the display interface of the ultrasonic visualization platform, allowing for a direct observation of the internal structural characteristics and potential defect locations within the cable insulation. Additionally, the USB communication cable of the experimental platform is responsible for the fast and stable transmission of data between the ultrasonic probe and the digital controller, ensuring the efficiency and accuracy of the entire detection process.
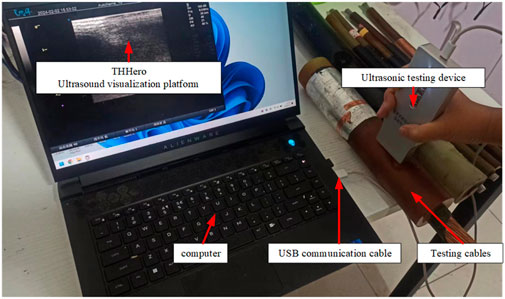
Figure 4. Cable insulation defect detection test platform.
3.2 Insulation defect detection results
Figure 5A shows the echo signal within the cable insulation under normal conditions. Figure 5B shows the echo signal caused by crack defects within the cable insulation. Figure 5C shows the echo signal caused by water droplet defects within the cable insulation. Figure 5D shows the echo signal caused by bubble defects within the cable insulation. Comparing the echo signals under the four types of insulation defects, it can be observed that there are no significant differences in the characteristics of the echo signals across different conditions. Among them, the amplitude of the echo signal within the insulation under normal conditions is significantly greater than that when there are defects within the insulation. Furthermore, when there are different defects within the cable insulation, the echo signals under each defect are difficult to directly observe through temporal characteristics. Therefore, it is necessary to rely on the intelligent recognition algorithm proposed above for identification.
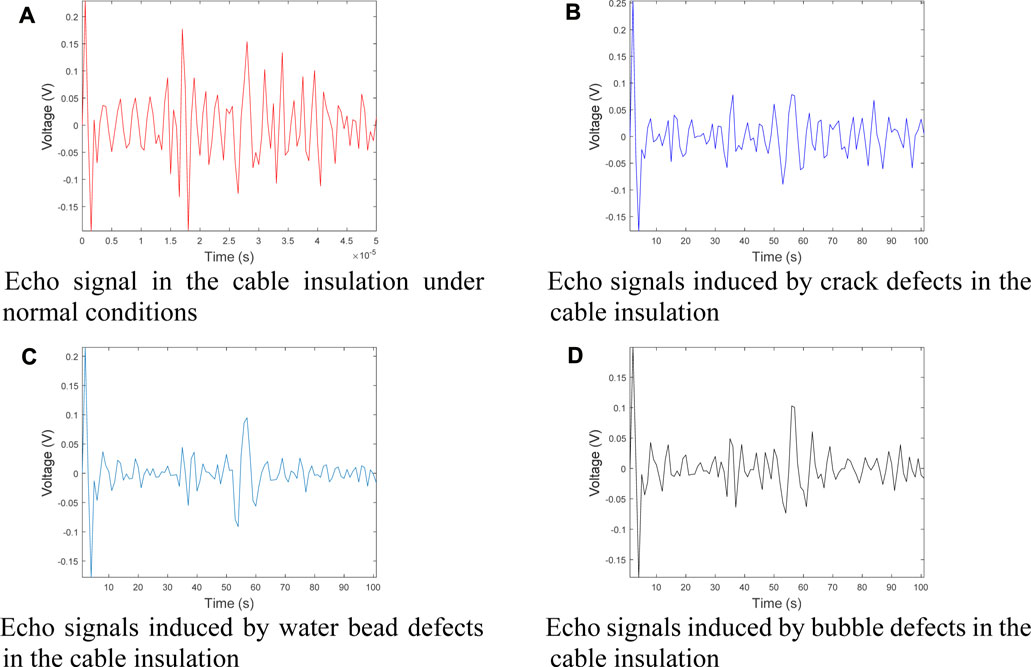
Figure 5. The echo signal in the cable insulation layer under different defects. (A) Echo signal in the cable insulation under normal conditions. (B) Echo signals induced by crack defects in the cable insulation. (C) Echo signals induced by water bead defects in the cable insulation. (D) Echo signals induced by bubble defects in the cable insulation.
4 Cable insulation defect recognition based on intelligent recognition algorithms
4.1 Model parameters and training results
Based on the aforementioned ultrasonic detection data, this section is dedicated to the verification of an integrated recognition algorithm of MTF and Transformer network. The proposed recognition algorithm is constructed using the PyTorch deep learning framework and the Python programming language. PyTorch is an open-source machine learning library, widely used in applications in fields such as computer vision and natural language processing [26]. Python, as a high-level programming language, provides convenience for rapid algorithm development and prototype design with its concise syntax and rich library support [27]. The specific training environment configuration is shown in Table 1. In the algorithm training phase, the cross-entropy loss function was selected, which is a widely used loss function in classification problems. The cross-entropy loss function measures the difference between the model’s predicted probability distribution and the true label distribution, with the mathematical expression as shown in Eq 17. The method proposed in this paper can process a data point within 100 milliseconds and demonstrates a high degree of stability and reliability, which is sufficient to meet the needs of online real-time monitoring. Moreover, the method also has good scalability and can adapt to monitoring tasks of different scales, ensuring efficient detection of cable insulation defects in a variety of practical application scenarios.
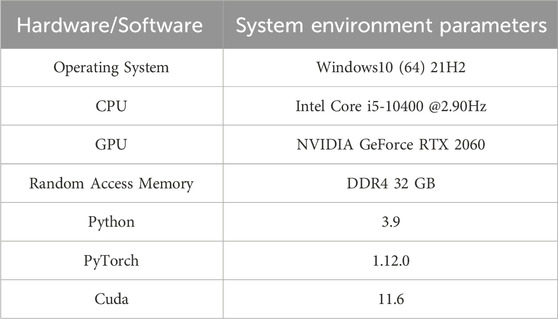
Table 1. Parameters of Hardware and software.
Where N is the number of samples, yi is the true label of the ith sample, typically represented by one-hot encoding, pi is the probability that the model predicts sample i belongs to a certain class. The goal of the loss function is to minimize the difference between the predicted probability distribution and the true label distribution.
Utilizing the MTF module to process the four types of echo signals mentioned above and convert them into an image modality. The MTF module is capable of assessing the imaging system’s response to details of different spatial frequencies, through which the signals obtained from ultrasonic detection can be transformed into image data, facilitating subsequent image analysis and machine learning classification tasks. The transformed image modalities are displayed in Figures 6A–D, these image modalities clearly reflect the characteristics of different echo signals, providing richer and more intuitive information for the subsequent recognition algorithm. During the training process of the recognition algorithm, the training set and the test set were strictly divided, to ensure the model’s generalization ability and to evaluate its performance. Figure 7 shows the variation of recognition accuracy and loss values during the training process for both the training and test sets. Figure 7 illustrates the variation in recognition accuracy and loss values during the training process of the identification algorithm. It can be observed that as training progresses, the recognition accuracy gradually increases while the loss values decrease. Initially, the accuracy level is relatively high, indicating that the algorithm is capable of quickly learning data characteristics and performing effective recognition. With more training iterations, the accuracy continues to improve and tends to stabilize, demonstrating the algorithm’s good convergence performance. Concurrently, the loss values continue to decrease, eventually maintaining at a low level, reflecting the reduction in the discrepancy between the model’s predictions and the actual labels, thereby enhancing the model’s generalization ability. Specifically, at the beginning of the training, the recognition accuracy might start at around 70% or 80%. As training proceeds, the accuracy steadily rises, potentially reaching over 90% after several hundred iterations, and may approach or achieve 100% with further training. Meanwhile, the loss value, which might initially be high such as 1.0 or higher, gradually descends to 0.2, 0.1, or even lower, indicating a reduction in the model’s error on the training data. Furthermore, the shape of the curves can reflect certain characteristics of the algorithm. For instance, if the accuracy curve shows a smooth upward trend, it may indicate that the training process of the algorithm is stable without signs of overfitting. If the loss curve fluctuates after decreasing to a certain level, it could be due to the learning rate settings or uneven data distribution.
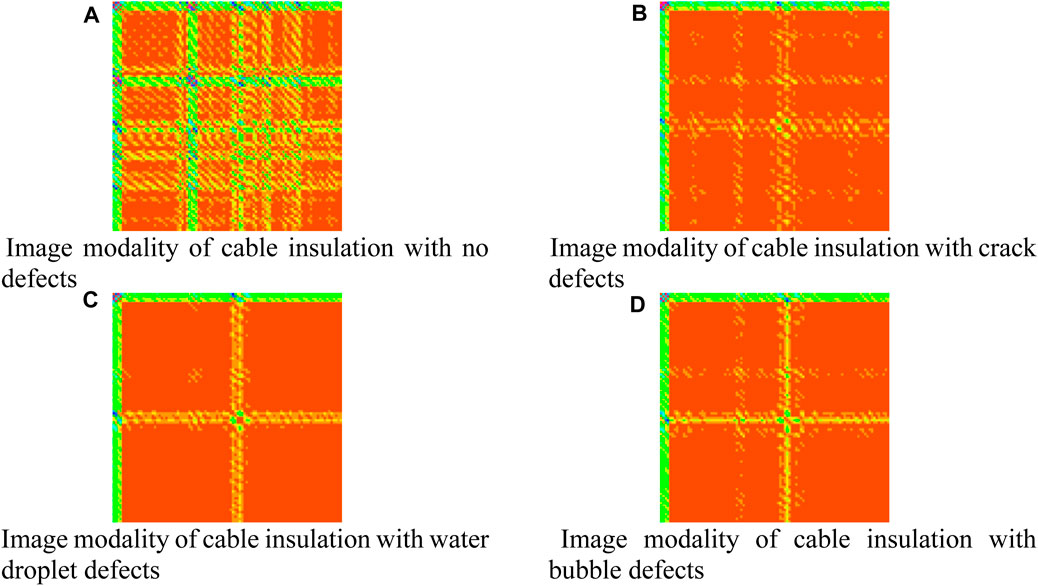
Figure 6. Image modality of cable insulation with different defects. (A) Image modality of cable insulation with no defects. (B) Image modality of cable insulation with crack defects. (C) Image modality of cable insulation with water droplet defects. (D) Image modality of cable insulation with bubble defects.
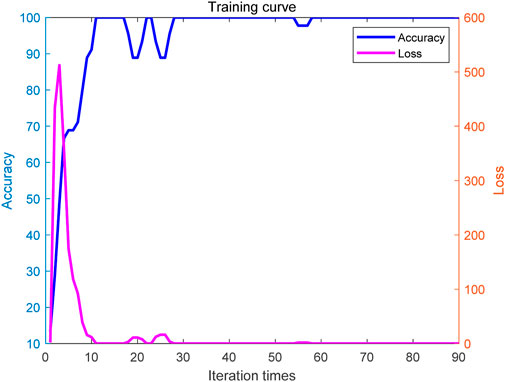
Figure 7. Recognition algorithm training process.
The confusion matrix is a statistical tool used to evaluate the performance of recognition algorithms [28]. It compares the actual categories with the predicted by the algorithm, allowing for the demonstration of the of the algorithm and potential classification errors. Therefore, in order to comprehensively evaluate the performance of the proposed recognition, the confusion matrix is used as a tool to visually show the classification performance of the algorithm on the training and test set. Figure 8 shows the confusion matrix of the training set, and Figure 9 shows the between the predicted values and actual values on the training set. Figure 10 shows the confusion matrix of the set, and Figure 16 shows the comparison between the predicted values and actual values on the test set. From the classification results presented in Figures 8–11, it can be observed that the proposed recognition algorithm excellent performance on both the set and test set, achieving 100% classification. This high performance, coupled with the advanced machine learning techniques employed, suggests that the method is well-suited for application across different types of cables, including both high voltage and low voltage cables. The use of a pre-trained Transformer network and a multi-head attention mechanism further supports the method’s potential for robust and generalized detection capabilities, making it applicable to a wide range of cable insulation defect scenarios.
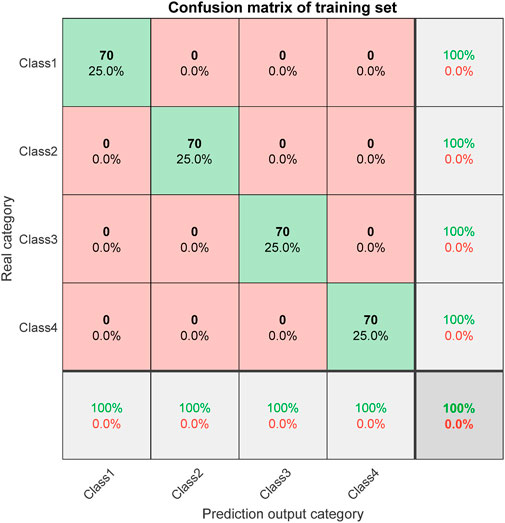
Figure 8. Confusion matrix of the training set.
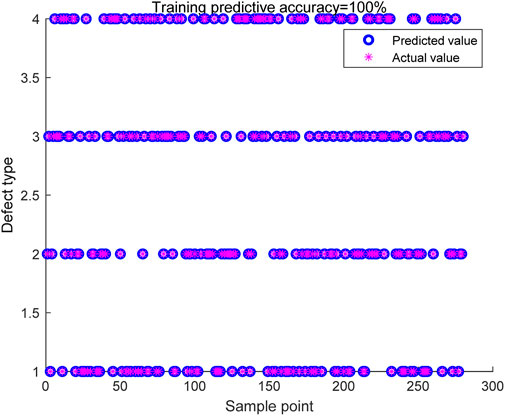
Figure 9. Comparison between predicted values and actual values on the training set.
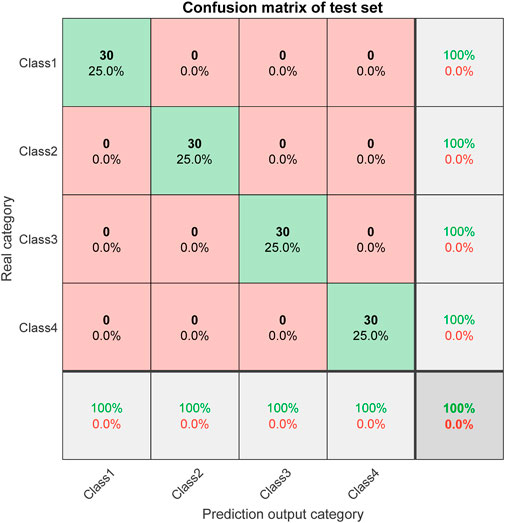
Figure 10. Confusion matrix of the test set.
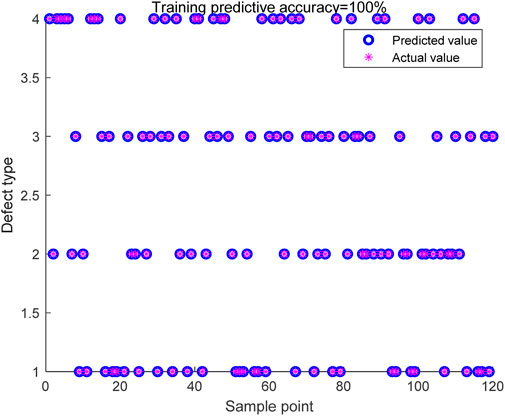
Figure 11. Comparison between predicted values and actual values on the test.
4.2 Algorithm accuracy comparison
To comprehensively evaluate the performance of the proposed MTF and Transformer fusion recognition algorithm in the field of cable insulation defect recognition, a series of experimental comparisons were conducted. These experiments included comparing the recognition accuracy of the proposed algorithm with several widely recognized traditional recognition algorithms. The specific comparison results have been detailed in Table 2, which displays the performance differences of different algorithms on the same test set. Table 2 presents a comparative analysis of recognition accuracy among various models, revealing the superiority of the proposed method. The proposed integration of the MTF with the Transformer network, as demonstrated in our experiments, achieves a remarkable 100% accuracy rate across all categories of cable insulation defects. This performance significantly exceeds that of traditional algorithms such as the SVM, Random Forest (RF), CNN, and the standalone Transformer model. The distinct advantage of our method lies in its ability to capture intricate patterns and relationships within the data through the synergistic application of MTF and the Transformer network. The modality transformation provided by MTF enriches the data representation, while the Transformer network, with its multi-head attention mechanism, adeptly captures the nuanced features essential for accurate defect classification. However, it is also crucial to consider potential limitations. The complexity of the model may lead to increased computational requirements compared to simpler algorithms. Additionally, while the model has shown excellent performance on the tested dataset, its generalizability to other datasets or environments with different noise characteristics and defect types should be further validated.
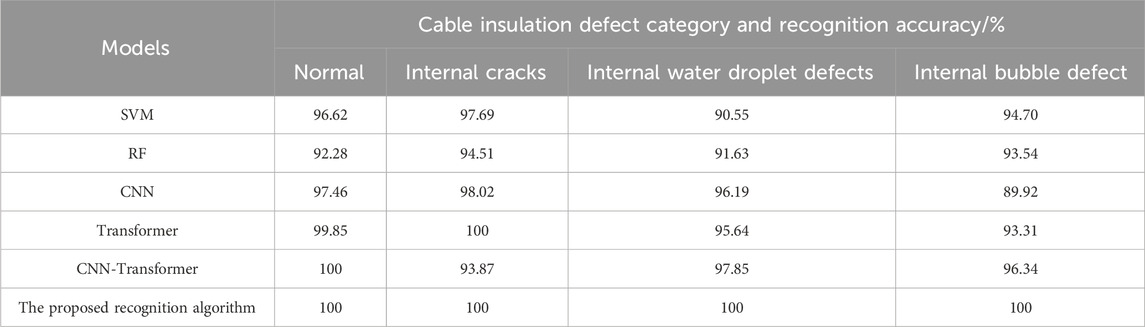
Table 2. Comparison of recognition accuracy among different models.
5 Conclusion
This study proposes an identification algorithm based on the fusion of MTF and Transformer network for the intelligent classification of cable insulation defects. By utilizing the MTF module, the time series data acquired by the ultrasonic probe is transformed into images, enhancing the representation of the data and providing richer information for subsequent feature extraction and classification. By integrating a pre-trained CNN and a multi-head attention mechanism, the algorithm can effectively extract key features and perform precise classification, significantly improving the accuracy and robustness of cable insulation defect identification.
Through comparative experiments with various traditional recognition algorithms, the results demonstrate that the proposed recognition algorithm has achieved a 100% accuracy rate in the identification task of cable insulation defects, significantly outperforming traditional methods such as SVM, RF, CNN, and Transformer. This significant performance improvement confirms the effectiveness and superiority of the fusion recognition algorithm combining MTF with the Transformer network in the identification of cable insulation defects.
Additionally, the recognition algorithm proposed in this study has demonstrated outstanding performance on both the training and testing sets, achieving 100% classification accuracy, indicating that the algorithm has strong learning and generalization capabilities. This outcome provides a novel technical approach for the detection of cable insulation defects, which is of significant importance for enhancing the reliability and safety of power systems.
Future research will focus on enhancing the environmental adaptability of the cable insulation defect identification method. This will be achieved by assessing the impact of environmental factors, optimizing algorithm parameters, integrating environmental compensation mechanisms, and verifying the method in various practical scenarios to ensure stable operation under different conditions. This will provide more reliable detection technology for power systems.
Data availability statement
The original contributions presented in the study are included in the article/Supplementary Material, further inquiries can be directed to the corresponding author.
Author contributions
NZ: Writing–original draft, Writing–review and editing, Methodology. YF: Supervision, Writing–review and editing. SW: Methodology, Project administration, Writing–review and editing. QL: Conceptualization, Formal Analysis, Writing–original draft. XW: Project administration, Resources, Writing–original draft. CF: Formal Analysis, Project administration, Writing–review and editing.
Funding
The author(s) declare that financial support was received for the research, authorship, and/or publication of this article.
Conflict of interest
Authors NZ, YF, SW, QL, XW, and CF were employed by State Grid Shijiazhuang Electric Power Supply Company.
The authors declare that this study received funding from State Grid Hebei Electric Power Co., Ltd. (No. KJ2022-016). The funder was involved in the study design, collection, analysis, interpretation of data, the writing of this article, and the decision to submit it for publication.
Publisher’s note
All claims expressed in this article are solely those of the authors and do not necessarily represent those of their affiliated organizations, or those of the publisher, the editors and the reviewers. Any product that may be evaluated in this article, or claim that may be made by its manufacturer, is not guaranteed or endorsed by the publisher.
References
1. Hu Y, Chen L, Liu Y, Xu Y. Principle and verification of an improved algorithm for cable fault location based on complex reflection coefficient spectrum. IEEE Trans Dielect Elect Insul (2023) 30(1):308–16. doi:10.1109/tdei.2022.3224700
2. Liu ZW, Bian PL, Qu YL, Huang WC, Chen LL, Chen JB, et al. A galerkin approach for analysing coupling effects in the piezoelectric semiconducting beams. Eur J Mech A Sol (2024) 103:105145. doi:10.1016/j.euromechsol.2023.105145
3. Chen LL, Lian HJ, Xu YM, Li SZ, Liu ZW, Atroshchenko E, et al. Generalized isogeometric boundary element method for uncertainty analysis of time-harmonic wave propagation in infinite domains. Appl Math Model (2023) 114:360–78. doi:10.1016/j.apm.2022.09.030
4. Li HZ, Chen LL, Zhi G, Meng L, Lian HJ, Liu ZW, et al. A direct fe2 method for concurrent multilevel modeling of piezoelectric materials and structures. Computer Methods Appl Mech Eng (2024) 420:116696. doi:10.1016/j.cma.2023.116696
5. Chen LL, Lian HJ, Dong HW, Yu P, Jiang SJ, Bordas SPA. Broadband topology optimization of three-dimensional structural acoustic interaction with reduced order isogeometric fem/bem. J Comput Phys (2024) 509:113051. doi:10.1016/j.jcp.2024.113051
6. Li Z, Zheng Z, Wu Y, Du B. Space charge and electric field dependent on polarity reversal of HVDC cable insulation. IEEE Trans Dielect Elect Insul (2024) 31(1):58–65. doi:10.1109/tdei.2023.3335189
7. Chen LL, Wang ZW, Lian HJ, Ma YJ, Meng ZX, Li P, et al. Reduced order isogeometric boundary element methods for CAD-integrated shape optimization in electromagnetic scattering. Comput Methods Appl Mech Eng (2024) 419:116654. doi:10.1016/j.cma.2023.116654
8. Hua X, Wang L, Yang S, Zhang S. Temperature mapping model of cables considering the coupling of electromagnetic and thermal field. Digital Twin (2023) 3(2):2. doi:10.12688/digitaltwin.17718.1
9. Shen XW, Du CB, Jiang SY, Zhang P, Chen LL. Multivariate uncertainty analysis of fracture problems through model order reduction accelerated SBFEM. Appl Math Model (2024) 125:218–40. doi:10.1016/j.apm.2023.08.040
10. Li X, Guo Y, Li Y. Particle swarm optimization-based SVM for classification of cable surface defects of the cable-stayed bridges. IEEE Access (2020) 8:44485–92. doi:10.1109/access.2019.2961755
11. Hua X, Wang L, Yang S. Lifetime prediction of aviation cables based on an improved electromagnetic–thermal coupling model. IEEE Trans Dielectr Electr Insul (2023) 30(6):2788–97. doi:10.1109/tdei.2023.3295347
12. Chen LL, Li HZ, Guo YY, Chen P, Atroshchenko E, Lian HJ. Uncertainty quantification of mechanical property of piezoelectric materials based on isogeometric stochastic FEM with generalized Nth-order perturbation. Eng Comput (2023) 40(1):257–77. doi:10.1007/s00366-023-01788-w
13. Hua X, Wang L, Yang S. Multiscale analysis of the aging process of cable insulation. IEEE Trans Dielectr Electr Insul (2023) 30(1):238–46. doi:10.1109/tdei.2022.3217425
14. Shokry MA, Khamlichi A, Garnacho F, Malo JM, Álvarez F. Detection and localization of defects in cable sheath of cross-bonding configuration by sheath currents. IEEE Trans Power Deliv (2019) 34(4):1401–11. doi:10.1109/tpwrd.2019.2903329
15. Huang J, Zhou K, Xu Y, Meng P, Tang Z, Liang Z. Upper sweeping frequency selection for cable defect location based on STFT. IEEE Trans Instrum Meas (2023) 72:1–9. doi:10.1109/tim.2023.3271718
16. Cheng L, Xu W, Wang X, Yang L, Liao R, Ni Y. Defect detection of cable termination based on the microwave reflection method. IEEE Trans Dielectr Electr Insul (2024) 31(1):111–20. doi:10.1109/tdei.2023.3309930
17. Hua X, Wang L, Zhang Y. Analysis and diagnosis of shielded cable faults based on finite-element method and time-reversal time-frequency domain reflectometry. IEEE Trans Ind Electron (2022) 69(4):4205–14. doi:10.1109/tie.2021.3071685
18. Shafiq M, Kiitam I, Taklaja P, Kütt L, Kauhaniemi K, Palu I. Identification and location of PD defects in medium voltage underground power cables using high frequency current transformer. IEEE Access (2019) 7:103608–18. doi:10.1109/access.2019.2930704
19. Chen LL, Cheng RH, Li SZ, Lian HJ, Zheng CJ, Bordas SPA. A sample-efficient deep learning method for multivariate uncertainty qualification of acoustic–vibration interaction problems. Comput Methods Appl Mech Eng (2022) 393:114784. doi:10.1016/j.cma.2022.114784
20. Shen XW, Du CB, Jiang SY, Sun LG, Chen LL. Enhancing deep neural networks for multivariate uncertainty analysis of cracked structures by POD-RBF. Theor Appl Fract Mech (2023) 125:103925. doi:10.1016/j.tafmec.2023.103925
21. Xu Y, Sheng G, Yang F, Chen X, Qian Y, Jiang X. Classification of partial discharge images within DC XLPE cables in contourlet domain. IEEE Trans Dielectr Electr Insul (2018) 25(2):486–93. doi:10.1109/tdei.2017.006752
22. Bang SS, Shin YJ. Classification of faults in multicore cable via time–frequency domain reflectometry. IEEE Trans Ind Electron (2020) 67(5):4163–71. doi:10.1109/tie.2019.2920606
23. Abu-Rub OH, Khan Q, Refaat SS, Nounou H. Cable insulation fault identification using partial discharge patterns analysis. IEEE Can J Electr Comput Eng (2022) 45(1):31–41. doi:10.1109/icjece.2021.3119465
24. Zhu K, Pong PWT. Fault classification of power distribution cables by detecting decaying DC components with magnetic sensing. IEEE Trans Instrum Meas (2016) 69(5):2016–27. doi:10.1109/tim.2019.2922514
25. Wu D, Zheng Y, Cheng P. Triple channel feature fusion few-shot intent recognition with orthogonality constrained multi-head attention. IEEE Access (2024) 12:31685–96. doi:10.1109/access.2024.3369902
26. Tian X, Shi L, Luo Y, Zhang X. Garbage classification algorithm based on improved MobileNetV3. IEEE Access (2024) 12:44799–807. doi:10.1109/access.2024.3381533
27. Begum SSA, Syed H. GSAtt-CMNetV3: pepper leaf disease classification using osprey optimization. IEEE Access (2024) 12:32493–506. doi:10.1109/access.2024.3358833
Keywords: cable, insulation defect, Markov transition field, transformer networks, multi-head attention mechanism
Citation: Zhao N, Fang Y, Wang S, Li Q, Wang X and Feng C (2024) Research on the identification method of cable insulation defects based on Markov transition fields and transformer networks. Front. Phys. 12:1432783. doi: 10.3389/fphy.2024.1432783
Received: 14 May 2024; Accepted: 19 July 2024;
Published: 02 August 2024.
Edited by:
Pei Li, University of Southern Denmark, DenmarkCopyright © 2024 Zhao, Fang, Wang, Li, Wang and Feng. This is an open-access article distributed under the terms of the Creative Commons Attribution License (CC BY). The use, distribution or reproduction in other forums is permitted, provided the original author(s) and the copyright owner(s) are credited and that the original publication in this journal is cited, in accordance with accepted academic practice. No use, distribution or reproduction is permitted which does not comply with these terms.
*Correspondence: Ning Zhao, bW9qNjMwMkAxNjMuY29t