 Ning Zhao
 Zhiguo Duan
- State Grid Shijiazhuang Electric Power Supply Company, Shijiazhuang, Hebei, China
Cable insulation defect detection ensures electrical safety, prevents accidents, extends equipment life and guarantees stable system operation. For the traditional cable insulation defect detection and identification of difficult problems, this paper proposes the use of ultrasonic cable insulation defect detection and combined with the Convolutional Neural Network (CNN)-transformer model of cable insulation defect classification method. Firstly, the ultrasonic probe is used to obtain different cable insulation defect signals, and then the CNN-transformer model is used to classify different cable insulation defects. The CNN is used to initially extract the characteristics of the cable insulation defects from the input signals, and then the multi-attention mechanism in the time series Transformer is used to extract the transient local and periodic global characteristics of the cable insulation defect signals. The deeper transient local features and periodic global features of the cable insulation defect signal are extracted by the multi-attention mechanism in the time series Transformer; finally, the recognition results are outputted by the fully connected layer and softmax classifier. The results show that ultrasonic reflection and transmission phenomena occur at the defects, and different defects can be accurately reflected by the defect echo time and amplitude, and the accuracy of cable insulation defect recognition using the CNN-transformer model reaches 100%, with good generalization ability.
1 Introduction
Cable insulation defect detection is a crucial step in ensuring the normal operation and safe use of cables. A good insulation state can effectively prevent faults such as cable short circuits and leakage, ensuring the safety of equipment and personnel [1, 2]. Regular inspection and maintenance can improve the reliability and service life of cables, reducing power outages and maintenance costs [3, 4]. In addition, meeting legal and regulatory requirements is also a manifestation of corporate social responsibility. Therefore, cable insulation defect detection is not only a technical activity but also a responsibility and commitment to the enterprise and society. By accurately classifying defects, engineers can assess the condition of power cables, identify potential risks, and prevent catastrophic failures [5]. This classification process allows for targeted interventions, such as repair or replacement, based on the specific nature of the detected defects. In addition, effective defect classification facilitates online monitoring to ensure the continuous operation of the power system without affecting reliability. Moreover, understanding the root cause of insulation failures is crucial for implementing preventive measures and optimizing the performance of power cables in various applications in electrical engineering [6, 7].
In order to ensure the safe and stable operation of the cable body and its accessories, and to grasp whether there are defects in the interior of the high-voltage cable and the type and size of the defects, it is urgent to develop an effective method that can quickly and accurately detect internal defects in insulated cables [8]. Currently, commonly used detection methods include AC superposition method, capacitive coupling method, directional coupling method, electromagnetic coupling method, leakage current test method, and detection method using oscillating wave voltage [9].
The literature [10] for the cable detection technology problems, proposed a power cable insulation defect detection method based on oscillating waves. This method dynamically generates a cable insulation defect detection benchmark database through the application of oscillating waves and signal sources in the field, identifies the fault mode corresponding to the maximum function value, and detects the type, location, and severity of cable insulation defects. In order to accurately determine the insulation status of power cables and ensure the safe and stable operation of the system, literature [11] conducted a simulation study on the detection of insulation defects in power cables based on electrical capacitance tomography technology. Using Landweber image reconstruction algorithm combined with optimized capacitance sensors and sensitivity fields, four typical cable insulation defects, including air gap defects, water tree defects, wedge scratch defects, and composite defects, were reconstructed, achieving the detection of insulation defects in power cables. To address the problem of difficulty in detecting the edges of scratches and stains on the surface of the main insulation of 10 kV cables, a method for identifying defects on the main insulation surface of 10 kV cables based on the Canny algorithm was proposed in the literature [12]. The method uses the scale-invariant feature transform (SIFT) method to complete the stitching of images of the main insulation of the cable and then uses the Canny algorithm to calculate the gradient and amplitude of the edges of defects on the main insulation surface, suppress maximum information points, remove false edges, and obtain information about the edges of defects caused by scratches and stains. The literature [13] studies the detection of defects in the insulation of aviation cables through infrared technology. Through numerical simulation, the temperature distribution and time variation of the insulated surface of the tested cable under different thermal excitations are analyzed. Meanwhile, experimental testing shows that the temperature variation range in the curve can successfully reflect the size and location of insulation defects. A new method for detecting insulation defects is proposed in the literature [14], which uses terahertz equipment to detect defects in cables, obtains terahertz images containing defects, and uses morphological algorithms to denoise and enhance the blurred images to obtain high-quality defect images to determine the location and size of the defects.
However, the actual cable structure is complex, and the methods in the above literature have problems such as complex operation, long detection time, and low detection accuracy, which cannot be effectively applied to the detection of insulation cable defects. Ultrasonic defect detection methods have the outstanding advantages of convenient operation, low cost, fast detection speed, and accurate defect location, and have been widely used in the detection of defects in insulators, pipelines, plate-like components, etc., and have achieved good detection results. The literature [15] uses conventional ultrasonic nondestructive testing methods to detect internal porosity defects in composite insulators, which can detect small porosity defects and verify the feasibility of ultrasonic detection of internal defects in complex structural objects. However, this method cannot achieve good coupling between the ultrasonic probe and objects with large curvature. The literature [16] uses ultrasonic pulse echo method to detect internal defects of composite insulators immersed in water, which can detect small defects in the umbrella skirt. This method can achieve ultrasonic detection of objects with large curvature, but requires immersing the object to be detected in water, which affects the later use of the detected object. Due to the special internal environment of aircraft, cable damage is inevitable, usually starting from defects in the insulation layer, which may cause significant economic losses and even pose a serious threat to the lives and safety of people on board. The literature [17] proposes a four-class defect classification method based on the deep forest method, which requires a small sample size and is not affected by network structure and parameters. The method has high recognition accuracy and avoids the problems of traditional deep learning classification that rely on large samples and require parameter adjustment. Due to the wide application and special nature of materials, the feasibility of using ultrasonic detection technology to achieve defect detection in insulated cables needs urgent research.
The reflection signals of different types of cable insulation defects are extremely similar and difficult to distinguish directly, so the identification and classification of cable insulation defects are very important. Traditional cable insulation defect classification mostly includes two stages: cable insulation defect feature extraction and cable insulation defect classification [18]. In the feature extraction of cable insulation defects, traditional methods have developed relatively mature, such as short-time Fourier transform, wavelet transform, S transform, empirical mode decomposition, Hilbert-Huang transform, etc. After feature extraction, the cable insulation defect signal needs to be input into a classifier for recognition [19]. The principle of existing classifiers is mostly based on machine learning algorithms, such as artificial neural networks, support vector machines, random forests, extreme learning machines, etc. Traditional machine learning algorithms generally perform poorly in the identification of cable insulation defects, and the accuracy is greatly affected by the feature extraction algorithm. It requires manual adjustment to make the dimension of feature extraction compatible with the required input of the classifier, which has certain limitations.
In the 21st century, deep learning has gradually developed and matured. Given that traditional machine learning methods have difficulty in efficiently and accurately processing time series data, adopting deep learning methods to mine useful information from time series data has become a key focus of many scholars. The results prove that it can effectively perform online monitoring and accurately classify defect types. In literature [20], in response to the problem that the statistical features of traditional partial discharge (PD) pattern recognition rely on expert experience and lack certain generalization, a partial discharge pattern recognition method based on CNN and long-short term features was developed. The results showed that CNN-LSTM has better overall recognition accuracy. Literature [21] developed a deep learning method based on CNN for pattern recognition of high-voltage cable insulation defects. The results showed that the performance of the CNN method was improved compared to traditional methods such as BPNN and SVM.
Transformer is a deep learning model that has emerged in recent years [22]. After its first improvement in 2019, it was applied to time series prediction and achieved good results [23]. With the widespread application of Transformer in the field of computer vision, target detection algorithms based on Transformer have also made significant progress, such as DETR [24], VIT-FRCNN [25], and Deformable DETR [26]. However, the high computational cost of the Transformer method makes it difficult to deploy in practical tasks. Therefore, this paper introduces the Transformer to construct a cable insulation defect classification model. To overcome the problems that a single deep learning method may have in classification, such as poor prediction accuracy during a certain period of time and sensitivity to feature selection, a CNN-Transformer composite cable insulation defect classification model is proposed by combining CNN. The proposed CNN-transformer model excels in accuracy by combining CNN feature extraction with Transformer’s capability for long-range dependency modeling. It is designed for high computational efficiency, optimizing training and inference speeds. The model also exhibits robustness to data variations and noise, making it a strong contender among current state-of-the-art methods.
The innovations of this study are as follows:
(1) The introduction of ultrasonic testing technology, which is non-invasive, highly sensitive, capable of quickly and accurately locating defects, and offers strong environmental adaptability and data visualization characteristics.
(2) The proposal of a CNN-Transformer composite model for the first time in cable insulation defect classification, addressing the challenge of distinguishing between the extremely similar reflection signals from different types of cable insulation defects.
2 Classification model
Unlike traditional methods, the CNN Transformer proposed in this paper takes the original one-dimensional signal for cable defect detection as input, without the need for any complex preprocessing operations. It integrates feature extraction and disturbance recognition, and directly outputs classification results. To ensure the model’s reliability in power systems and prevent harm from misclassification, a multi-faceted approach is implemented. This includes extensive testing, validation through diverse datasets, integration of operational environment understanding, and a feedback mechanism for continuous learning. Additionally, safety protocols are in place to prioritize system integrity in cases of uncertainty, collectively reinforcing the model’s dependability and the safety of power systems.
2.1 Transformer
Transformer consists of an encoder and a decoder, completely abandoning the basic architecture of recurrent neural networks and convolutional neural networks, and using attention mechanisms to complete network construction. The multi-head attention mechanism is the biggest highlight of the Transformer. The Transformer module is the core part of cable defect detection, used for feature extraction and representation. In the entire cable defect detection, the Transformer module is composed of multiple stacked Transformer basic modules, and the depth of the network is the number of Transformer basic modules. A Transformer basic module consists of a multi-head self-attention (MSA) module, a Multi-layer Perception (MLP) module, two residual modules, and two normalization modules.
2.1.1 MSA layer
The MSA layer is the core of the Transformer module. The attention mechanism can be seen as a mapping from a query matrix Query (Q) and a set of key-value matrices Key (K)-Value (V) to the output, represented by Eq. 1.
where dk is the dimension of Q and K. Q. K and V are essentially a set of linear mappings of the input time series. The attention mechanism enables each embedded subsequence in the input time series to obtain information from all other subsequences, which is very effective in solving the long-term dependencies of the time series. However, a set of Q, K, and V cannot obtain information from all subspaces, so multiple attention heads are concatenated into a new attention module called multi-head attention, represented by Eq. 2.
where the attention weight matrix
where Wq, Wk, and Wv are three trainable parameter matrices.
The multi-head attention mechanism performs the self-attention process h times, combines the outputs, and performs normalization through residual connection to obtain the output of the attention layer. The process is shown in Figure 1.
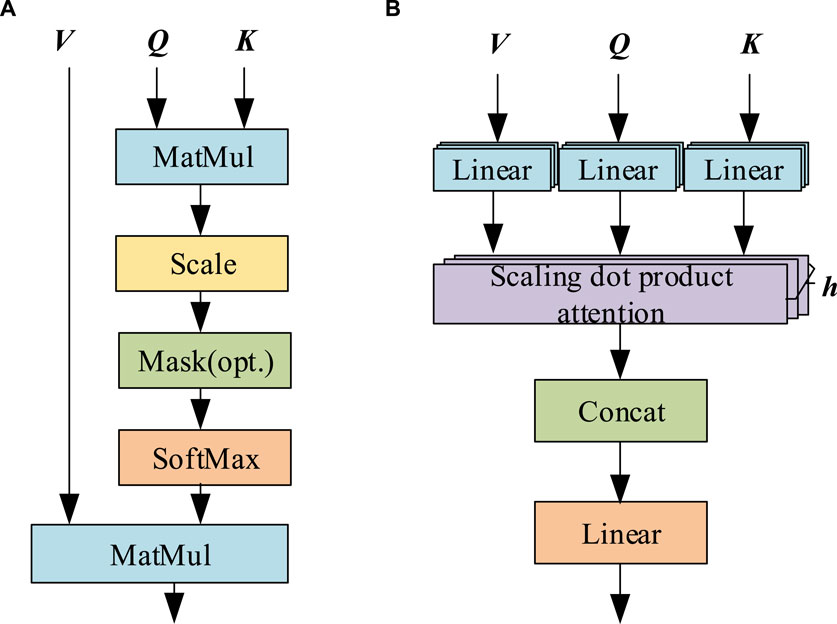
Figure 1. Scaling dot product attention and multi-head attention process diagram. (A) Scaling dot product attention. (B) Multiple headed attention.
2.1.2 MLP layer
In order to enhance the non-linear feature extraction capability of the Transformer, a multi-layer perceptron module is introduced. MLP first uses a nonlinear activation function to increase the dimensionality of the input, and then uses a linear transformation to reduce the dimensionality. For input x, MLP(x) can be represented by Eq. 6.
Linear transformation weight matrix
where
2.1.3 Residual and normalization modules
As the number of layers in the network deepens, nonlinear activation functions lead to data being mapped to more discrete spaces, making it increasingly difficult to fit the mapping function. Multilayer backpropagation may lead to gradient explosion and vanishing. The residual module is essentially a superposition operation between the nonlinear transformations of input and output, as shown in Figure 2. Among them, x is the input, and the mapping function that needs to be fitted in the network can be reconstructed as F(x)+x through residual connections. The residual connection path of the side branches makes the mapping function easier to fit when the network layers are deeper. Therefore, introducing residual modules in the MSA and MLP layers can greatly alleviate the problem of gradient vanishing and exploding as the network layers deepen.
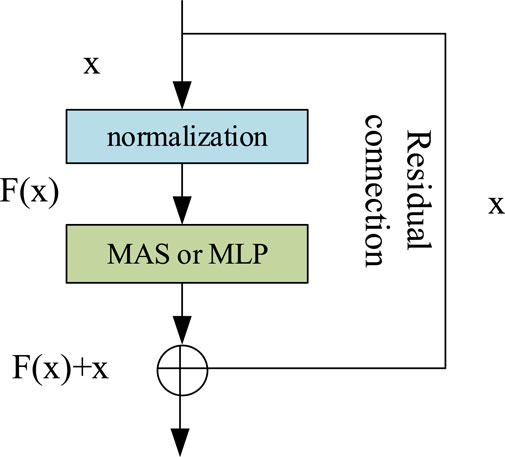
Figure 2. Residual block structure.
In order to ensure the consistency of data distribution and accelerate the convergence speed of the model, a normalization module is introduced before the MSA and MLP layers. The commonly used normalization modules include Batch Normalization (BN) [27] and Layer Normalization (LN) [28]. BN standardizes the features of each batch, while LN standardizes all features of hidden layers in the network, regardless of the input batch size. In the Transformer model, the input is a one-dimensional time-series signal with a long length. To save hardware costs, small batch data is used for training. Compared to BN, LN can make the model converge faster in small-batch training. Therefore, this paper uses LN for normalization processing.
2.2 CNN-transformer
In the CNN-Transformer model, the Convolutional Neural Network component initially processes the input data. It extracts local features through convolutional layers and introduces non-linearity through activation layers such as ReLU to enhance the model’s expressive power. Pooling layers may then reduce the spatial dimensions of the features, decreasing the number of parameters. Following this, the Transformer component captures global dependencies through self-attention mechanisms and expands this capability with multi-head attention to focus on different parts of the sequence. Each self-attention layer is typically followed by a feed-forward network to further refine the feature representation. Layer normalization and residual connections are used to stabilize the training process and prevent the vanishing gradient problem. By combining the CNN’s ability to extract local features with the Transformer’s capacity to capture global dependencies, the CNN-Transformer model excels in tasks involving image processing, sequence data, and other complex pattern recognition challenges. In the direction of time series prediction, CNN is used to extract spatial features between different feature values in the sequence. It is to upscale the original signal into a two-dimensional image, and then extract deep features using CNN and other networks. To better adapt to the task of cable fault classification, convolutional layers and global average pooling structures are added, and the results are output through a fully connected layer. The improved method can better utilize the feature information of time series data and adapt to the characteristics of cable fault classification tasks. The method structure is shown in Figure 3. The CNN-Transformer model approaches the feature extraction process differently from traditional methods. While traditional CNNs are adept at capturing local features through convolutional operations, the integration with the Transformer component allows the model to not only focus on local patterns but also to leverage the Transformer’s strength in capturing long-range dependencies and contextual information across the entire input data. This fusion enables a more comprehensive feature representation, where the CNN extracts detailed spatial hierarchies and the Transformer processes these features to understand broader relationships and sequences, leading to potentially more accurate and robust models in various tasks such as image classification, natural language processing, and beyond.
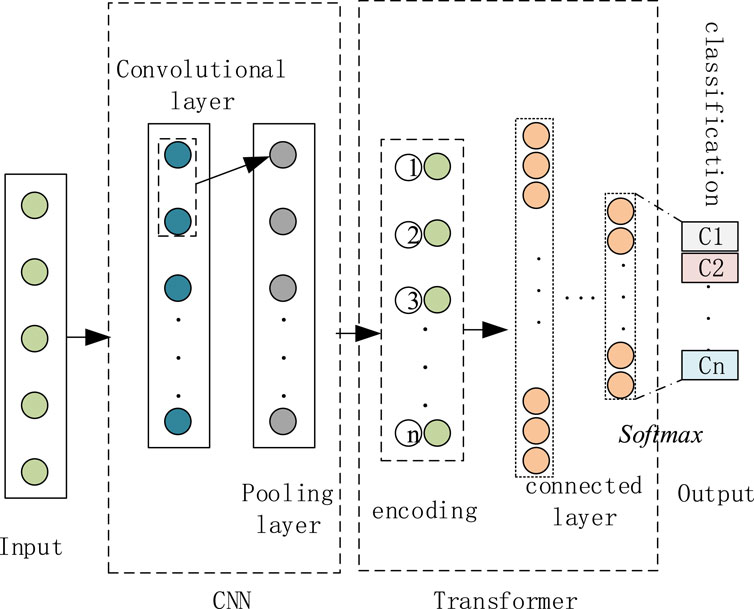
Figure 3. CNN transformer network model structure diagram.
The model is inherently scalable and adaptable, designed to manage larger datasets efficiently. Its architecture allows for flexibility in handling various cable insulation materials and a diverse range of defect types, with the potential for further enhancement through additional training and parameter tuning as needed.
The specific steps are described as follows:
1) Conduct preliminary feature extraction on the input one-dimensional time series signal through convolution to obtain feature information of the cable insulation defect signal at different time scales.
2) The convolutional features extracted are sent to a time series Transformer, which embeds the category and location information of the original signal for encoding. The multi-head attention mechanism captures deeper transient local features and periodic global features of the cable insulation defect signal, and the multilayer perceptron module improves the model’s nonlinear feature extraction ability. The residual connection module is used to avoid gradient explosion and vanishing gradient network degradation problems, and extracts effective features required for classification.
3) Input the features to the fully connected layer and softmax classifier to obtain the fault signal category label recognized by the model.
The model’s performance in real-world scenarios is enhanced through the integration of noise reduction techniques and robust feature extraction methods. Its architecture and training process are specifically tailored to improve generalization, allowing it to adapt to real-world data deviations. Despite these measures, ongoing adjustments and optimizations are essential to address unknown noise and variability. Implementing the CNN-transformer model in industrial environments involves challenges such as ensuring data quality and quantity, securing sufficient computational resources, integrating with existing systems, meeting real-time processing demands, maintaining robustness to environmental variability, achieving scalability, complying with regulatory standards, and managing ongoing model maintenance and updates. These factors can significantly influence the practical application and effectiveness of the model in industrial settings. The model is slated for enhancement with a roadmap that includes adding features to boost its adaptability across various cable types and environmental settings. This strategy involves broadening the training dataset and possibly integrating self-adaptive algorithms for in-situ learning. The architecture will undergo refinement to manage material and defect variances more adeptly, with a commitment to uphold efficiency and efficacy in a spectrum of industrial environments. The development cycle is designed to be iterative, allowing for regular updates informed by practical deployment and feedback.
3 Ultrasonic testing results
3.1 Test platform
The cable insulation defect detection test device is shown in Figure 4 and consists mainly of a cable termination sample, an ultrasonic probe, a power supply, an ultrasonic visualization platform, and a USB communication cable. The steps for cable insulation defect detection are as follows. First, an ultrasonic probe makes direct contact with the cable insulation surface, and ultrasonic waves are transmitted into the interior of the cable insulation sample through a coupling agent. Then, the reflected signals are processed by a digital controller and converted into waveforms displayed on the display system interface. The specific steps used in the experiment include sample preparation, the transmission and reception of ultrasonic signals, and signal processing and analysis. During the detection process, the ultrasonic probe is directly in contact with the cable insulation surface through a couplant, and the ultrasonic wave is transmitted into the interior of the cable insulation sample under the action of the couplant. The reflected signal is processed by a digital controller and converted into a waveform that is displayed on the display system interface. The dataset consists of 400 samples, which are divided into training, validation, and testing sets for the model’s training, tuning, and performance evaluation, respectively. The collection method of the samples adheres to standardized ultrasonic detection procedures, ensuring the consistency and reliability of the data. All data were collected in a controlled laboratory environment to minimize the impact of environmental factors on signal acquisition.
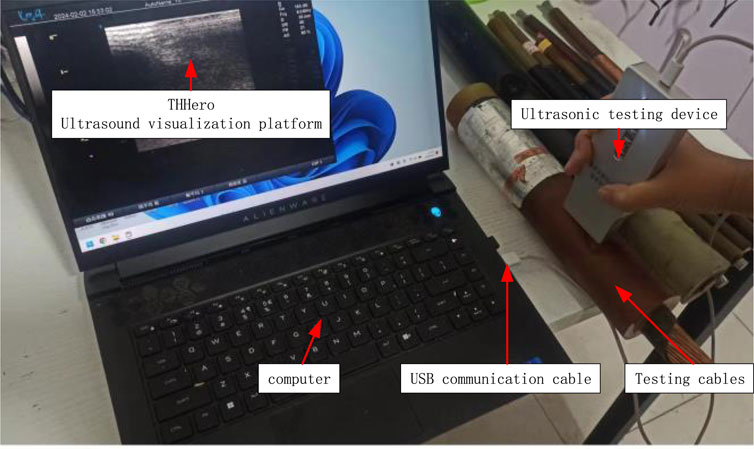
Figure 4. Cable insulation defect detection test device.
3.2 Monitoring results
Figures 5–8 are internal echoes detected by the cable insulation defect detection test device under different conditions. From the figure, the echo signal characteristics of the cable under different conditions are not particularly obvious, with the same voltage fluctuation amplitude.
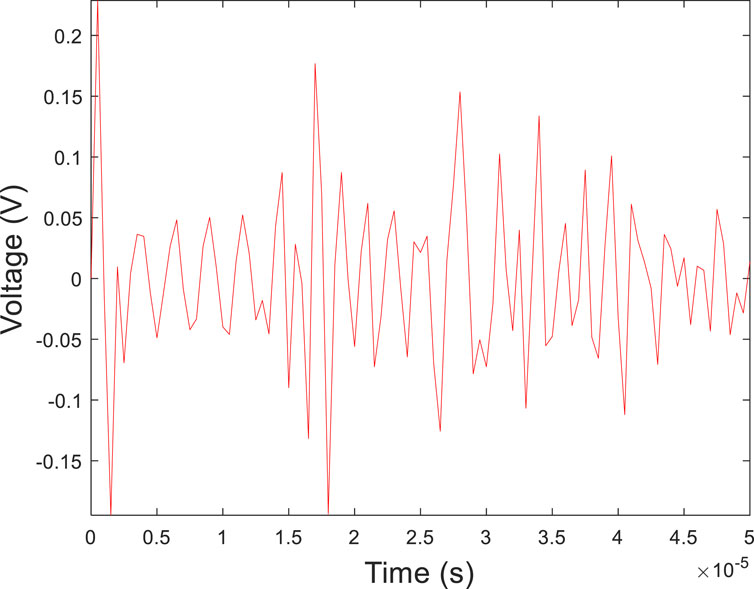
Figure 5. Internal echoes of cables under normal conditions.
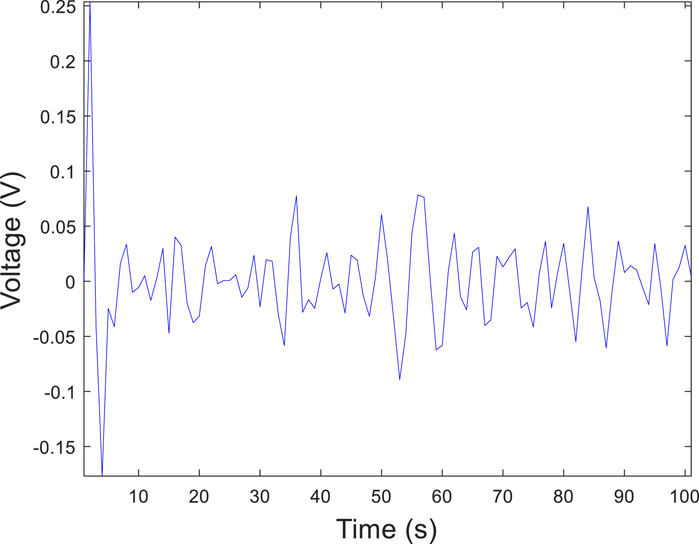
Figure 6. Echo of internal crack defects in cables.
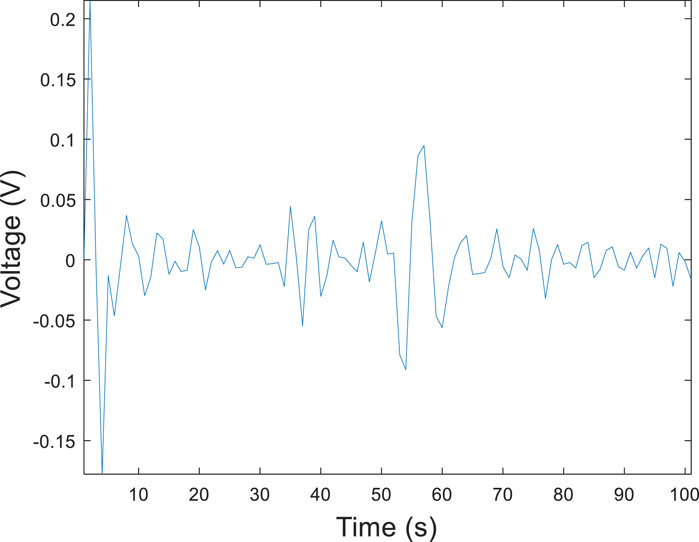
Figure 7. Echo of internal water droplet defects in cables.
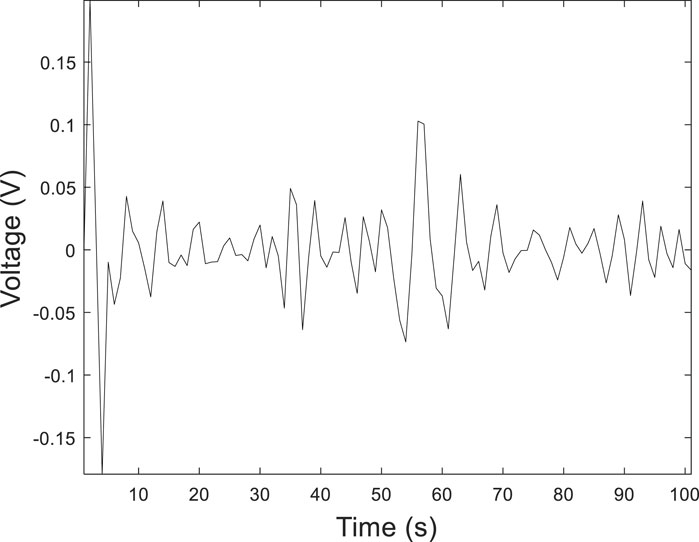
Figure 8. Echo of internal bubble defects in cables.
4 Classification results and analysis
4.1 Model parameters and training results
This article conducts the verification of the CNN-Transformer classification model based on ultrasound detection data. The MCF-TST model proposed in this article is built on the PyTorch deep learning framework and Python. The hardware and software parameters of the training environment are shown in Table 1. The preset CNN node number (32, 64, 128), Dropout value (0.1, 0.2, 0.3, 0.4, 0.5), Encoder layer number (4, 5, 6), and time step (4, 6, 8, 10). There are 600 groups of each signal, and they are divided into training set, validation set and test set according to 4:1:1. The dataset for the CNN-transformer model was assembled with a blend of simulated and real-world data to ensure a broad representation of defect scenarios. It includes a significant number of samples necessary for effective model training and validation, with a focus on high data quality and precise labeling. The exact dataset size is tailored to the task’s demands, but it is sufficiently large to enable the model to generalize well across various conditions. The cross-entropy function commonly used in classification problems is chosen as the loss function for training, represented by Eq. 8.
where B is the size of the training batch, Ncls is the number of cable insulation defect categories,
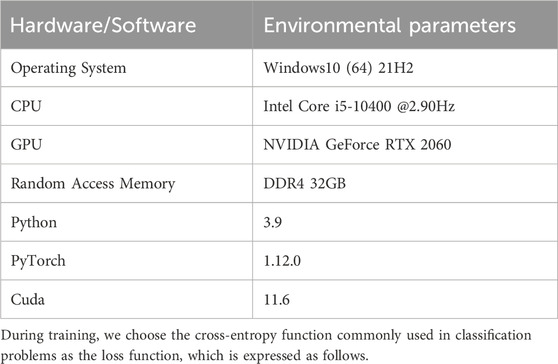
Table 1. Software and hardware parameters.
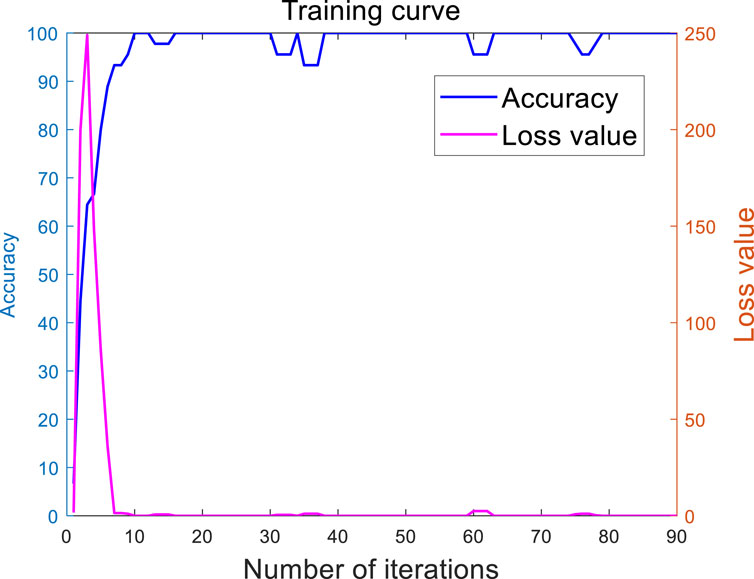
Figure 9. Model training process.
Figure 6 shows that the model proposed in this article can achieve high accuracy after training, and maintains high accuracy and low loss throughout. The model converges quickly and does not exhibit overfitting. The recognition accuracy of various cable insulation defects is shown in Table 2. To assess the model’s performance under varying conditions, a series of experiments were conducted in this paper, simulating the impact of various environmental factors and signal disturbances on the model’s capabilities. These experiments included classification tests under conditions with added noise at different signal-to-noise ratio levels, altered positions of the ultrasonic probe, and cable samples of varying degrees of aging. The results indicate that while the model performs exceptionally well under high signal-to-noise ratio conditions, its accuracy declines in the presence of high noise levels or when signal characteristics are not distinct.
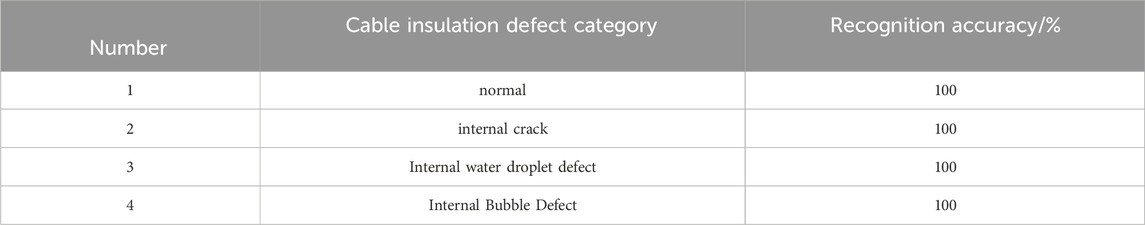
Table 2. Recognition accuracy of CNN-Transformer cable insulation defects.
4.2 Verification of model recognition accuracy
To verify the performance of the model in this article, the accuracy of recognition compared with other machine models is shown in Table 3. The experiments utilized several different types of cable samples, each with unique physical properties and signal characteristics. The model’s performance on these samples was evaluated by comparing it with its performance on the original dataset. Furthermore, to further explore the model’s generalization ability, tests were conducted under various signal-to-noise ratio conditions, simulating the diverse noisy environments that might be encountered in field applications. The results indicated that while the model achieved high accuracy on the original dataset, its performance declined on certain types of cable samples. This revealed potential limitations of the model when generalizing to data that significantly deviates from the training data. To address this issue, strategies such as data augmentation, transfer learning, or multi-task learning are considered for future work to enhance the model’s generalization capability across different types of cables.
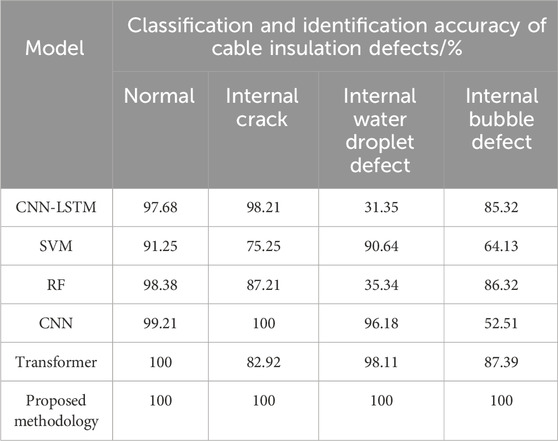
Table 3. Comparison of recognition accuracy of different models.
To enhance the rigor and verifiability of comparative experiments, this paper provides a detailed description of the implementation parameters for the traditional methods involved. Here are example parameters for each method:
1) Support Vector Machine (SVM): The kernel function is set to the Radial Basis Function (RBF), the penalty parameter (C) is chosen as 10, and the gamma parameter for the kernel function is set to 0.1, selected based on cross-validation results.
2) Random Forest (RF): The number of decision trees in the forest is set to 100, and the maximum number of features considered for the split in each tree is set to the square root of the total number of features. The splitting criterion uses Gini impurity.
3) Convolutional Neural Network (CNN): The network includes two convolutional layers, each followed by a max-pooling layer. The first convolutional layer uses 32 filters of size 3 × 3, and the second convolutional layer uses 64 filters of size 3 × 3. A ReLU activation function follows all convolutional layers, and a fully connected layer at the end performs classification.
From the data in Table 3, it can be seen that compared to traditional machine learning model classifiers and neural networks, the model proposed in this paper has the highest accuracy in identifying four types of cable insulation defects. The comparison results demonstrate the superiority of the Transformer model over other models in Transformer cable insulation defect recognition.
To further verify the confusion of the model for different types of cable insulation defects, we used a test set with 30dB noise, with 100 data points per type of cable insulation defect. We drew a confusion matrix for the four types of cable insulation defects, as shown in Figures 10, 11. The horizontal and vertical coordinates represent the true label and predicted label of the cable insulation defect signal, respectively. During the assessment of the proposed CNN-Transformer model, the focus was on its computational efficiency, a critical determinant for practical deployment. The model’s training time, measured from the start of initialization until the point of convergence where the loss plateaued, was around 1 h, highlighting the duration necessary for it to adeptly learn the nuances of cable insulation defects. Furthermore, the inference time for the model to classify a single instance was benchmarked at approximately 0.1 s, demonstrating its capability to perform prediction tasks efficiently and suggesting its suitability for real-time applications.
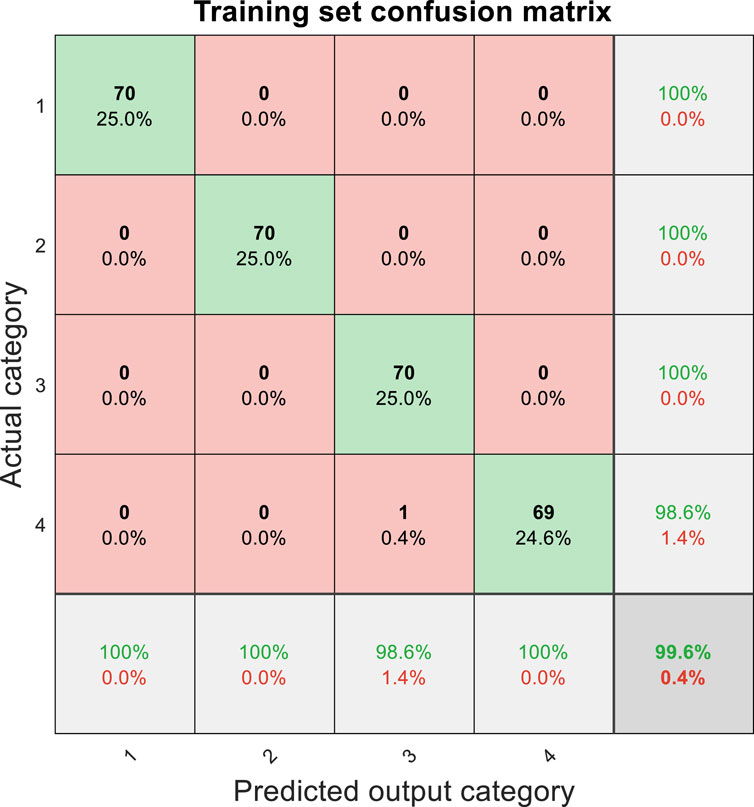
Figure 10. Training set mixing matrix.
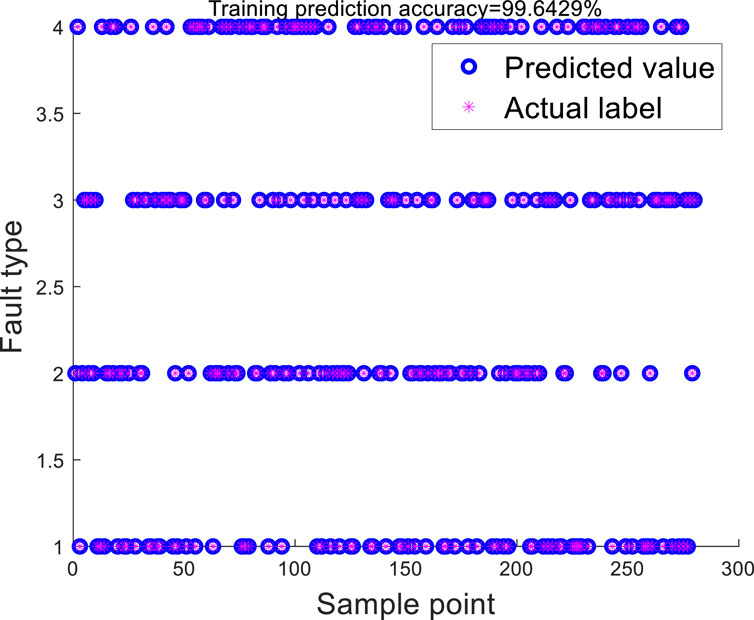
Figure 11. Comparison between predicted values and true values on the training set.
As shown in Figures 12, 13, all types of cable insulation defects can be accurately identified by the model when identifying composite cable insulation defects. In this paper, the calculated 100% accuracy rate is based on experimental results under specific conditions. This outcome was measured on a carefully selected and balanced dataset, targeting a range of predefined defect types and severity levels. The evaluation process employed standardized metrics, including precision, recall, and the F1 score, and utilized cross-validation and an independent test set to ensure the accuracy and reproducibility of the results. Moreover, the model considered various potential defect scenarios during both training and testing phases to enhance its generalization capabilities. However, it should be noted that this accuracy rate may be subject to the constraints of the experimental conditions, and the complexities encountered in real-world applications may impact the model’s performance.
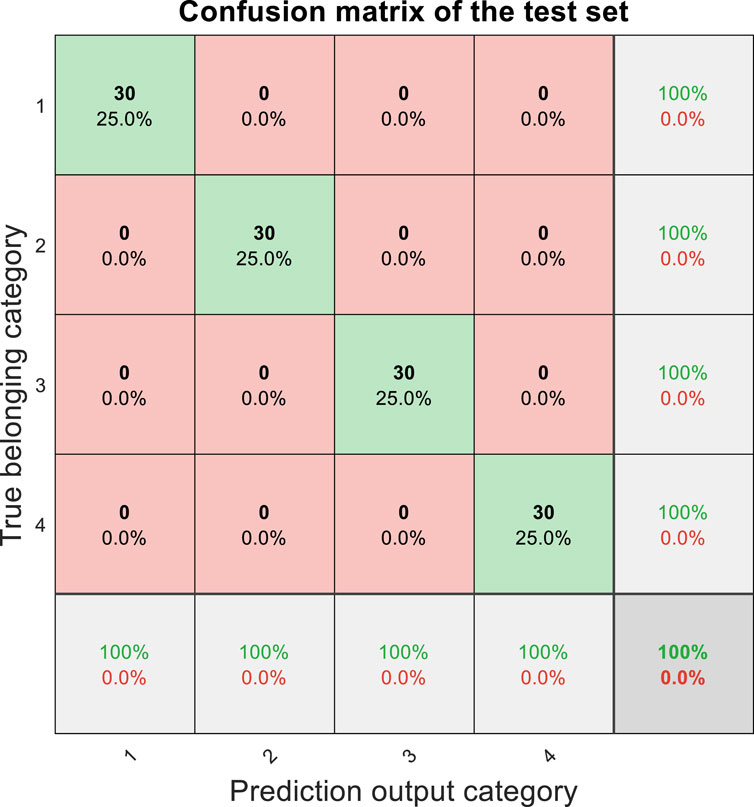
Figure 12. Test set confusion matrix.
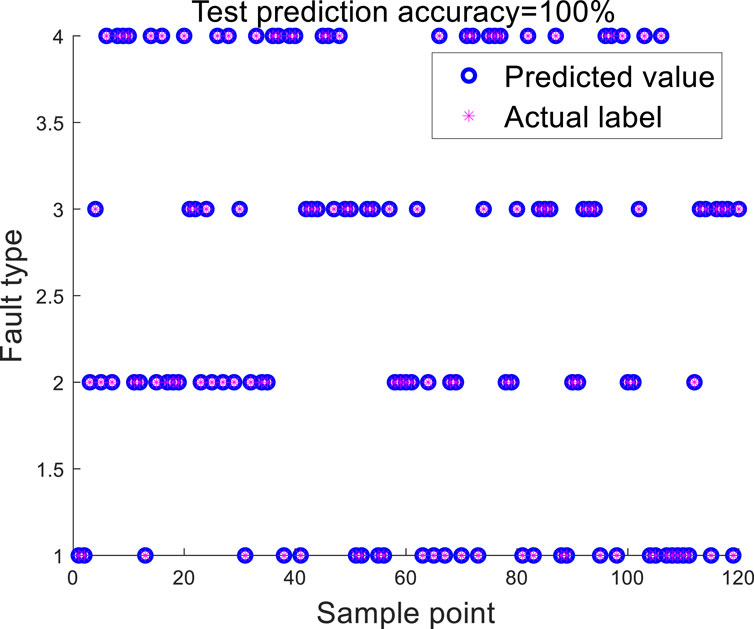
Figure 13. Comparison between predicted and true values on the test set.
5 Conclusion
Considering that the detection of cable insulation defects is a key step to ensure the normal operation and safe use of cables, there are certain limitations in common detection and identification methods. Therefore, it is proposed to adopt ultrasonic detection technology combined with CNN-Transformer for cable insulation defect classification. Through simulation experiments and hardware experiments, the following conclusions are drawn:
1) Ultrasonic testing method is used to detect defects in insulated cables, which can detect the defect signals of insulated cables and provide clear echoes of defects.
2) Proposed CNN-Transformer, which captures the local transient features and periodic steady-state global features of cable insulation defect signals through multi-head attention mechanism, and exhibits excellent performance in cable insulation defect recognition.
3) Through various comparative experiments, the model with the optimal parameters is determined to identify the signal of cable insulation defects, and the recognition accuracy reaches 100% in the absence of noise.
The dataset used in this article is still not comprehensive enough. In the future, it may be considered to further improve the experiment and validate the model with live measurement data to meet application requirements.
Data availability statement
The original contributions presented in the study are included in the article/Supplementary Material, further inquiries can be directed to the corresponding authors.
Author contributions
NZ: Writing–original draft, Writing–review and editing. ZD: Writing–original draft, Writing–review and editing. QL: Conceptualization, Data curation, Methodology, Writing–original draft. KG: Conceptualization, Investigation, Software, Writing–review and editing. ZZ: Data curation, Methodology, Supervision, Writing–original draft. BL: Data curation, Formal Analysis, Writing–review and editing.
Funding
The author(s) declare that financial support was received for the research, authorship, and/or publication of this article.
Conflict of interest
Authors NZ, ZD, QL, KG, ZZ, and BL were employed by State Grid Shijiazhuang Electric Power Supply Company.
The authors declare that this study received funding from State Grid Hebei Electric Power Co., Ltd. (No. KJ2022-006). The funder was involved in the study design, collection, analysis, interpretation of data, the writing of this article, and the decision to submit it for publication.
Correction note
A correction has been made to this article. Details can be found at: 10.3389/fphy.2025.1653145.
Publisher’s note
All claims expressed in this article are solely those of the authors and do not necessarily represent those of their affiliated organizations, or those of the publisher, the editors and the reviewers. Any product that may be evaluated in this article, or claim that may be made by its manufacturer, is not guaranteed or endorsed by the publisher.
References
1. Ren G, Wang Y, Cao J. Overview of early insulation fault detection methods for power cables. J Chongqing Univ (2023) 46(11):1–12. doi:10.11835/j.issn.1000-582X.2022.212
2. Hua X, Wang L, Yang S. Lifetime prediction of aviation cables based on an improved electromagnetic–thermal coupling model. IEEE Trans Dielectr Electr Insul (2023) 30(6):2788–97. doi:10.1109/tdei.2023.3295347
3. Shen XW, Du CB, Jiang SY, Zhang P, Chen LL. Multivariate uncertainty analysis of fracture problems through model order reduction accelerated SBFEM. Appl Math Model (2024) 125:218–40. doi:10.1016/j.apm.2023.08.040
4. Hua X, Wang L, Yang S. Multiscale analysis of the aging process of cable insulation. IEEE Trans Dielectr Electr Insul (2022) 30(1):238–46. doi:10.1109/tdei.2022.3217425
5. Shen XW, Du CB, Jiang SY, Sun LG, Chen LL. Enhancing deep neural networks for multivariate uncertainty analysis of cracked structures by POD-RBF. Theor Appl Fract Mech (2023) 125:103925. doi:10.1016/j.tafmec.2023.103925
6. Hua X, Wang L, Zhang Y. Analysis and diagnosis of shielded cable faults based on FEM and time-reversal time-frequency domain reflectometry. IEEE Trans Ind Electron (2021) 64(4):4205–14. doi:10.1109/TIE.2021.3071685
7. Chen LL, Wang ZW, Lian HJ, Ma YJ, Meng ZX, Li P, et al. Reduced order isogeometric boundary element methods for CAD-integrated shape optimization in electromagnetic scattering. Comput Methods Appl Mech Eng (2024) 419:116654. doi:10.1016/j.cma.2023.116654
8. Hua X, Xu W, Wang L, Zhang Y, Temperature mapping model of cables considering the coupling of electromagnetic and thermal fields. Digit Twin (2023) 3(2):1–16. doi:10.12688/digitaltwin.17718.2
9. Dong YG. Detection method for insulation defects in power cables. Era Agr Mach (2015) 42(10):19–20.
10. Quan YS, Wang DJ, Chen G, Zhang ZC. Study on the methodology of detection for power cable insulation defects based on oscillatory wave. Adv Mater Res (2013) 805-806:880–3. doi:10.4028/www.scientific.net/amr.805-806.880
11. Lin YB, Chen A, Jin YX Simulation study on cable insulation defect detection based on capacitance tomography imaging. J Electr Eng (2023) 18(3):54–62.
12. Fang CH, Zhang F, Dang WJ A method for identifying surface defects in the main insulation of 10 kV cables based on the Canny algorithm. Optoelectron Lasers (2021) 32(11):1188–95.
13. Wen F, Jin J. Detection of superficial defects in the insulation layers of aviation cables by infrared thermographic technique. Coatings (2022) 12(6):745. doi:10.3390/coatings12060745
14. Luo G, Lu Q, Huang H, Chen H, Han J, Chen X. Research on cable insulation layer defect detection based on terahertz technology. J Phys Conf Ser (2023) 2662(1):012024–248. doi:10.1088/1742-6596/2662/1/012024
15. Xie CZ, Zhang Y, Hao YP Application of ultrasonic flaw detector to detect internal defects of composite insulators. High Voltage Engineering (2009) 35(10):2464–9. doi:10.1016/S1003-6326(09)60084-4
16. Gao Y, Li XD, Xue JQ Research on ultrasonic pulse detection of internal defects in silicone rubber. High Voltage Engineering (1997) 23(2):17–19.
17. Wang Q, Huang M, Wang X, Zhang Y, Zhang Q, An Y, et al. Defect detection and identification for aircraft cable insulation layer based on deep forest. Ultrasonics (2023) 135:107128. doi:10.1016/j.ultras.2023.107128
18. Zhou X, Wu X, Ding P, Li X, He N, Zhang G, et al. Research on transformer partial discharge UHF pattern recognition based on CNN-LSTM. Energies (2020) 13:61. doi:10.3390/en13010061
19. Howard R, Cegla F. On the probability of detecting wall thinning defects with dispersive circumferential guided waves. NDT E Int (2017) 86:73–82. doi:10.1016/j.ndteint.2016.11.011
20. Peng X, Yang F, Wang G, Wu Y, Li L, Li Z, et al. A convolutional neural network-based deep learning methodology for recognition of partial discharge patterns from high-voltage cables. IEEE Trans Power Deliv (2019) 34(4):1460–9. doi:10.1109/tpwrd.2019.2906086
21. Uckol HI, Ilhan S, Ozdemir A. Workmanship defect classification in medium voltage cable terminations with convolutional neural network. Electr Power Syst Res (2021) 194:107105. doi:10.1016/j.epsr.2021.107105
22. Liang H, Liu S, Du J A review of deep learning applications in time series prediction research. Comput Sci Explor (2023) 17(6):1285–1300.
23. Vaswani A, Shazeer N, Parmar N Attention is all you need. arXiv (2017). doi:10.48550/arXiv.1706.03762
24. Carion N, Massa F, Synnaeve G End-to-end object detection with transformers. In: 2020 European conference on computer vision (ECCV) (2020). p. 213–29.
25. Beal J, Kim E, Tzeng E Toward transformer-based object detection (2020). doi:10.48550/arXiv.2012.09958
26. Chen LL, Cheng RH, Li SZ, Lian HJ, Zheng CJ, Bordas SPA. A sample-efficient deep learning method for multivariate uncertainty qualification of acoustic–vibration interaction problems. Comput Methods Appl Mech Eng (2022) 393:114784. doi:10.1016/j.cma.2022.114784
27. Chen LL, Li HZ, Guo YY, Chen P, Atroshchenko E, Lian HJ. Uncertainty quantification of mechanical property of piezoelectric materials based on isogeometric stochastic FEM with generalized Nth-order perturbation. Eng Comput (2023) 40(1):257–77. doi:10.1007/s00366-023-01788-w
Keywords: cable, insulation defect, ultrasonic reflection, defect recognition, CNN-transformer
Citation: Zhao N, Duan Z, Li Q, Guo K, Zhang Z and Liu B (2024) A cable insulation defect classification method based on CNN-transformer. Front. Phys. 12:1432527. doi: 10.3389/fphy.2024.1432527
Received: 14 May 2024; Accepted: 19 June 2024;
Published: 01 August 2024; Corrected: 15 October 2025.
Edited by:
Pei Li, University of Southern Denmark, DenmarkReviewed by:
Jian Zhang, Wenzhou University, ChinaQiang Liu, Chengdu University of Information Technology, China
Copyright © 2024 Zhao, Duan, Li, Guo, Zhang and Liu. This is an open-access article distributed under the terms of the Creative Commons Attribution License (CC BY). The use, distribution or reproduction in other forums is permitted, provided the original author(s) and the copyright owner(s) are credited and that the original publication in this journal is cited, in accordance with accepted academic practice. No use, distribution or reproduction is permitted which does not comply with these terms.
*Correspondence: Ning Zhao, bW9qNjMwMkAxNjMuY29t