
94% of researchers rate our articles as excellent or good
Learn more about the work of our research integrity team to safeguard the quality of each article we publish.
Find out more
ORIGINAL RESEARCH article
Front. Phys., 12 July 2024
Sec. Medical Physics and Imaging
Volume 12 - 2024 | https://doi.org/10.3389/fphy.2024.1430035
This article is part of the Research TopicMulti-Modality Based AI in Biomedical Physics for Disease Diagnosis and TreatmentView all articles
 Huijun Ding1,2
 Zhou Du1
 Ziwei Wang1Junqi Xue3
 Zhaoguo Wei4,5Kongjun Yang4,5Shan Jin4,5
 Zhiguo Zhang3,6*
 Jianhong Wang4,5*
Depression is a prevalent mental health problem across the globe, presenting significant social and economic challenges. Early detection and treatment are pivotal in reducing these impacts and improving patient outcomes. Traditional diagnostic methods largely rely on subjective assessments by psychiatrists, underscoring the importance of developing automated and objective diagnostic tools. This paper presents IntervoxNet, a novel computeraided detection system designed specifically for analyzing interview audio. IntervoxNet incorporates a dual-modal approach, utilizing both the Audio Mel-Spectrogram Transformer (AMST) for audio processing and a hybrid model combining Bidirectional Encoder Representations from Transformers with a Convolutional Neural Network (BERT-CNN) for text analysis. Evaluated on the DAIC-WOZ database, IntervoxNet demonstrates excellent performance, achieving F1 score, recall, precision, and accuracy of 0.90, 0.92, 0.88, and 0.86 respectively, thereby surpassing existing state of the art methods. These results demonstrate IntervoxNet’s potential as a highly effective and efficient tool for rapid depression screening in interview settings.
Depression is a common psychological disorder worldwide characterized by persistent and long term depression, leading to self harm and suicide in the worst cases [1]. According to the World Health Organization prediction, by 2022, the number of people suffering from depression worldwide will reach about 322 million [2], and depression will become the second most common mental illness in the world. Several studies have shown that intervening early in the course of depression is crucial to arresting the further development of depressive symptoms [3]. If there is a fast and convenient method for diagnosing depression, large scale screening or self examination of patients can be realized to achieve the purpose of early diagnosis. However, the current clinical diagnosis methods for depression mainly rely on psychiatrists to conduct subjective assessments through interviews, combined with the results of self rating scales such as the Patient Health Questionnaire-9 (PHQ-9) for comprehensive assessment [4]. The entire diagnosis process is time consuming and takes up a lot of medical human resources. Therefore, the number of patients who can be helped is limited, and the course of depression may already be late at the time of diagnosis.
Recently, with the rapid development of machine learning, especially deep learning, many computer-aided depression diagnosis methods have been proposed to improve the above problems. By collecting audio, video, and text data from the patients, researchers analyze their associations with depression. The specific steps are to use the data of different modalities as the input of the machine learning network, and the depression related features are subsequently extracted and fed to the classifier to obtain the final prediction results. Although great progress has been made in improving diagnostic accuracy, great difficulties remain in practice. First of all, interview videos that include facial features may not be available due to privacy concerns. Secondly, the recorded interview data lasts for a long time, and it needs to be compared and evaluated before and after to make an overall judgment. However, processing long sequence information has always been a challenge in deep learning. Thirdly, the judgment of depression is based on information from multiple perspectives, including the language, expressions, and actions of the interviewee. Therefore, how to effectively integrate representative features from different sources in deep learning models requires continuous exploration and investigation [5]. Therefore, the task of automatic detection of depression still has many challenges, the specific related work will be reviewed in Section 2.
The most common networks used in automated depression detection systems are those based on CNN or RNN. And the Convolutional Neural Networks (CNNs) have been widely used to achieve state of the art (SOTA) performance in many tasks [6–8]. However, the amount of local information that a CNN can acquire depends on the size of convolutional kernel and the number of corresponding channels. Increasing the size of the convolution kernel or the corresponding number of channels will increase the model complexity. Meanwhile, CNNs focus on local information, and this mechanism makes it difficult to capture long range dependent information [9]. Therefore, the CNN has strengths in extracting and learning features from spatiotemporal data, but has limited ability to reflect the features of time series data. To address this issue, Recurrent Neural Networks (RNNs) have been widely applied to extract temporal information for depression detection in recent years [10–12]. The RNN model is a model that work specifically for time series data. However, as the data becomes longer, problems such as gradient loss and explosion occur [13, 14]. Models that address the above problems include the Long Short Term Memory (LSTM), the Bidirectional Long Short Term Memory (Bi-LSTM) and the Gated Recurrent Units (GRUs), which are variants of the RNN model. The LSTM model removes unnecessary information by adding an input gate, a forget gate, and an output gate to the memory cell of the hidden layer. Then, the problem of gradient loss and explosion is alleviated by passing the necessary information to the next state. Bi-LSTM is an improvement to the LSTM model, which includes a temporal element to reflect all the information of the past and future [15–17]. However, they cannot handle long term sequences satisfactorily. As the length of sequences increases, the performance of RNN-based networks rapidly decreases due to the forgetting problem. The forgetting problem of RNNs means that in the scenario of processing long term sequences, RNNs will lose the primary information when reading later series [18]. Meanwhile, the serial structure of the RNN model makes it impossible to realize parallel operations, resulting in low computational efficiency. However, the application scenarios of the interviews are primarily based on audio, even though text is derived from audio in some cases.
In this study, we focus on a novel dual-modal feature fusion network based on the Transformer structure for the automatic detection task of depression. The main contributions of this paper can be summarized as follows:
• We propose an IntervoxNet model based on the Transformer architecture, which simultaneously extracts audio and text features and effectively improves long-term dependencies;
• We introduce the Long Short Term Attention Fusion Network (LSTAFN) to learn alignment weights between audio frames and text words, effectively capturing the correlation between audio and text features in the temporal dimension;
• Our experiments involve two modalities, audio and text, of depression patients, which helps avoid over reliance on any single modality, thereby better protecting individual privacy.
The remainder of this paper is organized as follows. Section 2 briefly reviews the related published works. Section 3 provides the implementation details of the proposed network. Subsequently, Section 4 shows the details of the experiments. Section 5 presents the results and discussions. Finally, conclusion and challenges for future work are presented in Section 6.
Automatic detection methods for depression are usually to analyze and process of the patients’ video, audio and text information. A system that processes only one of the different types of information above for depression prediction is a single model depression detection scheme.
Depression automatic detection schemes are mainly based on two types of models, traditional machine learning and deep learning. Methods based on traditional machine learning algorithms include Support Vector Machine (SVM), Random Forest (RF), etc. [19–21]. However, although traditional machine learning algorithms can achieve depression detection to some extent, they are often limited by handcrafted feature extraction and complexity, making it difficult to capture the complex, nonlinear relationships in the data. Therefore, in recent years, the application of deep learning methods to extract audio and text features from patients for depression detection has become a hot research topic, with significant progress achieved in the utilization of audio features. In [22], Long Short-Term Memory (LSTM) networks are employed to model the temporal relationships of subject features for evaluating depression tendencies. They utilize a single modality, which can be either audio or text, primarily detecting depression through features such as pitch, intensity, and formant frequencies of speech. In [23], a model based on LSTM + CNN is proposed, which, compared to [22], extracts spatial features from the audio patterns through convolutional operations on the mel-spectrogram in the temporal dimension using 1D CNN, to predict the presence of depression. In [24], a 1D CNN model is proposed for feature extraction on the temporal dimension of speech signals followed by depression prediction. Compared to the LSTM, the 1D CNN method saves computational efficiency and achieves good performance on the DAIC-WOZ dataset. In [25], a text-based multitask Bi-LSTM model is proposed, utilizing pretrained word embeddings to predict depression. The method of extracting word-level features from text is formally introduced into depression detection tasks. This model also achieves high performance on the DAIC-WOZ dataset. Similarly, authors in [26] analyzed the interview transcripts of participants and the text features are extracted from questions related to certain topics.
Although existing models have achieved good results in automatic depression detection tasks based on single modality, most of the methods for extracting audio and text features rely on SVM-based approaches or CNN and RNN models. These models often struggle to capture long range dependency information and are computationally inefficient. Additionally, for text feature extraction, the majority of methods still use word-level feature representations, lacking contextual information. Therefore, it is necessary to explore an efficient and effective single-modality encoding branch that can capture long-range features.
Dual-modal learning is one of the most important strategies for depression detection. Previous studies have shown that dual-modal learning can obtain comprehensive information from data. By utilizing audio features such as fundamental frequency, loudness, formant resonances, speech duration and pauses, dynamic range, and mel-spectrogram, while also capturing semantic information through semantic embeddings and lexical features in text, the recognition accuracy and model robustness can be improved [27–30]. Currently, most dual-modal fusion approaches use late fusion or decision fusion to fuse different information, integrating features such as audio and text in the late stages of information processing. In [5, 31, 32], the authors achieve modality fusion through simple concatenation of dual-modal features. While this fusion method utilizes information from different modalities, the authors treat different modalities as equally important without considering their respective weights in depression classification. Moreover, directly concatenating dual-modal features mapped to different feature spaces may lead to ambiguity in the features between different modalities. In [18, 33], the authors adopt decision fusion to combine the results of single-modal classification. Although this method is intuitively effective, the final result depends solely on the sum of different single-modal prediction results, neglecting the relationship between modalities.
Therefore, it is essential to explore a fusion network that can facilitate interaction between dual-modal features, learn the contribution weights of different modalities to depression detection, and effectively utilize the fusion of different modal features.
The Transformer [15] has significant implications in the field of Natural Language Processing (NLP). It introduces the self-attention mechanisms, allowing the model to process all positional information in input sequences simultaneously, overcoming the limitations of traditional RNNs and CNNs in handling long-range dependencies. The emergence of the Transformer model has greatly advanced NLP technology, particularly in tasks such as machine translation, text generation, and text classification [34–36].
Despite the transformative impact of Transformers on various NLP tasks, their application in the domain of automatic depression detection remains limited. This may be because depression detection requires indepth analysis of individuals' emotional states, including data from various sources such as speech, text, and behavior, while most Transformers are primarily focused on processing textual data. Additionally, depression detection involves sensitive personal health information, raising concerns about data privacy and security, which further complicates the application of models.
In our experiment, we validate the use of the Transformer for extracting features from mel-spectrograms in the field of automatic depression detection. The experimental results indicate that Transformers can effectively extract spatial features from mel-spectrograms, demonstrating in a novel way the efficacy of the Transformer in the domain of automatic depression detection.
In this section, we introduce the overall architecture of the proposed method. The framework of the proposed methods is shown in Figure 1. Specifically, we design AMST and BERT-CNN to extract mel-spectrogram based spectrotemporal features for audio and contextual sentence features for the text modality respectively. Subsequently, to effectively fuse audio-text bimodal feature representations, we design the LSTAFN to compute temporal weight relationships between modalities, generating a more powerful fusion feature. Finally, the fusion feature is inputted into a decision layer for classification.
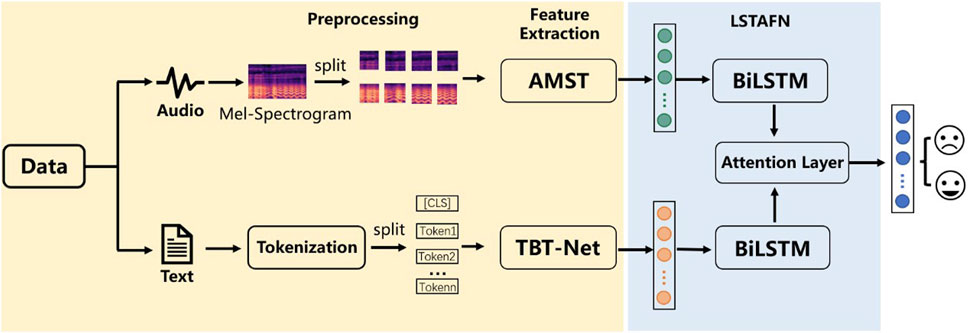
Figure 1. Overall system framework of the proposed method.
The proposed Audio Mel-Spectrogram Transformer (AMST) model is based on the Transformer architecture [15], which was originally proposed for natural language processing tasks. In traditional natural language processing tasks, the input to a Transformer model typically consists of a sequence of tokens or word embeddings, representing the sequential information of the text to be processed [37]. However, our task is based on speech recognition, where the input should be the spectrogram of audio. Compared to the raw spectrogram, the Mel-Spectrogram better reflects perceptual features of sound, particularly exhibiting higher resolution in the low-frequency region, preserving more detailed information, and possessing better discriminative power, which aligns more closely with the perceptual characteristics of the human auditory system. Therefore, utilizing Mel-Spectrograms as input can enhance the performance and stability of speech recognition systems, as demonstrated by Ref. [33]. Finally, we integrate Mel-Spectrograms into our method.
Figure 2 illustrates the process of handling raw audio in the experiment. For an input audio clip, it is first sampled and discretized, then processed through framing and windowing, followed by FFT to obtain the spectrum, and finally transformed into Mel-spectrogram using Mel filter bank. The Mel-spectrogram is computed by multiplying the short-time Fourier transform magnitude coefficients with the corresponding Mel filters [33]. Thus, it can be regarded as a nonlinear transformation of the spectrogram, which maintains high level details of the sound [5]. The relationship between the normal spectrogram and the Mel-spectrograms is depicted in Eq. 1, where f is the frequency of the spectrogram.
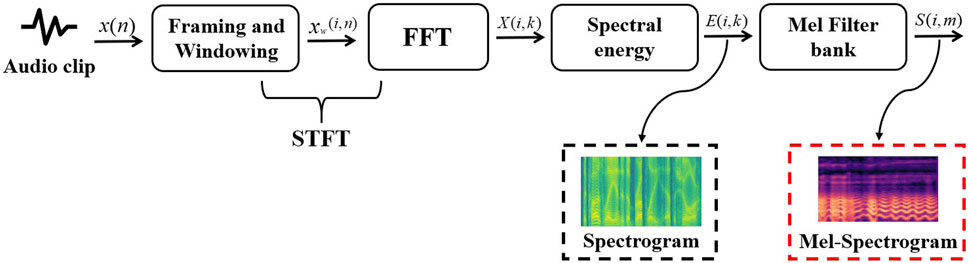
Figure 2. The flow chart of Mel-Spectrogram extraction.
Figure 3 illustrates the proposed AMST architecture. Firstly, by computing at every 10 ms interval using a 25 ms Hamming window, the original audio of duration T seconds is transformed into a sequence of 128-dimensional log Mel filter-bank features. This results in a Mel-spectrogram of dimension 128 × 100T as input to the AMST. We then split the Mel-spectrogram into a sequence of 16 × 16 sized patches with an overlap of 6 in both time and frequency dimensions. In the time dimension, if there are 100T frames, then we can take
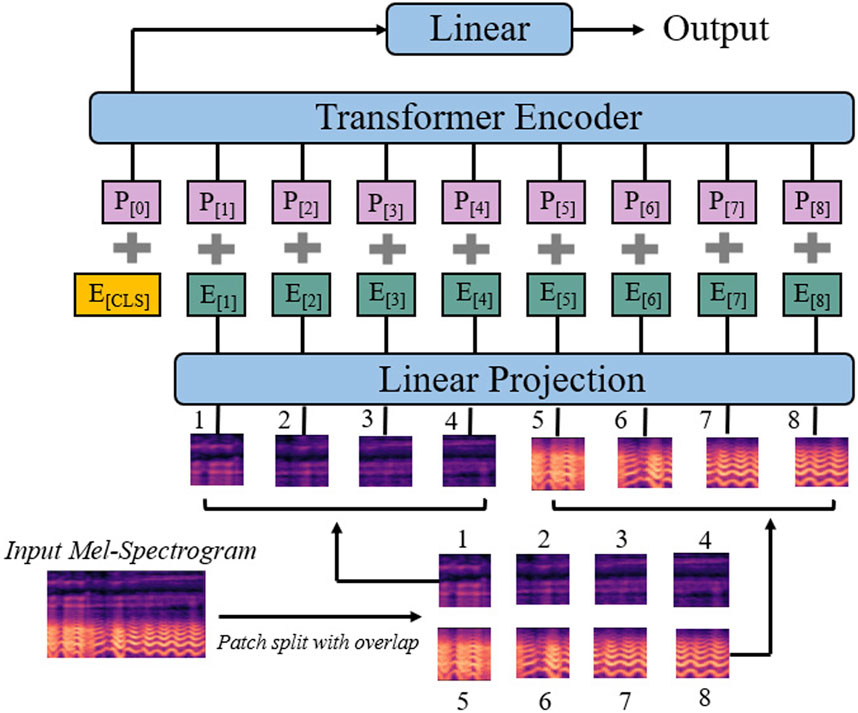
Figure 3. The architecture of the proposed Audio Mel-Spectrogram Transformer (AMST). The input Mel-Spectrogram is split into a sequence of 16 × 16 patches with overlaps, and then linearly projected to a sequence of 1D patch embeddings. Each patch embedding is augmented with a learnable po-sitional embedding. Finally, the output embedding is input into the Transformer Encoder to obtain the final output of the Linear layer.
The architecture of BERT-CNN is shown in Figure 4. The first step is to clean the text data, including the removal of meaningless words and the retention of words that contain actual meaning and information. The input text is then divided into words, which are tokenized and converted into tokens. Finally, the tokens are converted into a series of word vectors E1, E2 … En that can be understood by the machine through word embedding and input into the BERT-CNN model. The input of the above BERT-CNN model consists of token embedding, segment embedding and position embedding [36]. Adding these three embeddings together yields the word vectors E1, E2 … En with an E [cls] as the starting marker.
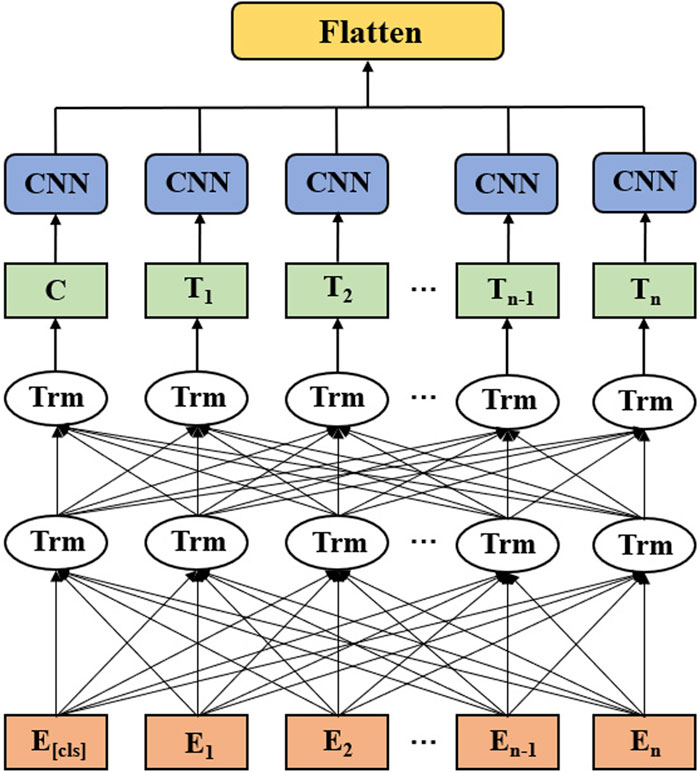
Figure 4. The architecture of the proposed BERT-CNN. The input layer consists of E[cls], E1, E2 … En, and 12 layers of Transformer encoder layers are applied in BERT. (Trm). The outputlayer consists of C, T1, T2 … Tn. The final output vector is obtained by a set of CNN layers and a Flatten layer.
The intermediate layer of the BERT-CNN consists of 12 Transformer encoders shown as Trm in Figure 4. After passing through the intermediate layer, a series of output vectors T1, T2 … Tn are obtained. These output vectors are transported to the CNNs in the next layer of the model. The final output is obtained through the Flatten layer.
To calculate the temporal weight impact of audio and text modality features on the classification results of final depression prediction, the LSTAFN module is proposed. Here, we model the temporal relationships of both speech at the frame level and text at the word level. Specifically, we represent the audio vector produced by AMST in the previous step as [x_1, … x_N], where N represents the dimensionality of the output audio vector.
For audio encoding, we apply the Bi-LSTM to model the sequential structure of audio frames in Eqs 2–4:
where
For the text side, we represent the text vector output by BERT-CNN as
Specifically, an attention weight between the
where u, v, w are trainable parameters.
The aligned audio feature
For the depression classification tasks, a maxpooling layer is applied over all hidden states in the sequence to get a fixed-length vector, followed by a fully connected layer with a rectified linear unit (ReLU) for non-linear transformation. The loss
where
In this section, the dataset used for experiments is introduced firstly in Section 4.1, followed by data processing in Section 4.2. In Section 4.3, we briefly describe the evaluation metrics. Finally, the details of the experimental setup are provided in Section 4.4.
The provided Distress Analysis Interview Corpus-Wizard of Oz (DAIC-WOZ) dataset is part of the large corpus DAIC [38], and includes transcripts, audio recordings, audio, and nonverbal features. It also contains depression scores of each participant based on the Eight-item Patient Health Questionnaire depression scale (PHQ-8), which was established as a valid diagnostic and severity measure for depressive disorders in large clinical studies [39]. The total score ranges from 0 to 24 points. According to the guidance of the Depression Classification Sub-Challenge (DCC), participants with a PHQ-8 score of 10 points and above are labeled as depressed.
The verbal cues are used for depression study in this paper, including the interview audio files and the transcripts of the interview. The audio files include the entire dialog between the avatar Ellie and each participant. In addition to recording the dialogue between Ellie and the participants, the transcripts also include the actions of the participants during the interview, such as sighing and laughing. The DAIC-WOC dataset includes a total of 189 sample data, which are divided into 107 training sets, 35 validation sets, and 47 test sets according to the official criteria [40]. Since the official labeling information of depression is not disclosed in the test sets, only 142 sample data from the training and validation sets were adopted in this study to ensure the accuracy and validity of the experimental results.
First, the adopted 142 audio samples were clipped. In the first step, the silent parts at the beginning and the end are removed. In the second step, since the original audio contains both the voice of the virtual interviewer and the voice of the subject, it is necessary to remove the voice of the interviewer and only keep the voice of the subject. Finally, each audio clip was cut into 50s segments and saved according to the length setting of 50s. The final experimental data includes 1,311 segments in the training set and 490 segments in the test set.
Secondly, the features of Spectrogram and Mel-Spectrogram for each audio clip are extracted, and the specific process is shown in Figure 5. In the first step, each audio clip is windowed and framed with 50% overlap. In the second step, the signal of each frame is transformed from the time domain to the frequency domain by the Fast Fourier Transform (FFT). The spectral energy is then calculated for each frame after FFT to get the corresponding power spectrum, namely spectrogram. The Mel-Spectrogram can be obtained by passing the spectrogram through the Mel filter bank.
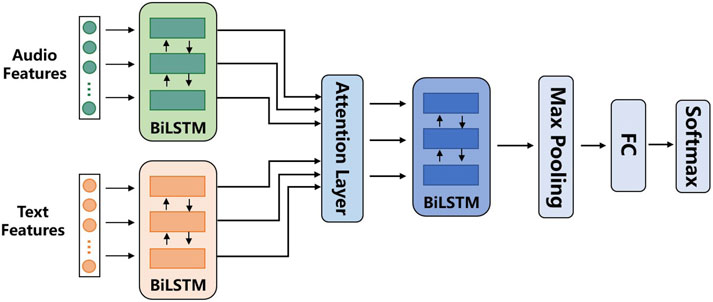
Figure 5. The structure of the LSTAFN.
The transcripts in the DAIC-WOZ dataset contain the text data of patients with depression. Each transcript file contains timestamped words spoken by the participant and the interviewer Ellie. For example, asking “What do you do to relax?,” participants may have more than one response (e.g., “I like reading books” and “um exercising is great”). In this study, only the text of the participants’ responses was used to detect depression.
In the data cleaning, words spoken by each participant are first concatenated into a text document, and then all the documents matching their corresponding class labels are assembled into a frame. The separated text data is preprocessed in token units using BertTokenizer provided by Python’s Transformer library, and the preprocessed data is used to fine-tune the pretrained BERT model. Finally, the fine-tuned BERT model is integrated with the CNN model to extract the context vector.
In order to evaluate the performance of depression detection, the proposed method is evaluated in terms of precision, recall and F1 score. They are defined by the following formulas, respectively in Eqs 18–20:
where
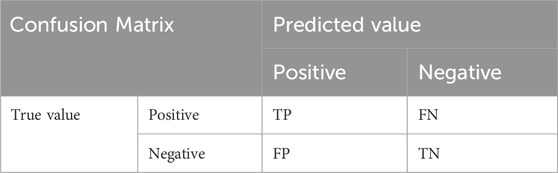
Table 1. The confusion matrix for classification results.
In this study, the ability to detect depression correctly is the focus of our attention. Therefore, the samples from patients with depression are set as positive, and the healthy control group is set as negative. The Accuracy indicates the number of correct samples in the total sample and measures the overall performance of the model. The precision represents the number of samples predicted to be depressed as a percentage of all true values. It measures the ability of the model to correctly detect depressed samples. Recall, also known as sensitivity, indicates how many depressed samples were correctly predicted, and it is a crucial metric in the depression detection task. The F1 score represents the harmonic mean of the precision and recall rates. It is also an indicator to measure the overall performance of the model.
In order to verify the effectiveness of our method, comparisons are made with the single-modal and dual-modal approaches in previous studies, respectively. Moreover, to verify the effectiveness of the proposed modules, ablation experiments are performed for validation.
Our experiments are conducted on a sample of 1801 groups, 1,311 of which are used for training and 490 for testing. We use Adam optimization with the learning rate of 0.001 for training. The batch size is set to 20, and the training epoch is 100. For the Transformer Encoder block, we set the head number of Multi-head attention to 8, the hidden dimension of the Feed-Forward layer to 2048, the dropout to 0.1, select Rectified Linear Unit (ReLU) as the activation and the number of the encoder layer to be 6. The proposed method is implemented on an Ubuntu server equipped with three GPUs (NVIDIA Titan XP) and the PyTorch is used to build the proposed network with CUDA10.2. The parameters of the network are initialized by default method in PyTorch.
In this section, the results of our experiments are presented and discussed. Firstly, a set of comparison experiments are performed to determine the input of the audio side. A set of ablation experiments are then performed to verify the effectiveness of each component. Then, the performance differences between the proposed audio-based AMST model and text-based BERT-CNN model are compared with other SOTA models in a single modal. The dual-modal fusion model with other fusion models are compared in the end.
In order to verify the effect of Spectrogram and Mel-Spectrogram on the model performance, the two audio feature spectra are compared. The results are shown in Table 2. From the results, Mel-Spectrogram achieves better performance in the three metrics of F1 score, recall and accuracy. In terms of precision, Spectrogram is slightly higher than Mel-Spectrogram by 0.05. In terms of recall performance, Mel-Spectrogram shows the most significant improvement, from 0.71 to 0.92. It indicates that Mel-Spectrogram feature map is sensitive to depressed patients, which is good for the screening application scenario of patients with depression. The possible reason for the advantage of Mel-Spectrogram is that it maintains the high level of detail in the sound. This is due to its computation by short-time Fourier transform (STFT) magnitude coefficients with the corresponding Mel filters, thus it can be regarded as a non-linear transformation of the spectrogram, preserving the high level details in the sound [5]. In subsequent experiments, Mel-Spectrogram is selected as the input of the network.
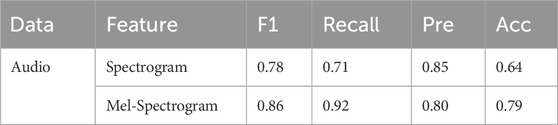
Table 2. Results for Spectrogram and Mel-Spectrogram.
To gain a good understanding of the interactions and importance of each proposed component in IntervoxNet, we conducted an ablation study. The results are shown in Table 3. The bidirectional long short-term memory network with attention fusion mechanism (Bi-LSTM + Att) is an advanced variant of the traditional Bi-LSTM model. It incorporates an attention mechanism to dynamically weigh the importance of different input features during the model’s processing of sequential data. To investigate whether the proposed Bi-LSTM with attention fusion mechanism (Bi-LSTM + Att) is effective, the decision-level fusion method is used for comparison.
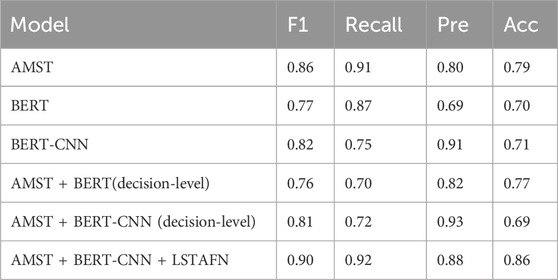
Table 3. Results for the ablation study.
Based on the experimental results in Table 3, in the comparison of single modality models, it can be observed that AMST outperforms BERT in all metrics, while BERT-CNN, as an improved version of BERT, exhibits superiority over BERT in three aspects, albeit with a significant decrease in recall. However, recall, representing the ability to avoid missing depression patients, is the metric of particular interest. AMST demonstrates significant superiority in this metric. Thus, text and audio models each demonstrate distinct advantages in depression detection performance. Integrating the strengths of both models should lead to performance enhancement. Based on the aforementioned experimental results, a fusion model is further compared.
Based on the performance comparison of last three rows of Table 3, namely AMST + BERT under decision-level fusion, AMST + BERT-CNN under decision-level fusion and AMST + BERT-CNN + LSTAFN, the last one, AMST + BERT-CNN, obtains the best performance in the three metrics except for the precision indicator. While, AMST + BERT-CNN (decision-level) achieves the best performance of 0.93 for the precision indicator, and the performance of the other three indicators is not significantly improved compared to the performance in the single modality. The possible reason is that under the decision-level fusion, the features of the audio and text sides cannot complement effectively, and there may be redundant information, which leads to the degradation of performance. With the LSTAFN, the F1 score achieves the highest score of 0.90, which means the overall performance is the best. This algorithm also performs very well in other metrics, especially the recall with a score of 0.92, and the accuracy achieves a score of 0.86, which far exceeds the performance of the other algorithms. From all the experimental results in Table 3, the dual-modal fusion results with the LSTAFN perform the best. This is in line with our initial expectation that the dual-modal algorithm outperforms the single modality algorithm because of the comprehensive information it acquires. However, simple fusion does not necessarily bring such advantages. Only when dual-modal information is effectively and complementary fused can it be possible to obtain advantageous results. For automatic detection of depression, by combining the variability of audio and text data features of depression patients, enhancing the model’s ability to learn different data information can be enhanced, thereby improving the accuracy of depression detection.
In this experiment, the performance of the proposed AMST module is compared with other methods based on the DAIC-WOZ dataset. From the comparison results shown in Table 4, it can be seen that the proposed AMST network achieves the highest F1 score, precision and accuracy among all the models, which are 0.86, 0.80, and 0.79, respectively. In terms of recall, the proposed AMST method achieves a high score of 0.92, second only to the model proposed by Ma et al. [24].
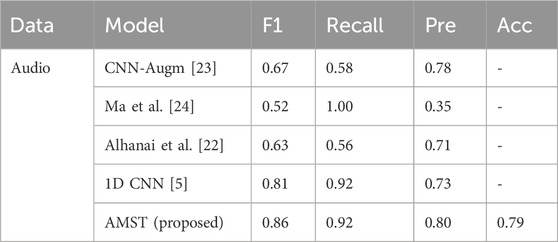
Table 4. Results for the single audio-based model on DAIC-WOZ dataset.
The above results show that the proposed AMST method can effectively capture the representation of depression patients from audio signals, thus improving the detection accuracy and examination efficiency of depression identification.
In the following experiments, the proposed BERT-CNN model is compared with other text only models, including some SOTA models and RNNs structure. In order to verify the effectiveness of the CNN module added at the backend of BERT for improving the performance of the text models, three groups of structures including RNN, LSTM, and GRU, were added to the backend of BERT for comparative experiments.
For the results shown in Table 5, we first focus on the performance of the F1 score and Acc score as they represent the overall performance of the model. The BERT-CNN network model proposed in this study achieves the highest F1 score of 0.82. It also outperforms several other models in terms of precision. The above results represent excellent overall performance. For the precision results, BERT-CNN achieves the highest score of 0.91. According to the description of the confusion matrix in Table 1 in Section 4.3, in this experiment, depression patients are set as Positive, and a higher precision result indicates that the model has a higher proportion of correct predictions for patients with depression. In terms of accuracy, it can be observed that the accuracy of BERT-CNN at 0.71 is superior to the vast majority of models, only slightly lower than Bi-LSTM. Finally, in terms of the recall, BERT-CNN achieves 0.75. Compared with most other methods, the performance of recall rate is not prominent. The reason may be that the features extracted in the feature extraction stage may not sufficiently capture the characteristics of depression, leading to the model’s inability to accurately distinguish depression patients from non-depression patients.
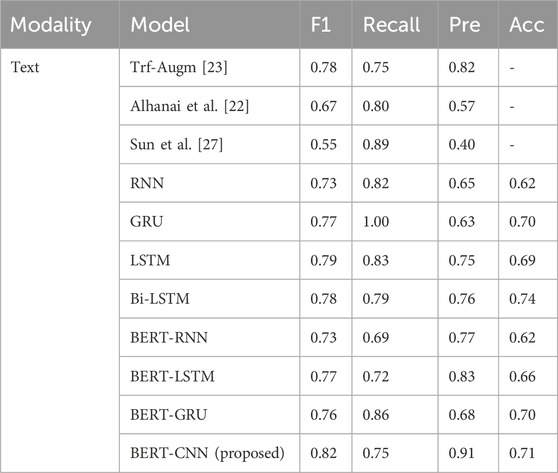
Table 5. Results for the single text-based model on DAIC-WOZ dataset.
After comparing the performance of single modality, the dual-modal fusion model of IntervoxNet is compared with other multi-model approach. From Table 5, it can be seen that the proposed IntervoxNet model achieves an F1 score of 0.90, which achieves the best performance compared with other models. In terms of recall, the performance of IntervoxNet proposed in Table 5 is not satisfactory. However, by combining the high recall of AMST (0.92), the recall of the fusion model also reaches 0.92. This further illustrates the complementary nature of the two modalities. At the same time, the proposed method achieves comprehensive advantages among all fusion model algorithms, only slightly lower than the results in [23] in terms of Precision.
After comparing the performance of single modality, the dual-modal fusion model of IntervoxNet is compared with other multi-model approach. From Table 6, it can be seen that the proposed IntervoxNet model achieves an F1 score of 0.90, which achieves the best performance compared with other models. In terms of recall, the performance of IntervoxNet proposed in Table 6 is not satisfactory. However, by combining the high recall of AMST (0.92), the recall of the fusion model also reaches 0.92. This further illustrates the complementary nature of the two modalities. At the same time, the proposed method achieves comprehensive advantages among all fusion model algorithms, only slightly lower than the results in [23] in terms of Precision.
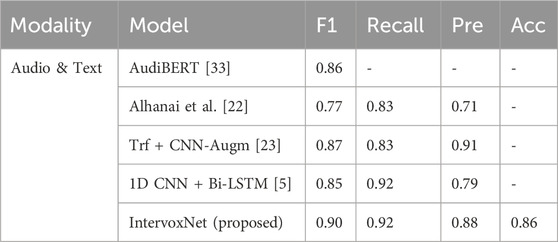
Table 6. Results for the dual-modal fusion on DAIC-WOZ dataset.
In this study, a Transformer based dual-modal depression detection network, IntervoxNet, is proposed. The audio and text features of the depressed are extracted by two modules, audio-based AMST and text-based BERT-CNN, respectively. Then, the audio and text features are aligned and fused by the LSTAFN. Finally, we have accomplished a binary classification task between depression patients and healthy controls. The proposed algorithm achieves an F1 score of 0.90 and a recall of 0.92 on the DAIC-WOZ dataset, which outperforms other similar studies. This indicates that our proposed IntervoxNet can fully leverage the complementary nature of these two modalities for this task, while also providing automated and objective diagnosis that complements the subjective assessments made by psychiatrists. It assists clinicians in making diagnoses and helps facilitate more convenient and timely detection and treatment for patients.
In future work, we will continue to explore other modal information of depressed patients, including facial keypoints and visual data that can be. Meanwhile, cooperation with hospitals can be considered to establish a Chinese depression analysis corpus to provide abundant samples for automatic depression detection, thereby improving the robustness of the model.
Publicly available datasets were analyzed in this study. This data can be found here: https://dcapswoz.ict.usc.edu/daic-woz-database-download/.
HD: Conceptualization, Data curation, Formal Analysis, Funding acquisition, Investigation, Methodology, Project administration, Software, Writing–original draft, Writing–review and editing. ZD: Conceptualization, Data curation, Formal Analysis, Funding acquisition, Investigation, Methodology, Project administration, Software, Writing–original draft, Writing–review and editing. ZWa: Methodology, Project administration, Resources, Validation, Visualization, Writing–review and editing. JX: Methodology, Project administration, Resources, Validation, Visualization, Writing–review and editing. ZWe: Project administration, Resources, Validation, Visualization, Writing–review and editing. KY: Project administration, Resources, Validation, Visualization, Writing–review and editing. SJ: Project administration, Resources, Validation, Visualization, Writing–review and editing. ZZ: Formal Analysis, Funding acquisition, Methodology, Project administration, Resources, Supervision, Validation, Visualization, Writing–review and editing. JW: Formal Analysis, Funding acquisition, Methodology, Project administration, Resources, Supervision, Validation, Visualization, Writing–review and editing.
The author(s) declare that financial support was received for the research, authorship, and/or publication of this article. This research was funded by the Shenzhen Soft Science Research Program Project (Grant No. RKX20220705152815035), the Shenzhen Science and Technology Research and Development Fund for Sustainable Development Project (No. KCXFZ20201221173613036), the Shenzhen Fund for Guangdong Provincial High-level Clinical Key Specialties (No. SZGSP013), the Medical Scientific Research Foundation of Guangdong Province of China (Grant No. B2023078), the Shenzhen University ENT Discipline Development Project sponsored by Shenzhen Huaqiang Holdings Co., Ltd. The funder was not involved in the study design, collection, analysis, interpretation of data, the writing of this article, or the decision to submit it for publication.
The authors declare that the research was conducted in the absence of any commercial or financial relationships that could be construed as a potential conflict of interest.
All claims expressed in this article are solely those of the authors and do not necessarily represent those of their affiliated organizations, or those of the publisher, the editors and the reviewers. Any product that may be evaluated in this article, or claim that may be made by its manufacturer, is not guaranteed or endorsed by the publisher.
1. Yang Y, Fairbairn C, Cohn JF. Detecting depression severity from vocal prosody. IEEE Trans Affective Comput (2013) 4(2):142–50. doi:10.1109/t-affc.2012.38
2. Organization WH. Depression and other common mental disorders: global health estimates. Geneva, Switzerland: World Health Organization (2017).
3. Allen NB, Hetrick SE, Simmons JG, Hickie IB. Early intervention for depressive disorders in young people: the opportunity and the (lack of) evidence. Med J Aust (2007) 187(S7):S15–7. doi:10.5694/j.1326-5377.2007.tb01329.x
4. Schumann I, Schneider A, Kantert C, Lowe B, Linde K. Physicians’ attitudes, diagnostic process and barriers regarding depression diagnosis in primary care: a systematic review of qualitative studies. Fam Pract (2011) 29(3):255–63. doi:10.1093/fampra/cmr092
5. Lin L, Chen X, Shen Y, Zhang L. Towards automatic depression detection: a BiLSTM/1D CNN-based model. Appl Sci (2020) 10(23):8701. doi:10.3390/app10238701
6. Oquab M, Bottou L, Laptev I, Sivic J. Learning and transferring mid-level image representations using convolutional neural networks In: Proceedings of the IEEE conference on computer vision and pattern recognition; June 23–28, 2014; Columbus, OH. IEEE (2014). p. 1717–24.
7. Zhang Y, Chan W, Jaitly N. Very deep convolutional networks for end-to-end speech recognition. 2017 IEEE international conference on acoustics, speech and signal processing (ICASSP). IEEE (2017). p. 4845–9.
8. He L, Cao C. Automated depression analysis using convolutional neural networks from speech. J Biomed Inform (2018) 83:103–11. doi:10.1016/j.jbi.2018.05.007
9. Yin S, Liang C, Ding H, Wang S. A multi-modal hierarchical recurrent neural network for depression detection. In: Proceedings of the 9th International on Audio/Visual Emotion Challenge and Workshop (2019). p. 65–71.
10. Amanat A, Rizwan M, Javed AR, Abdelhaq M, Alsaqour R, Pandya S, et al. Deep learning for depression detection from textual data. Electronics (2022) 11(5):676. doi:10.3390/electronics11050676
11. Rejaibi E, Komaty A, Meriaudeau F, Agrebi S, Othmani A. MFCC-based recurrent neural network for automatic clinical depression recognition and assessment from speech. Biomed Signal Process Control (2022) 71:103107. doi:10.1016/j.bspc.2021.103107
12. Qureshi SA, Saha S, Hasanuzzaman M, Dias G. Multitask representation learning for multimodal estimation of depression level. IEEE Intell Syst (2019) 34(5):45–52. doi:10.1109/mis.2019.2925204
13. Brousmiche M, Rouat J, Dupont S. Multimodal attentive fusion network for audio-visual event recognition. Inf Fusion (2022) 85:52–9. doi:10.1016/j.inffus.2022.03.001
14. Luong M-T, Pham H, Manning CD. Effective approaches to attention-based neural machine translation. arXiv preprint arXiv:150804025 (2015).
15. Vaswani A, Shazeer N, Parmar N, Uszkoreit J, Jones L, Gomez AN, et al. Attention is all you need. Adv Neural Inf Process Syst (2017) 30. doi:10.48550/ARXIV.1706.03762
16. Park J, Moon N. Design and implementation of attention depression detection model based on multimodal analysis. Sustainability (2022) 14(6):3569. doi:10.3390/su14063569
17. Liu G, Guo J. Bidirectional LSTM with attention mechanism and convolutional layer for text classification. Neurocomputing (2019) 337:325–38. doi:10.1016/j.neucom.2019.01.078
18. Sun H, Liu J, Chai S, Qiu Z, Lin L, Huang X, et al. Multi-modal adaptive fusion transformer network for the estimation of depression level. Sensors (2021) 21(14):4764. doi:10.3390/s21144764
19. Cummins N, Scherer S, Krajewski J, Schnieder S, Epps J, Quatieri TF. A review of depression and suicide risk assessment using speech analysis. Speech Commun (2015) 71:10–49. doi:10.1016/j.specom.2015.03.004
20. Esposito A, Raimo G, Maldonato M, Vogel C, Conson M, Cordasco G. Behavioral sentiment analysis of depressive states. In: 2020 11th IEEE International Conference on Cognitive Infocommunications (CogInfoCom); September 23–25, 2020; Mariehamn, Finland. IEEE (2020). 000209–214.
21. AlSagri H, Ykhlef M. Quantifying feature importance for detecting depression using random forest. Int J Adv Comput Sci Appl (2020) 11(5). doi:10.14569/ijacsa.2020.0110577
22. Ma X, Yang H, Chen Q, Huang D, Wang Y. Depaudionet: an efficient deep model for audio based depression classification. In: Proceedings of the 6th international workshop on audio/visual emotion challenge (2016). p. 35–42.
23. Lam G, Dongyan H, Lin W. Context-aware deep learning for multi-modal depression detection. In: ICASSP 2019-2019 IEEE international conference on acoustics, speech and signal processing (ICASSP); May 12–17, 2019; Brighton, United Kingdom. IEEE (2019). p. 3946–50.
24. Vázquez-Romero A, Gallardo-Antolín A. Automatic detection of depression in speech using ensemble convolutional neural networks. Entropy (2020) 22(6):688. doi:10.3390/e22060688
25. Dinkel H, Wu M, Yu K. Text-based depression detection on sparse data. arXiv preprint arXiv:190405154. (2019).
26. Zhang X, Shen J, Din Z, Liu J, Wang G, Hu B. Multimodal depression detection: fusion of electroencephalography and paralinguistic behaviors using a novel strategy for classifier ensemble. IEEE J Biomed Health Inform (2019) 23(6):2265–75. doi:10.1109/jbhi.2019.2938247
27. Thati RP, Dhadwal AS, Kumar P, P S. A novel multi-modal depression detection approach based on mobile crowd sensing and task-based mechanisms. Multimedia Tools Appl (2023) 82(4):4787–820. doi:10.1007/s11042-022-12315-2
28. He L, Niu M, Tiwari P, Marttinen P, Su R, Jiang J, et al. Deep learning for depression recognition with audiovisual cues: a review. Inf Fusion (2022) 80:56–86. doi:10.1016/j.inffus.2021.10.012
29. Joshi J, Goecke R, Alghowinem S, Dhall A, Wagner M, Epps J, et al. Multimodal assistive technologies for depression diagnosis and monitoring. J Multimodal User Inter (2013) 7(3):217–28. doi:10.1007/s12193-013-0123-2
30. Yang L, Jiang D, Sahli H. Integrating deep and shallow models for multi-modal depression analysis—hybrid architectures. IEEE Trans Affective Comput (2021) 12(1):239–53. doi:10.1109/taffc.2018.2870398
31. Toto E, Tlachac ML, Rundensteiner EA. AudiBERT. In: Proceedings of the 30th ACM International Conference on Information & Knowledge Management (2021). p. 4145–54.
32. Gong Y, Chung Y-A, Glass J. Ast: audio spectrogram transformer. arXiv preprint arXiv:210401778. (2021).
33. Devlin J, Chang M-W, Lee K, Toutanova K. Bert: pre-training of deep bidirectional transformers for language understanding. arXiv preprint arXiv:181004805. (2018).
34. Zhao Y, Zhang J, Zong C. Transformer: a general framework from machine translation to others. Machine Intelligence Res (2023) 20(4):514–38. doi:10.1007/s11633-022-1393-5
35. Zhang H, Song H, Li S, Zhou M, Song D. A survey of controllable text generation using transformer-based pre-trained language models. ACM Comput Surv (2023) 56(3):1–37. doi:10.1145/3617680
36. Souza FD, Filho JBOS. Embedding generation for text classification of Brazilian Portuguese user reviews: from bag-of-words to transformers. Neural Comput Appl (2023) 35(13):9393–406. doi:10.1007/s00521-022-08068-6
37. Kalyan K, Rajasekharan A, Sangeetha S. A survey of transformer-based pretrained models in Natural Language Processing. Available from: https://doi.org/1048550/arXiv.2021;2108.
38. Kroenke K, Strine TW, Spitzer RL, Williams JBW, Berry JT, Mokdad AH. The PHQ-8 as a measure of current depression in the general population. J Affective Disord (2009) 114(1-3):163–73. doi:10.1016/j.jad.2008.06.026
39. Ringeval F, Schuller B, Valstar M, Cowie R, Kaya H, Schmitt M, et al. AVEC 2018 workshop and challenge. In: Proceedings of the 2018 on Audio/Visual Emotion Challenge and Workshop (2018). p. 3–13.
Keywords: dual-modal fusion, depression detection, Transformer, classification, deep learning, attention mechanism
Citation: Ding H, Du Z, Wang Z, Xue J, Wei Z, Yang K, Jin S, Zhang Z and Wang J (2024) IntervoxNet: a novel dual-modal audio-text fusion network for automatic and efficient depression detection from interviews. Front. Phys. 12:1430035. doi: 10.3389/fphy.2024.1430035
Received: 09 May 2024; Accepted: 17 June 2024;
Published: 12 July 2024.
Edited by:
Wenjian Qin, Chinese Academy of Sciences (CAS), ChinaReviewed by:
Ying Qin, Beijing Jiaotong University, ChinaCopyright © 2024 Ding, Du, Wang, Xue, Wei, Yang, Jin, Zhang and Wang. This is an open-access article distributed under the terms of the Creative Commons Attribution License (CC BY). The use, distribution or reproduction in other forums is permitted, provided the original author(s) and the copyright owner(s) are credited and that the original publication in this journal is cited, in accordance with accepted academic practice. No use, distribution or reproduction is permitted which does not comply with these terms.
*Correspondence: Zhiguo Zhang, emhpZ3VvemhhbmdAaGl0LmVkdS5jbg==; Jianhong Wang, d2FuZ2ppYW5ob25nMDc1NUAxNjMuY29t
Disclaimer: All claims expressed in this article are solely those of the authors and do not necessarily represent those of their affiliated organizations, or those of the publisher, the editors and the reviewers. Any product that may be evaluated in this article or claim that may be made by its manufacturer is not guaranteed or endorsed by the publisher.
Research integrity at Frontiers
Learn more about the work of our research integrity team to safeguard the quality of each article we publish.