 Josh Kneller
 Saeed Salimian Rizi
 Liam Flannigan
- Department of Engineering Physics, McMaster University, Hamilton, ON, Canada
In this paper, we report a new model for passively Q-switched intracavity optical parametric oscillators (IC-OPOs), using Cr:YAG as a Q-switch crystal. The model considers the effects of thermalization in the Nd:YAG laser crystal, excited state absorption in the Cr:YAG saturable absorber, nonlinear loss due to pump depletion in the nonlinear crystal, the thermal lens effect and the mode overlap of the fields within the nonlinear crystal. The calculated pulse width for the 1,064 nm pump light was 6.2 ns compared to the experimental result of 6 ns, while the signal wave was calculated to have a pulse width of 1.75 ns compared to the experimental result of 2 ns. The model is shown to accurately calculate both the temporal and output power characteristics of the IC-OPO, which has not been previously reported to the best of our knowledge.
1 Introduction
Passively Q-switched intracavity optical parametric oscillators (IC-OPOs) are an attractive method for achieving mid-infrared (mid-IR) emission due to their low cost, broadly tunable wavelength range, low threshold due to the intracavity structure and ability to achieve high output power [1–5]. Passively Q-switched lasers based on Nd:YAG as a laser crystal and Cr:YAG as a saturable absorber are well reported within literature [6,7]. In addition, the use of an optical nonlinear crystal such as periodically poled lithium niobate (PPLN) with the previously mentioned materials is a common way to achieve a passively Q-switched IC-OPOs.
The ability to accurately model both the power and temporal characteristics of IC-OPOs is of great importance to be able to rapidly prototype designs and ensure the output parameters are suitable for practical applications. Due to the nonlinear conversion efficiency increasing as the input pump intensity increases, it is often desirable to operate the pump laser with the highest intensity possible, which is accomplished by decreasing the initial transmission of the Cr:YAG crystal [6,7]. This has the combined effect of increasing the pulse energy while decreasing the pulse width, leading to substantial increases in the maximum achievable power. However, as the pulse widths reach the order of ns and sub ns, theoretical results for the temporal characteristics begin to deviate from experimental results [6,8,18]. The ability to accurately predict the peak output power is necessary to not only ensure the laser will meet the performance requirements but also to ensure the intensity does not exceed the damage threshold of the nonlinear crystal. To fully optimize the performance of the device, it is necessary to operate the IC-OPO as close to the damage threshold as possible which requires a model that can accurately calculate the peak intensity.
Currently, there exist many models for passively Q-switched IC-OPOs. However, none of them are able to accurately calculate the pulse width, resulting in inaccurate calculations of the peak intensity [1,4,18]. This is due to the developed models not considering the effects of the thermalization in the Nd:YAG crystal, which becomes important as pulse widths reach ns and sub ns levels. Currently, there exists no model for an passively Q-switched IC-OPO which considers both the effects of thermalization in the Nd:YAG laser crystal and the exited state absorption in the Cr:YAG saturable absorber.
In this paper we report a new model for a passively Q-switched IC-OPO which accounts for both the effects of thermalization in the Nd:YAG laser crystal, excited state absorption in the Cr:YAG saturable absorber, model overlap within the PPLN nonlinear crystal, and the thermal lens effect in the Nd:YAG laser crystal. We use this model to accurately calculate the output characteristics for both a pulsed 1,064 nm laser and a passively Q-switched IC-OPO. We show that the model is able to accurately reproduce both the output powers of pump, signal and idler, as well as accurately model the pulse width and shape of the different beams.
2 Theory and methods
2.1 Theoretical model
The equations for a continuously pumped Q-switched laser, accounting for thermalization rates in the upper and lower laser level, are given by:
where ϕ is the intracavity photon density, tr is the round trip transit time, σe is the stimulated emission cross section of the laser crystal, na is the population of the lasing stark level of the upper laser level, nb is the population of the lower laser stark level, lg is the length of the gain medium, σ13 is the absorption cross section of Cr:YAG, ns1 is the population density of the first excited state in Cr:YAG, lcr is the length of the Cr:YAG crystal, σ24 is the absorption cross section of the excited state of Cr:YAG, ns is the total population density of the Cr:YAG, L is the residual optical loses in the cavity, R is the mirror loss, WP is the pumping rate to the upper laser level, fa is the ratio of the population density of the upper stark level and the remaining stark levels, nu is the population density of the remaining stark levels, τtherm is the thermalization time for the upper and lower laser stark levels, τa is the lifetime of the upper laser level, c is the speed of light, fb is the ratio of the lower laser stark level and the remaining stark levels in the lower laser level, nl is the population density of the lower laser level, τb is the lifetime of the lower laser level, τsa is the lifetime of the Cr:YAG excited state. The variables and their value are summarized in Table 1 at the end of the manuscript, with references provided where applicable.
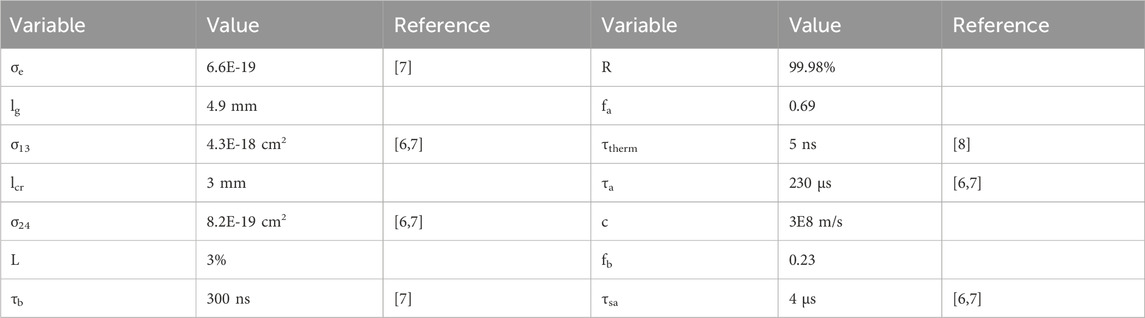
Table 1. Values of constants used in the rate equations.
Equations similar to Eqs 1–4 presented above have been well reported in literature and have been successfully used to accurately predict the output power of passively Q-switched lasers based on Cr:YAG [6,7]. However, when calculating the temporal characteristics of the laser pulse, the models fail and return pulse values much shorter than what is experimentally measured when the duration of the pulse is comparable to the thermalization time [8]. To account for this issue, the equations have been modified to include the thermalization effects. This requires the inclusion of two additional equations (Eqs 5, 6) to model the population densities of the remaining stark levels in the upper and lower laser level [8].
When the pulse duration is long as compared to the thermalization time, the standard values for fa and fb can be used (i.e., the population fraction at thermal equilibrium of the upper and lower laser stark level, respectively). However, when the pulse duration becomes comparable to the thermalization time, the equilibrium occupation factors can no longer be used. To understand how the inclusion of thermalization rates in the upper and lower laser level affect the performance of the Q-switched laser, let us consider a laser operating during the pulse phase. When the population inversion reaches sufficient levels, the intracavity photon density beings to rapidly grow. This results in an increase in the population density of the lower laser stark level due to stimulated emission events. Generally, when not considering the thermalization rates, it is assumed that the occupation of the lower laser stark level will be roughly equal to the Boltzmann occupation factor. This assumption requires that the thermalization time is short as compared to the pulse length. If the pulse length is comparable to the thermalization time this assumption becomes invalid. If we look at Eq. 3, we can see that by including a term for the thermalization rate, this creates a bottleneck and causes a buildup of the population of the lower laser stark value much larger than the Boltzmann occupation factor when the pulse length is short. This results in a substantial reduction in the population inversion density which lowers the rate of stimulated emission. The reduced stimulated emission results in a lower photon density, reducing the rate at which energy can be extracted from the laser crystal. Since the total population densities of the upper and lower laser level remain the same, only the distribution of the population within the stark levels is changed, the total energy able to be extracted remains unchanged. The result is that the pulse width of the laser is increased, resulting in a decreased peak power.
At low to moderate pumping levels, the time between pulses is long compared to the thermalization time allowing for the use of previously reported equations to calculate the pulse repetition rate [7]:
where f is the repetition rate, and Wth is the threshold pumping rate. β is defined as [7]:
where γ is the inversion reduction factor, nf is the population density of the upper laser level after the laser pulse and ni is the population density of the upper laser level when the pulse begins.
Modeling a pulsed optical parametric oscillator requires solving the coupled wave equations in both time and space. The time and spatially dependent coupled wave equations are given by:
where As, Ai and Ap are the slowly varying signal, idler and pump amplitudes, respectively. P(z) is a periodic function which models the poling in the PPLN, taking a value of ±1 depending on if the region has a positive or negative nonlinear coefficient. Δk is the momentum mismatch given by Δk = kp - ks + ki. αs, αi, αp are the material loss values for PPLN at the signal, idler and pump wavelengths, respectively. The substitution
where dPPLN is the second order nonlinear coefficient d33 of PPLN, c is the vacuum speed of light, ω is the angular frequency of the respective wave and n is the refractive index of the respective wave in PPLN. Within the coupled wave equations, an additional term, β was added, which is used to account for the overlap between the relevant waves in each of the equations. The value of β ranges from 0 to 1 depending on the overlap of the two fields, with β = 1 representing perfect overlap and β = 0 representing no overlap. The overlap of two fields can be evaluated as:
where Ei is the spatial distribution of the idler electric field and Es is the spatial distribution of the signal electric field. Calculation of the overlap parameter requires knowledge of the special distribution of the fields within the nonlinear crystal. To accomplish this an ABCD matrix method was used to model the intensity distributions of the three fields within the laser cavity.
Due to the placement of the nonlinear crystal within the laser cavity, the effect of the nonlinear conversion process on the intracavity photon pump density must be considered. In order to do this, the rate equations (Eqs 1–6) must be coupled with the nonlinear wave equations (Eqs 9–12). The first step in coupling the two sets of equations together is to use the intracavity power determined by the photon density from Eq. 1 as the input to the pump wave in the coupled nonlinear equations. The unidirectional intracavity power result from a photon density φ can be calculated as:
where h is Plancks constant, νp is the pump wave frequency, rp is the radius of the pump beam in the laser crystal, and navg is the average refractive index of the laser cavity at the pump wavelength.
To model the loss in photon density due to the nonlinear conversion process, an additional term must be added to Eq. 1. Modifying Eq. 1 to include this term gives:
where ϕNL is the photon density lost due to the nonlinear conversion process. Determining ϕNL can be done by considering the underlying physics of the nonlinear conversion process. For every generated signal and idler photon, there must be a pump photon removed due to the conservation of energy. From this, it is clear that an increase in either the signal or idler photon count due to the nonlinear process must result in an equal and opposite change in the pump photon count. From this, the photon density change can be calculated by considering the mode area of the pump beam in the nonlinear crystal. This can be calculated as:
where Pi is the change in idler power within the nonlinear crystal, νi is the idler frequency, rNL is the radius of the pump beam within the nonlinear crystal.
2.2 Numerical method
A 5th order Runge Kutta method was used to solve the system of ODEs (ordinary differential equations) for the pulsed laser [9]. The time between pulses was solved with an adaptive error method to allow for the largest possible step size to be used until the photon density (Eq. 1) began to increase. Once the photon density began to increase a constant step size was used to ensure that the numerical method used to solve the coupled nonlinear equations remained stable. During the time between pulses, the intracavity power was assumed to be 0 and hence there was no input to the coupled wave equations. This eliminated the need to solve them during the time between pulses, which greatly reduced the computation time.
To solve the coupled wave equations, a lax-wendroff method was used [10]. The intracavity operation results in the confinement of both the signal and pump beam, resulting in both waves travelling in the forwards and backwards direction. To account for this, each field was divided into two components, a forwards and backwards component, and handled separately [11]. By the conservation of energy, a forward and backwards travelling idler wave must also be generated, although both idler waves are assumed to be perfectly coupled out of the cavity. Due to the conservation of momentum from the phase matching conditions, the forwards travelling waves do not interact with the backwards travelling waves and vice versa. The boundary conditions for each wave were calculated using polynomial interpolation [12].
2.3 Experimental setup
Figure 1A shows the experimental setup used to test the 1,064 nm pulsed laser. An 808 nm fiber laser diode (Aerodiode 808LD-2-0-0) was used to pump an Nd:YAG crystal. The light from the fiber was focused into the Nd:YAG crystal to a radius of 120 μm. The input facet of the Nd:YAG crystal was antireflection (AR) coated at 808 nm and high reflection coated (HR) at 1,064 nm. The output facet of the Nd:YAG crystal was AR coated at 1,064 nm. The Nd:YAG crystal had a length of 4.9 mm. A [110] Cr:YAG crystal with T0 = 60% was used as the Q-switch crystal. The [110] orientation was used to polarize the output from the Nd:YAG crystal, which is normally unpolarized [13]. The output coupler was a curved mirror with a 100 mm radius and was HR coated at 1,064 nm (R = 99.98%). The total cavity length was 53 mm.

Figure 1. (A) Setup for 1,064 nm pulsed laser. (B) Setup for passively Q-switched IC-OPO.
Figure 1B shows the experimental setup for the passively Q-switched IC-OPO. The structure is similar to the setup presented in Figure 1A, the difference being the addition of a dichroic mirror (M1) after the Cr:YAG crystal and a PPLN crystal. The dichroic mirror had high transmission at 1,064 nm and was HR coated at the signal wavelength (1,550 nm). Both faces of the PPLN crystal were AR coated at the pump, signal and idler wavelength. The length of the PPLN crystal was 14.7 mm. The nonlinear coefficient of PPLN for second harmonic generation at 1,064 nm is reported as 25.3 p.m./V [14]. Millers rule was used to calculate the appropriate nonlinear coefficient, which was found to be 20.7 p.m./V [15]. The OC used was the same as in Figure 1A, having a partial reflection at the signal wavelength (R = 15%) and a high transmission at the idler wavelength (3,394 nm) (R < 1%). The total cavity length was 53 mm.
3 Results and discussion
3.1 Passively Q-switched 1,064 nm laser
To validate the proposed rate equations, the laser setup described in Figure 1A was investigated initially. Figure 2 shows the theoretically calculated repetition rate as compared to the experimentally measured repetition rate as a function of input laser diode power. The simulation parameters used are provided in Table 1. The theoretical repetition rate was calculated by solving the rate equations for two full pulses and then calculating the time between the two pulses. As expected, the theoretical repetition rate increases linearly with increasing input power, indicating inclusion of the thermalization rate does not affect the relationship between input power and the repetition rate. The linear relationship between the input power and repetition rate is in agreement with previously reported experimental and theoretical results [6,7]. Our experimental results exhibit a minor deviation from the expected linear increase with pump power, which is likely due to thermal instability. Above input powers of 4.5 W, the temperature of the laser diode and Nd:YAG crystal began to increase, which resulted in reduced absorption efficiency of the pump light by the Nd:YAG crystal.
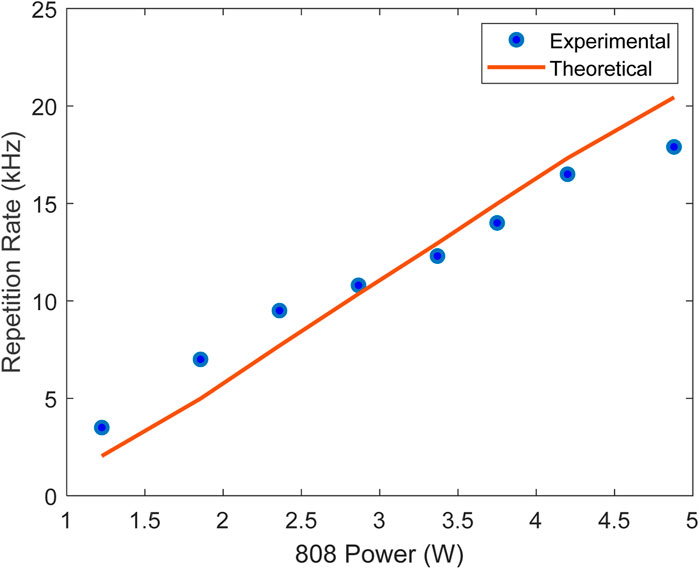
Figure 2. Repetition rate of the passively Q-switched 1,064 nm laser.
As previously stated, the inclusion of the thermalization terms in the rate equations should not affect the calculated repetition rate due to the thermalization time being significantly less than the time between pulses. This was confirmed by calculating the repetition rate using Eq. 7, which was found to be in agreement with the results obtained from solving the rate equations. Additionally, the recovery time of the Cr:YAG crystal is in an order of microseconds, which would prevent the time between pulses approaching the thermalization time [7].
Figure 3 shows the measured pulse profile of the 1,064 nm laser as compared to the theoretical calculated from the proposed model. A thermalization time of 5 ns was found to produce the best results, which is in agreement with previously reported results for the thermalization time in Nd:YAG of 3–5 ns [8]. As shown in Figure 3, the model accurately predicts the asymmetric pulse shape, as well as correctly models the rise and fall time of the pulse. The theoretically calculated pulse width was 6.2 ns which is in good agreement with the experimentally measured pulse width of 6 ns.
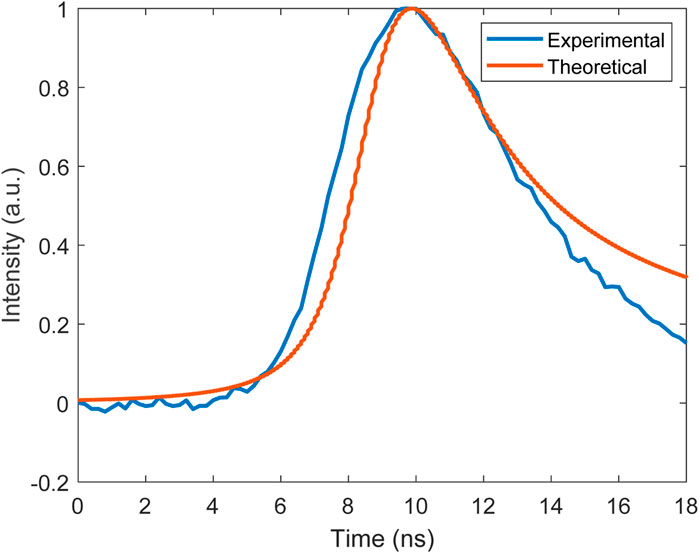
Figure 3. Pulse shape of the 1,064 nm Q-switched laser.
It is worth noting that the experimental results cannot be explained by the previously reported models, where the calculated pulse width is generally much shorter than the experimental pulse width [6,7]. Without considering the effects of thermalization, the simulated pulse width was approximately 3 ns, half of what was experimentally measured. Additionally, when the effects of thermalization are not considered a symmetric pulse profile is returned, consistent with the pulse shape using previously reported models [6].
It is also worth mentioning that the presented model predicts average power of the passively Q-switched IC-OPO. Due to the high reflectivity of the OC at 1,064 nm used in our experiments, the average output was only able to be measured at high input powers. At an input power of 4.2 W, the average power was measured to be 800 μW, which is in good agreement with the model prediction of 820 uW. To the best of our knowledge, for the first time, the modal presented in this paper enables us to predict precisely both the pulse properties (pulse shape and pulse width) and output power of the passively Q-switched IC-OPO.
3.2 Passively Q-switched IC-OPO
The laser structure in Figure 1B was used to validate the model for a passively Q-switched IC-OPO, focusing on signal and idler pulses. The pulse repetition rate and pulse profile of the signal wave were calculated with the model and compared to experimental results. Due to equipment limitations, we were only able to measure the pulse shape of the signal wave and not the idler. The repetition rate of the IC-OPO was found to be the same as the previous laser structure which is expected as the loss due to the insertion of the PPLN into the cavity is much smaller than the loss due to the Cr:YAG crystal. Figure 4 shows the experimentally measured pulse shape of the signal as compared to the theoretical pulse shape predicted by the model. In the study, pump, signal and idler wavelength were 1,064 nm, 1,548 nm, and 3,400 nm, respectively. The material loss values at the pump, signal and idler wavelength were 0.0035 cm−1, 0.0035 cm−1, and 0.008 cm−1, respectively [16]. The model predicts the pulse shape with reasonable accuracy. The measured pulse width was 2 ns, as compared to the theoretical pulse width of 1.75 ns. It is worth noting that when the effects of thermalization were not considered, the signal pulse width was approximately 1 ns. This is consistent with the results for the 1,064 nm pulsed laser, where removing the thermalization effects resulted in a reduced pulse width.
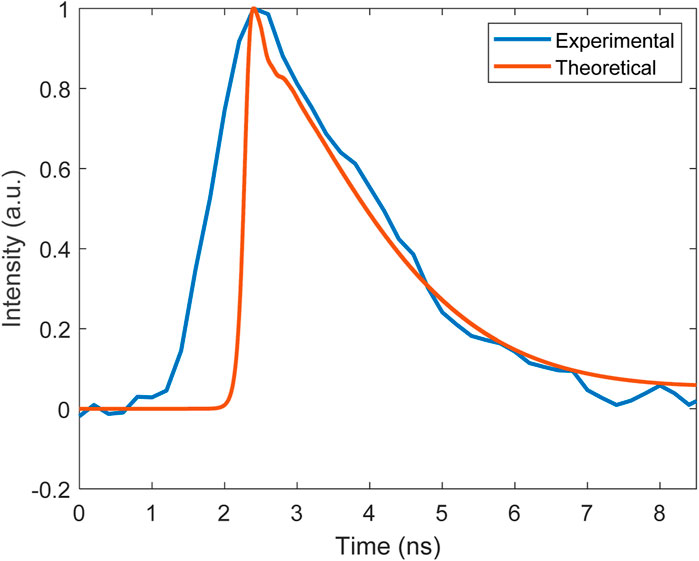
Figure 4. Pulse shape of the signal from the IC-OPO.
As shown in Figure 4, the experimental rise time of the signal pulse was much longer than the theoretical pulse, while the falling edge of the pulse was almost identical to the experimentally measured pulse. This discrepancy between the measured results and theoretical results is likely due to either an incorrect pump beam size in the PPLN being used or errors in the poling of the PPLN reducing the effective nonlinear coefficient which was not considered in the model. If the 1,064 nm beam waist in the PPLN used in the simulation was less than the actual value, it will result in the 1,064 nm field intensity in the PPLN being higher in the simulation than in the actual laser. As a result, the conversion efficiency of the nonlinear process will increase which would result in a quicker pulse buildup, as seen in Figure 4. Errors in the PPLN poling could also be responsible for the discrepancy as this would result in a reduced conversion efficiency in the experiment, leading to a longer pulse buildup time in the experimental case.
The rapid increase in the signal intensity is consistent with previously reported results for Q-switched IC-OPOs [2,17], although the OC reflectivity at the signal wavelength was much larger than in our setup. The lack of a rapid rise in the signal pulse in our experimental results is likely due to limitations of the time resolution of the oscilloscope used in our experiments. Therefore, it is likely that the minor discrepancy between the theoretical and experimental results (both the pulse width and the rise time) is due to the oscilloscope used.
In addition to the consideration of the thermalization effects, our model for signal and idler pulses also considers the spatial intensity variation of the pump, signal and idler within the nonlinear crystal. If the spatial variation in the pump wave within the nonlinear crystal is not considered, which arises due to pump depletion from the nonlinear conversion process with a high efficiency, the calculated conversion efficiency will likely be overestimated [17]. From Eq. 15, we can see that the increased nonlinear loss term would cause the cavity photon density to decrease faster which in turn would produce a shorter pulse; consistent with what the authors observed from their model. We tested this conclusion with our own model by multiplying Eq. 16 by a constant, with a value greater than 1, and found that it did result in a decreased pulse width as expected. The pulse width decreasing as the nonlinear conversion efficiency increases is consistent with previously reported results where only the time dependence of the three fields in the cavity was considered [17].
The measured average output power of the signal as compared to the theoretically predicted value is presented in Figure 5. As shown in Figure 5, the theoretical results match the linear trend observed in the experimental results and accurately predict the average power values. The deviation in the experimental results from the theoretical ones is likely due to thermal instability resulting in an inconsistent repetition rate. Another discrepancy can be caused by the uncertainty in the laser mode size in the Nd:YAG crystal. Since the mode size determined by the cavity geometry, calculated with an ABCD matrix, is larger than the beam waist of the 808 nm pump laser, the laser mode size will be determined by the 808 nm beam radius. However, as discussed in-depth previously by other authors [18], lasing is not able to be achieved over the entire area illuminated by the 808 nm laser beam. Instead, an effective area must be used. Using the same method [18], we estimate the effective beam area of the 808 nm laser to be roughly 70% of the actual 808 nm beam area. We set the area of the 1,064 nm laser mode in the Nd:YAG crystal to be equal to the effective area of the 808 nm laser diode. As a result, it is difficult to determine the exact 1,064 nm spot size, and hence the pulse energy.
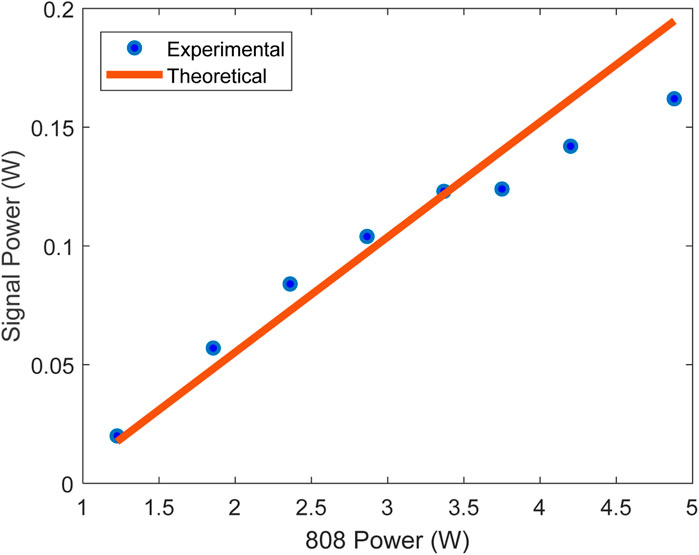
Figure 5. Average output power from the IC-OPO at the signal wavelength.
Although the theoretical results show the expected linear trend, the theoretically simulated curve is not smooth as is generally expected. This is due to the inclusion of the thermal lens in the Nd:YAG crystal. As the input power changes, the value of the thermal lens changes, which results in a small change in the pump radius within the PPLN. The change in pump radius results in a change in the conversion efficiency of the nonlinear interaction, causing the pulse energy of the signal to change. Since the repetition rate does not change, this results in slight deviation from the expected linear curve.
To investigate the mid-IR idler wave generated from the IC-OPO, the calculated idler power as compared to the measured idler power is shown in Figure 6. A germanium filter was placed between the OC and power meter and was used to filter all wavelengths besides the idler wavelength. An initial linear growth in both the theoretical and experimental results is seen, until the output rate beings to decrease. This is likely due to temperature instability in the Nd:YAG crystal and pump fiber laser, which results in a reduced pulse repetition rate due to the 808 nm LD pump depletion. Another reason for this is the changing of the pump beam waist due to a change in the thermal lens focal length in the Nd:YAG crystal. Increasing the input power from the 808 nm laser will decrease the focal length of the thermal lens, changing the pump beam radius in the PPLN crystal.
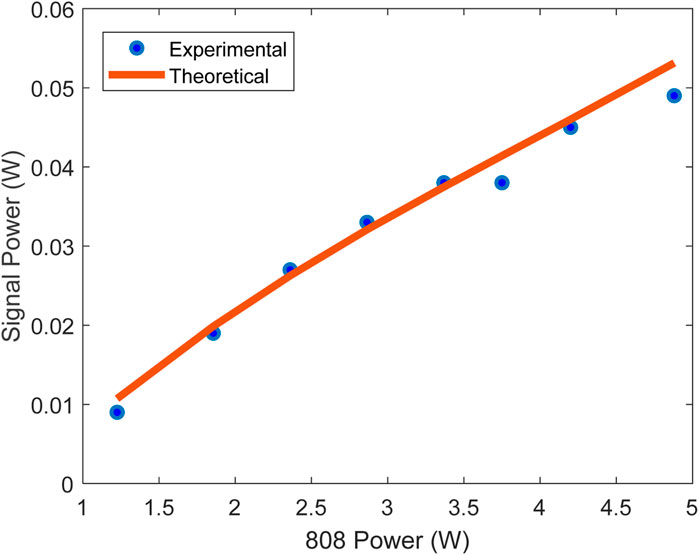
Figure 6. Average output power form the IC-OPO at the idler wavelength.
We also measured the profile and divergence angle of the pump and signal beams. Figures 7A, B show the measured beam profile of the pump and signal beams, respectively, 18 cm after the OC. The radius of the pump and signal at the point of measurement were 1.1 mm and 2.4 mm, respectively. The divergence angle of the pump and signal beams were measured to be 3.7 and 11 mrad, respectively. Using these values, we can estimate the beam waist of the pump and signal at the OC to be 0.43 mm and 0.42 mm, respectively. Both values are in good agreement with the calculated values from the ABCD matrix method which was used. Additionally, both fields have a gaussian intensity distribution which was assumed when using the overlap integral and is required for the ABCD matrix method to be valid. We also measured the wavelength of the signal beam and found it to be 1,553 nm, which results in an idler wavelength of 3,379 nm.
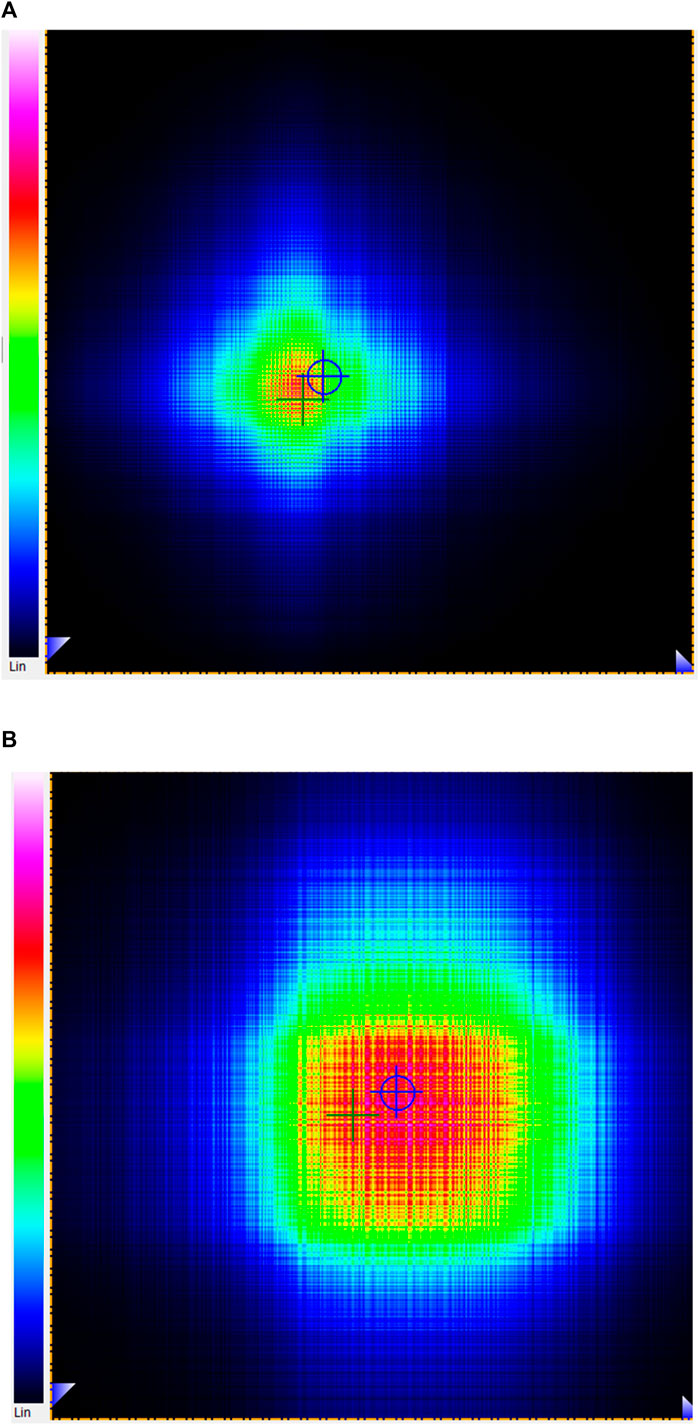
Figure 7. (A) Profile of the pump beam. (B) Profile of the signal beam.
4 Conclusion
We have developed a theoretical model to calculate the output characteristics of passively Q-switched lasers with Nd:YAG as the laser medium and Cr:YAG as the saturable absorber. The model accounts for the effects of thermalization between the stark levels of the upper and lower laser levels as well as excited state absorption within the Cr:YAG saturable absorber. To validate the proposed model we compared the results against experimental data for Nd:YAG/Cr:YAG passively Q-switched laser. A pulse width of 6 ns was experimentally measured from the passively Q-switched laser, while a pulse width of 6.2 ns was calculated demonstrating the accuracy of the proposed model. Additionally, the repetition rate was also found to agree well with the experimental values and not be affected by the inclusion of thermalization effects as expected.
The developed model for the passively Q-switched laser was modified to include an intracavity nonlinear crystal to simulate the theoretical performance of a passively Q-switched IC-OPO. The IC-OPO model considers both the time and spatial variation of the pump, signal and idler fields, and uses a nonlinear loss parameter to couple it to the passively Q-switched laser model to account for pump depletion due to the nonlinear process. A passively Q-switched IC-OPO was developed to gather experimental results to validate the model. The model was found to be in good agreement with experimental results, returning a signal pulse width of 1.7 ns compared to the experimentally measured pulse width of 2 ns. The developed model is the first model, to the best of our knowledge, to allow for the accurate prediction of temporal characteristics of passively Q-switched IC-OPOs.
Data availability statement
The raw data supporting the conclusions of this article will be made available by the authors, without undue reservation.
Author contributions
JK: Conceptualization, Investigation, Software, Validation, Visualization, Writing–original draft, Writing–review and editing. SS: Investigation, Visualization, Writing–review and editing. LF: Methodology, Writing–review and editing. C-qX: Conceptualization, Methodology, Writing–review and editing.
Funding
The author(s) declare financial support was received for the research, authorship, and/or publication of this article. The Ontario Research Fund—Research Excellence (ORF-RE); NSERC Alliance; and NSERC Discovery.
Conflict of interest
The authors declare that the research was conducted in the absence of any commercial or financial relationships that could be construed as a potential conflict of interest.
Publisher’s note
All claims expressed in this article are solely those of the authors and do not necessarily represent those of their affiliated organizations, or those of the publisher, the editors and the reviewers. Any product that may be evaluated in this article, or claim that may be made by its manufacturer, is not guaranteed or endorsed by the publisher.
References
1. Huang YP, Huang YJ, Cho CY, Chen YF. Influence of output coupling on the performance of a passively Q-switched Nd:YAG laser with intracavity optical parametric oscillator. Opt Express (2013) 21(6):7583–9. doi:10.1364/oe.21.007583
2. Chen YF, Chen SW, Chen YC, Lan YP, Tsai SW. Compact efficient intracavity optical parametric oscillator with a passively Q-switched Nd:YVO4/Cr4+: YAG laser in a hemispherical cavity. Appl Phys B (2003) 77(5):493–5. doi:10.1007/s00340-003-1279-3
3. Xiao G, Bass M, Acharekar M. Passively Q-switched solid-state lasers with intracavity optical parametric oscillators. IEEE J Quan Electron (1998) 34(11):2241–5. doi:10.1109/3.726620
4. Chen YF, Chen SW, Tsai LY, Chen YC, Chien CH. Efficient sub-nanosecond intracavity optical parametric oscillator pumped with a passively Q-switched Nd:GdVO4 laser. Appl Phys B (2004) 79(7):823–5. doi:10.1007/s00340-004-1623-2
5. Tsai LY, Chen YF, Lin ST, Lin YY, Huang YC. Compact efficient passively Q-switched Nd:GdVO4/PPLN/Cr4+:YAG tunable intracavity optical parametric oscillator. Opt Express (2005) 13(23):9543–7. doi:10.1364/opex.13.009543
6. Pavel N, Saikawa J, Kurimura S, Taira T. High average power diode end-pumped composite Nd:YAG laser passively Q-switched by Cr4+:YAG saturable absorber. Jpn J Appl Phys (2001) 40(3R):1253. doi:10.1143/JJAP.40.1253
7. Zhang X, Zhao S, Wang Q, Zhang Q, Sun L, Zhang S. Optimization of Cr/sup 4+/-doped saturable-absorber Q-switched lasers. IEEE J Quan Electron (1997) 33(12):2286–94. doi:10.1109/3.644112
8. Degnan JJ, Coyle DB, Kay RB. Effects of thermalization on Q-switched laser properties. IEEE J Quan Electron (1998) 34(5):887–99. doi:10.1109/3.668777
9. Dormand JR, Prince PJ. A family of embedded Runge-Kutta formulae. J Comput Appl Math (1980) 6(1):19–26. doi:10.1016/0771-050x(80)90013-3
10. Lax P, Wendroff B. Systems of conservation laws. Commun Pure Appl Math (1960) 13(2):217–37. doi:10.1002/cpa.3160130205
11. Kneller J, Flannigan L, Xu C-Q. Theoretical study of diode pumped intracavity backward optical parametric oscillator based on periodically poled lithium niobate. Appl Phys B (2023) 129(6):99. doi:10.1007/s00340-023-08045-4
12. Du Z, Li J. A two-stage fourth order time-accurate discretization for Lax–Wendroff type flow solvers II. High order numerical boundary conditions. J Comput Phys (2018) 369:125–47. doi:10.1016/j.jcp.2018.05.002
13. Sakai H, Sone A, Kan H, Taira T. Polarization stabilizing for diode-pumped passively Q-switched Nd:YAG microchip lasers. In: Advanced solid-state photonics. Incline village, Nevada. Optica Publishing Group (2006). Available at: https://opg.optica.org/abstract.cfm?URI=ASSP-2006-MD2.
14. Shoji I, Kondo T, Kitamoto A, Shirane M, Ito R. Absolute scale of second-order nonlinear-optical coefficients. J Opt Soc Am B (1997) 14(9):2268–94. doi:10.1364/josab.14.002268
15. Miller RC. Optical second harmonic generation in piezoelectric crystals. Appl Phys Lett (1964) 5(1):17–9. doi:10.1063/1.1754022
16. Leidinger M, Fieberg S, Waasem N, Kühnemann F, Buse K, Breunig I. Comparative study on three highly sensitive absorption measurement techniques characterizing lithium niobate over its entire transparent spectral range. Opt Express (2015) 23(17):21690–705. doi:10.1364/oe.23.021690
17. Bai F, Wang Q, Liu Z, Zhang X, Wan X, Lan W, et al. Theoretical and experimental studies on output characteristics of an intracavity KTA OPO. Opt Express (2012) 20(2):807–15. doi:10.1364/oe.20.000807
Keywords: IC-OPO, passive Q-switch, Cr:YAG, nonlinear optics, PPLN
Citation: Kneller J, Salimian Rizi S, Flannigan L and Xu C-q (2024) The effects of thermalization on the performance of passively Q-switched IC-OPOs. Front. Phys. 12:1428671. doi: 10.3389/fphy.2024.1428671
Received: 06 May 2024; Accepted: 18 June 2024;
Published: 16 July 2024.
Edited by:
Quan Sheng, Tianjin University, ChinaReviewed by:
Liwen Sheng, Ceyear Technologies Co., Ltd., ChinaYu Yu, Hebei University of Technology, China
Copyright © 2024 Kneller, Salimian Rizi, Flannigan and Xu. This is an open-access article distributed under the terms of the Creative Commons Attribution License (CC BY). The use, distribution or reproduction in other forums is permitted, provided the original author(s) and the copyright owner(s) are credited and that the original publication in this journal is cited, in accordance with accepted academic practice. No use, distribution or reproduction is permitted which does not comply with these terms.
*Correspondence: Chang-qing Xu, Y3F4dUBtY21hc3Rlci5jYQ==