
94% of researchers rate our articles as excellent or good
Learn more about the work of our research integrity team to safeguard the quality of each article we publish.
Find out more
ORIGINAL RESEARCH article
Front. Phys., 30 July 2024
Sec. Fusion Plasma Physics
Volume 12 - 2024 | https://doi.org/10.3389/fphy.2024.1422286
This article is part of the Research TopicTransport in the Scrape-Off Layer of Magnetically Confined Fusion PlasmasView all 4 articles
 L. De Gianni1*
 G. Ciraolo1
 G. Giruzzi1G. Falchetto1
 N. Rivals1
 K. Gałązka1,2L. Balbinot3N. Varadarajan1S. Sureshkumar1J. F. Artaud1H. Bufferand1R. Düll1A. Gallo1P. Ghendrih1V. Quadri1G. Rubino4P. Tamain1
In its first phase of exploitation, JT-60SA will be equipped with an inertially cooled divertor, which can sustain heat loads of 10 MW/m2 on the targets for a few seconds, which is much shorter than the intended discharge duration. Therefore, in order to maximize the duration of discharges, it is crucial to develop operational scenarios with a high radiated fraction in the plasma edge region without unacceptably compromising the scenario performance. In this study, the core and edge conditions of unseeded and neon-seeded deuterium H-mode scenarios in JT-60SA were investigated using METIS and SOLEDGE3X–EIRENE codes. The aim was to determine whether, and under which operational conditions, it would be possible to achieve heat loads at the targets significantly lower than 10 MW/m2 and potentially establish a divertor-detached regime while keeping favorable plasma core conditions. In first analysis, an investigation of the edge parameter space of unseeded scenarios was carried out. Simulations at an intermediate edge power of 15 MW indicate that, without seeded impurities, the heat loads at the targets are higher than 10 MW/m2 in attached cases, and achieving detachment is challenging, requiring upstream electron densities at least above 4 × 10¹⁹ m−3. This points toward the need for impurity injection during the first period of exploitation of the machine. Therefore, neon seeding simulations were carried out, performing a seeding rate scan and an injected power scan while keeping the upstream electron density at the separatrix at 3 × 10¹⁹ m−3. They show that at 15 MW of power injected into the edge plasma, the inner target is easily detached and presents low heat loads when neon is injected. However, at the outer target, the heat fluxes are not lowered below 10 MW/m2, even when the power losses in the edge plasma are equal to 50% of the power crossing the separatrix. Therefore, the tokamak will probably need to be operated in a deep detached regime in its first phase of exploitation for discharges longer than a few seconds. In the framework of core–edge integrated modeling, using METIS, the power radiated in the core was computed for the most interesting cases.
JT-60SA is an international fusion experiment built and operated by Japan and Europe, located in Naka, Japan. The JT-60SA tokamak is able to confine high-temperature deuterium plasmas lasting for a duration (typically 100 s) longer than the time scales characterizing key plasma processes, such as current diffusion and particle recycling, using superconducting toroidal and poloidal field coils [1]. During the initial research phase, the plasma-facing components (PFCs) of the tokamak will be entirely made of carbon tiles. The divertor will be inertially cooled. Under these conditions, the heat fluxes sustainable by the targets are estimated to be 10 MW/m2 × 5 s, 3 MW/m2 × 20 s, and 1 MW/m2 × 100 s [1]. Therefore, at this stage, long plasma discharges will require very low-power fluxes at the targets. These conditions may be challenging to achieve, especially when operating the machine in the H-mode regime, where a narrow scrape-off-layer (SOL) decay length
In order to obtain low heat loads for longer discharges, the radiated fraction in the SOL has to be maximized through the injection of impurities, which can eventually lead to an advantageous condition where neutrals form a layer between the wall and the plasma, substantially reducing temperatures and heat loads on the plasma-facing components: this operational regime is called detachment [3–6]. However, impurities are transported through the main ion density gradient in the H-mode pedestal and can affect its stability by cooling down the core plasma and eventually leading to the loss of performances or even disruptions (see, for example, [7] and references therein).
When performing predictive modeling, the conflicting requirements of high core performance and efficient power exhaust demand simultaneous modeling of core and edge plasma. Within this framework, the aim of this paper is to simultaneously explore the core and divertor conditions for high-density unseeded and seeded scenarios, with mitigated heat fluxes and low core contamination from impurities for the initial phase of exploitation of the machine. The starting point for such a study has been the analysis of the already designed scenario 3 (see [1] for more details).
To do so, two codes have been interactively used: METIS, a fast global tokamak discharge simulator [8], and SOLEDGE3X–EIRENE in 2D transport mode, simulating the boundary plasma (i.e., edge and SOL) and the divertor region, with a treatment of plasma–wall interactions in a realistic (2D axisymmetric) wall geometry and a kinetic modeling of plasma-neutral interactions for atoms and molecules [9, 10].
The remainder of this paper is organized as follows: the integrated modeling strategy is presented in Section 2; the setup for simulations is discussed in Sections 3 and 4; Section 5 presents the main results of an unseeded density scan; and in Section 6 scenario 3 [1] is modeled, with both unseeded and seeded power scans and a neon seeding rate scan.
In this section, the two codes SOLEDGE3X–EIRENE and METIS are described in brief, and the method for building complete scenarios from the interactive use of the two is presented.
METIS is an integrated modeling tool that describes the plasma in 1D from the center up to the separatrix without providing an accurate description of plasma–wall interactions. Some of the most relevant outputs of METIS, providing an overall description of scenarios, are plasma equilibrium evolution and current diffusion, density and temperature profiles, and power loss profiles. On the other hand, SOLEDGE3X is a multi-species fluid code that can be run in two different ways: as a 2D mean-field transport code or as a 3D turbulent code. For kinetically modeling the transport of neutrals, SOLEDGE3X is coupled to the Monte Carlo code EIRENE [10]. Since it includes several atomic and molecular reactions [10], SOLEDGE3X–EIRENE models the edge and SOL regions with an accurate description of plasma–wall interactions in a realistic geometry (which makes it suitable for power-exhaust studies). However, extending the SOLEDGE3X–EIRENE domain deep into the core plasma would raise several modeling issues, due to the different physics of transport in core and edge plasma, and numerical issues, due to a possible increase in the time stepping. Therefore, the two codes have been interactively used complementarily, adopting the modeling strategy detailed in Section 2.2.
In this contribution, SOLEDGE3X–EIRENE is used in the 2D mean field transport mode, solving the particle, parallel momentum, and energy transport equations. The mesh grid covers a region of the plasma corresponding to the SOL and the outermost part of the confined region and is aligned with the magnetic flux surfaces. To deal with complex wall geometries, the grid is extended inside the wall, and a mask function determines which points are in the plasma and which points are in the wall. Wall boundary conditions are applied at the transition between the two sets of points [9]. In the vicinity of the strike points, the grid is aligned with the wall in order to improve the accuracy of the numerical discretization.
Using the code SOLEDGE3X–EIRENE in 2D mean-field mode means that radial transport is modeled as a diffusive process, with the equations of transport that are solved on a poloidal cross-section of the tokamak assumed to be toroidally symmetric. The SOLEDGE3X grid used is shown on the left side of Figure 1, and the EIRENE grid is shown on the right side of Figure 1.
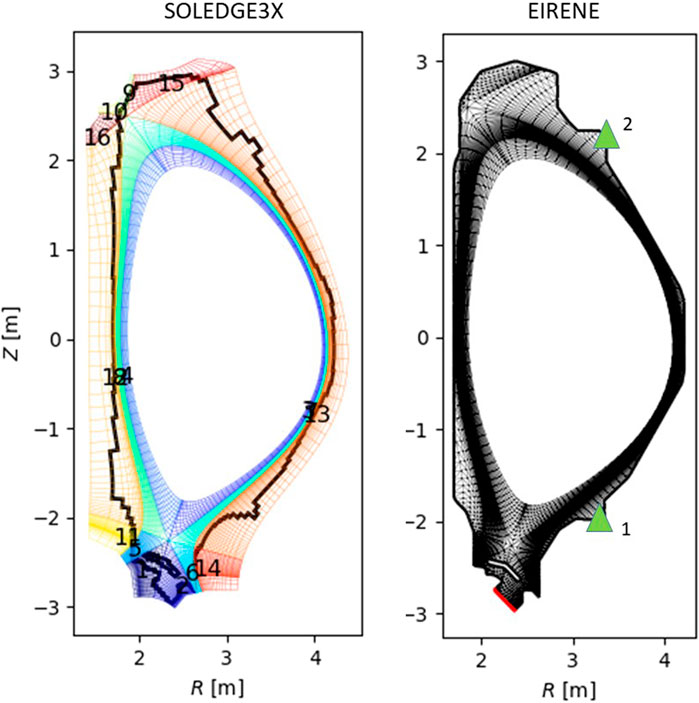
Figure 1. SOLEDGE3X and EIRENE grids. The latter shows puffs (green triangles) and pump (red) locations.
For modeling the plasma core, METIS combines 0D scaling [11, 12]-normalized heat and particle transport, 1D current diffusion modeling, and 2D equilibria, allowing testing and optimizing time-dependent scenarios within a small computation time. The density and energy profiles are described on a 1D uniform grid on the normalized minor radius. The particle transport is not solved, and the electron density is defined through the prescription of some key parameters by the user: the line-averaged density
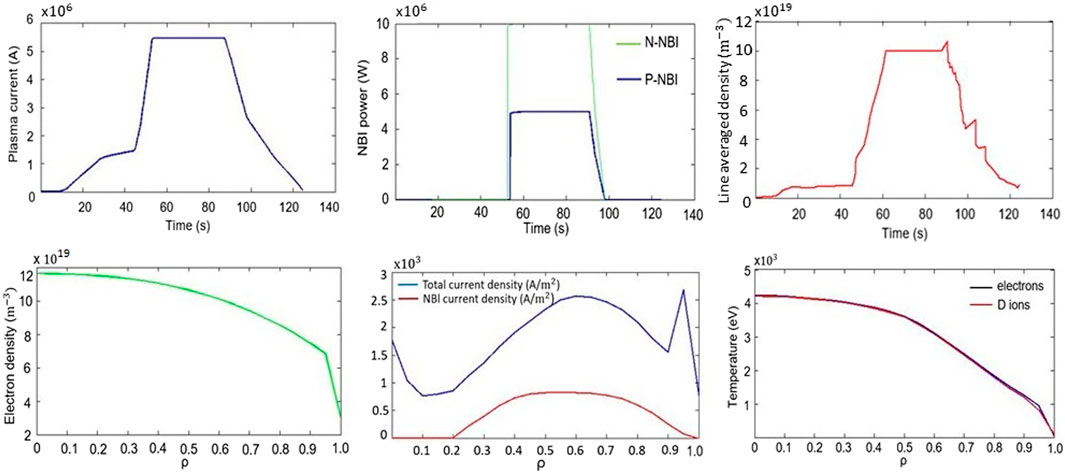
Figure 2. Example of some of the major quantities characterizing JT-60SA scenario 3 at half-power [1] in METIS. The 1D quantities on the second line are expressed in terms of the radial coordinate ρ and have been computed at t = 70 s (flat-top).
In this work, the “coupling” of METIS and SOLEDGE3X–EIRENE means that the outputs of one code are used as inputs of the other and vice versa and does not refer to a real-time numerical coupling. Figures 1, 2 show that since one code is 1D and the other is 2D, a possible coupling is one-dimensional, with the 1D outer-midplane (OMP) profiles from SOLEDGE3X–EIRENE used as 1D inputs for METIS. The fact that the 2D profiles are neglected in favor of the OMP profiles when using the outputs from SOLEDGE3X–EIRENE as METIS inputs is one of the most significant approximations of our modeling strategy since the OMP profiles are not always representative of the 2D maps. However, we emphasize that while we point to a good description of the divertor conditions, we only aim at an estimation of the main core plasma parameters to obtain an overview of the impact of impurities on confined plasma, especially for highly seeded cases. Therefore, we believe that the approximations above are reasonable. In particular, we aim to check that the electron and ion temperatures are acceptable during seeding and estimate the power radiated in the core in order to compute the total power to inject into the plasma. The coupling procedure is described in the following paragraphs.
SOLEDGE3X–EIRENE has been employed to simulate various distinct physical conditions of the boundary region from the top pedestal to the wall, starting from certain values (inputs of the code) of particle flux (Γ) and power entering the edge domain (Pedge). For each case, energy sources and sinks, operational regimes, and heat loads at the targets have been studied.
Then, for few cases of interest, corresponding METIS simulations have been built, setting the inputs for METIS as the outputs of SOLEDGE3X–EIRENE cases at the OMP. The coupling point between the two codes has been set at the top pedestal, which for both codes is at x ∼ 0.95.
In particular, the total injected power Pin,tot has been chosen in METIS such that the difference between Pin,tot and the integrated power radiated from the center of the plasma up to the top pedestal Prad,core is equal to Pedge (input of the corresponding SOLEDGE3X–EIRENE case) plus an extra power, called PELMs, and corresponding to a power accumulated in the pedestal during the inter-ELM phase. The formula linking Pin,tot (METIS input) and Pedge (SOLEDGE3X–EIRENE input) is then
From the outputs of METIS and SOLEDGE3X–EIRENE cases, complete scenarios have been built, with an overview of most of the operational parameters.
The workflow is shown in Figure 3.
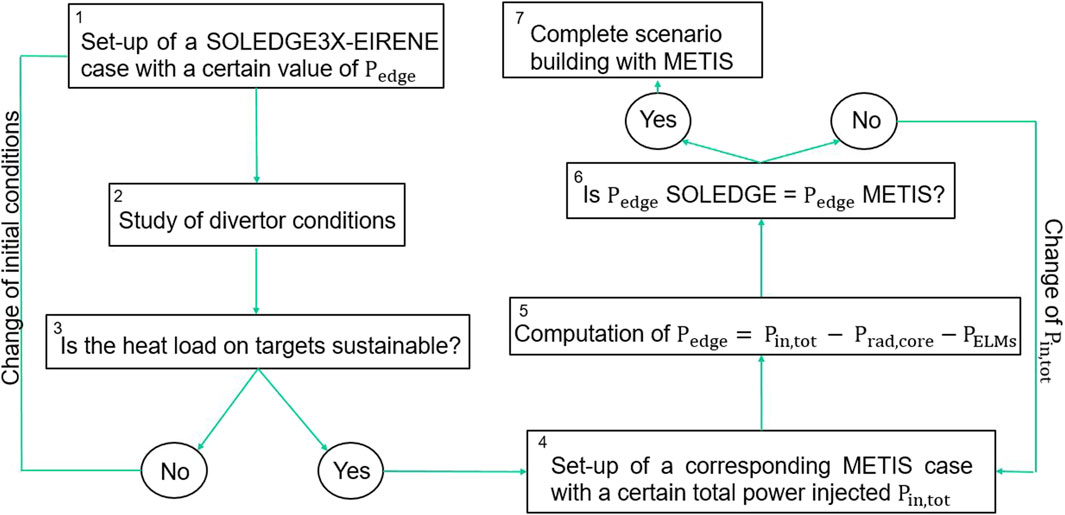
Figure 3. Integrated modeling work flow. The order of steps is given by increasing numbers.
SOLEDGE3X–EIRENE has been used in 2D mean-field mode without drifts. The simulations have been run with 10,000 particles per EIRENE stratum and a short cycling of 20, based on past sensitivity studies [13].
During the initial research phase, the neutral beam injection (NBI) will not be able to provide the full power of 34 MW foreseen for future tokamak operations; the positive NBI will provide at most 20 MW and the negative NBI will provide at most 10 MW, resulting in a total NBI power of 30 MW. Moreover, the electron cyclotron resonance frequency (ECRF) system will provide a maximum of 3 MW for a total heating power of 33 MW [1]. To take into account the power radiated in the edge and the ELM power (Eq. 1), the maximum power injected in the SOLEDGE3X-EIRENE domain has been equal to 20 MW. As boundary conditions, the deuterium particle influx from the core has been set to SD = 1.0 × 10²¹ particles/s, accounting for NBI particle influx, and the carbon and neon influx to SC = SNe = 0. The recycling coefficient R1 has been set to 0.995 for the main plasma and neon ions on carbon tiles. For carbon ions on carbon tiles, the recycling coefficient has been set to R = 0.5, according to [14]. The particle influxes from the core and the recycling coefficient have been kept constant, and deuterium fueling has been used as the density control parameter. D2 has been puffed from triangle 1, and neon from triangle 2, both shown in Figure 1 (right side). A source of carbon sputtered from the wall has been added to each case. The physical sputtering yield has been computed using the Bohdansky formula [15], and on top of it, a chemical sputtering with a constant rate has been added.
The SOLEDGE3X–EIRENE code used in 2D transport mode emulates cross-field turbulent transport through effective ad hoc particle and energy diffusion [9], whose transport coefficients, D⊥,eff and χ⊥,eff respectively, are usually chosen in agreement with experimental results. In order to reproduce the steep density and temperature profiles (pedestal) typical for H-mode regimes, the transport coefficients had to be set to vary as a function of the radial distance from the separatrix. In this work, since no experimental data were available, a heuristic approach has been used to determine the transport profiles based on the modification by using the two-point model [3] of transport profiles obtained from the modeling of existing machines. The method for choosing the diffusion coefficients has been detailed here. The diffusion profiles have been taken from [16], where they have been derived from the matching between JET simulations and data from JET discharges with parameters similar to our scenario of interest. However, since λq for JT-60SA is, in principle, different from the one for JET and the separatrix heat transport parameter χ⊥,eff sep has a high influence on λq, χ⊥,eff sep has been modified to a value compatible with the JT-60SA parameters. In order to do that, Formula 2 has been used, derived in [3] assuming an exponential decay of the heat flux in the SOL and a dependence of the upstream density on the upstream temperature as given by the two-point model for high-recycling and detached regimes:
where N = 1 is the number of nulls in the poloidal field, ne,u is the upstream (i.e., where the OMP intersects the separatrix) electron density, PSOL is the power crossing the separatrix, R and a are the major and minor radii, respectively, k is the elongation, and k0 is the conduction coefficient of the Spitzer–Harm equation:
and λq is the SOL width decay length [2]. It has been computed from the Eich scaling law [2]:
with coefficients C0, CB, Cq, CP, and CR taken from Table 1.

Table 1. Estimators for the coefficients in the Eich scaling law with their respective variances. Values taken from [2].
The value obtained for λq is equal to 1.4 mm, lower with respect to already working machines (e.g., JET and ASDEX [2]) and in agreement with the predictions of λq ∼ 1 mm for ITER [2]. The value of 1.4 mm for λq is probably an underestimate for high-density cases like the ones studied in this work. A broadening of λq by a factor of up to 4 with respect to the value obtained by the Eich scaling (Eq. 3) is foreseen in high-density cases [17]. Supplementary Appendix S2 provides a validation of the transport profiles, showing that the method adopted for setting up the transport profiles returns in simulations in attached conditions the value of λq expected by the Eich scaling.
The D⊥,eff profile has not been changed with respect to the profile from tuning on JET data. The same heat and particle diffusion coefficient profiles have been set for electrons, main ions, and impurities. The diffusion profiles derived from the aforementioned model for a case with Pedge = 15 MW and ne,u = 3 × 10¹⁹ m−3 are given in Figure 4. We have applied such transport coefficients to all the cases simulated.

Figure 4. Diffusion coefficient profiles (in solid lines) at the OMP used for the scenario proposed at Pedge = 15 MW and ne,u = 3 × 10¹⁹ m−3. χ⊥,eff is the same for all ion species and electrons, and D⊥,eff is the same for all ion species. Poloidal symmetry is assumed.
In this work, METIS simulations have been run for scenario 3, whose main free parameters are given in Table 2. However, METIS requires setting up some extra free parameters, which have been chosen here as explained below.

Table 2. Main parameters of scenario 3 foreseen for the JT-60SA tokamak.
For a good estimation of the power radiated in the core, the most important free parameters to be set in METIS are Zeff, the density at the separatrix ne,a, the density peaking factor, and the density at the pedestal. ne,a has been set equal to 3 × 10¹⁹ m−3, which is
Zeff is a crucial parameter that needs to be prescribed for computing the power radiated with METIS since the density of the major impurity is determined by the code combining the quasi-neutrality condition with its definition
In order to be coherent with the SOLEDGE3X–EIRENE simulations, the constant value of Zeff to be set up in METIS has been chosen as the value of the same OMP quantity at the separatrix, given as output by SOLEDGE3X–EIRENE; the values obtained for neon-seeded cases are shown in the central plot of Figure 12. The same has been done for prescribing the ratio between impurities in neon-seeded cases.
As a preliminary analysis, a density scan without impurity injection has been carried out with the purpose of studying how to reach detachment in unseeded cases. The throughput (i.e., D2 puff) has been increased at a fixed edge power Pedge = 15 MW. In Figure 5, the peak particle influx at the inner and outer targets as a function of the upstream electron density is plotted. At the inner target, an increase in the particle flux can be observed from 3 to 4.2 × 10¹⁹ m−3; beyond that value, the particle flux starts decreasing with the typical roll-over, meaning that the plasma starts to detach from that point on. This is confirmed by the flat electron temperature profile at 1 eV for the highest density cases (Figure 7, bottom) and by the fact that the ionization front is detached from the strike point and recombination takes place at the target, as shown in Figure 6. The first point of the scan (ne,u = 3 × 10¹⁹ m−3) is already in a high-recycling regime since the particle flux grows more slowly than the

Figure 5. Peak particle flux at the targets as a function of the upstream electron density for a deuterium puff rate scan. Each point represents a different simulation with a different puff rate.
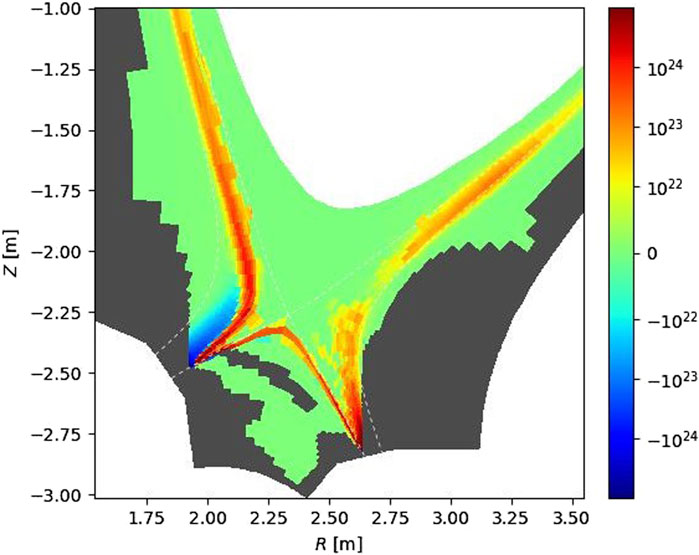
Figure 6. Source of neutral deuterium close to the targets for the case at the highest density (ne, u = 4.5 × 10¹⁹ m−3) in the puff rate scan of Figure 5. The color bar has been set on a logarithmic scale, where negative source values correspond to recombination dominating and positive source values to ionization dominating.
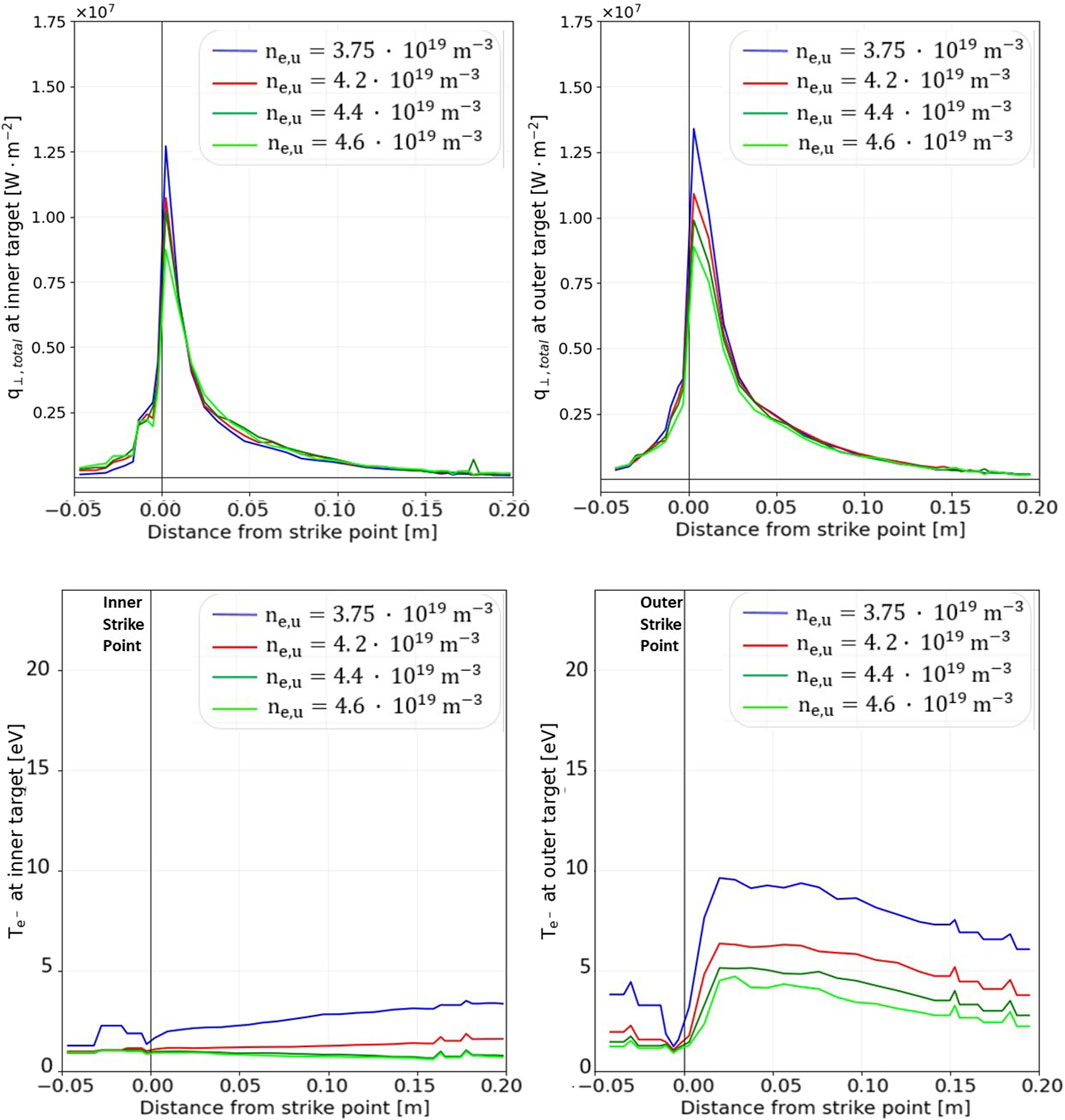
Figure 7. Total (ions, neutrals, and radiation) perpendicular heat flux (top) and electron temperature (bottom) at the inner and outer targets as a function of the distance from the respective strike points for a sub-set of the deuterium puff scan in Figure 5.
The whole picture described in this section seems to suggest that, under these conditions, the density will need to be increased further to obtain full detachment at the outer target and/or heat fluxes sustainable for more than a few seconds. An alternative to the increase in density is to inject impurities into the SOL or to operate at low power.
We are mainly interested in investigating the heat fluxes for the scenarios designed in the Research Plan 2018. Being the scenario with the foreseen highest line-averaged density
From the L → H transition scaling law,
From Eq. 1, the power to be given to SOLEDGE3X–EIRENE is the net power minus PELMs minus the power radiated in the core. Therefore, assuming zero radiation in the core, we will obtain the highest limit for the minimum power to set up in SOLEDGE3X–EIRENE to be in H-mode: Pedge min = PLH − PELMs. PELMs has been estimated to be (5.0 ± 0.5) MW based on the study of the diamagnetic energy variation in the JET shot number 92141 carried out in [19]. Since it is proportional to the ELM frequency, which is proportional to the heating power [20], PELMs is likely a function of the injected power. However, a detailed analysis of ELMs in a JT-60SA highly radiative scenario is out of the scope of the present work, and the estimation of PELMs = (5.0 ± 0.5) MW will be applied regardless of the injected power. Therefore, Pedge min = (12.5 − 5.0) MW = 7.5 MW.
The puff of D2 has been tuned in order to obtain an upstream electron density equal to ne,u = 3 × 10¹⁹ m−3 (
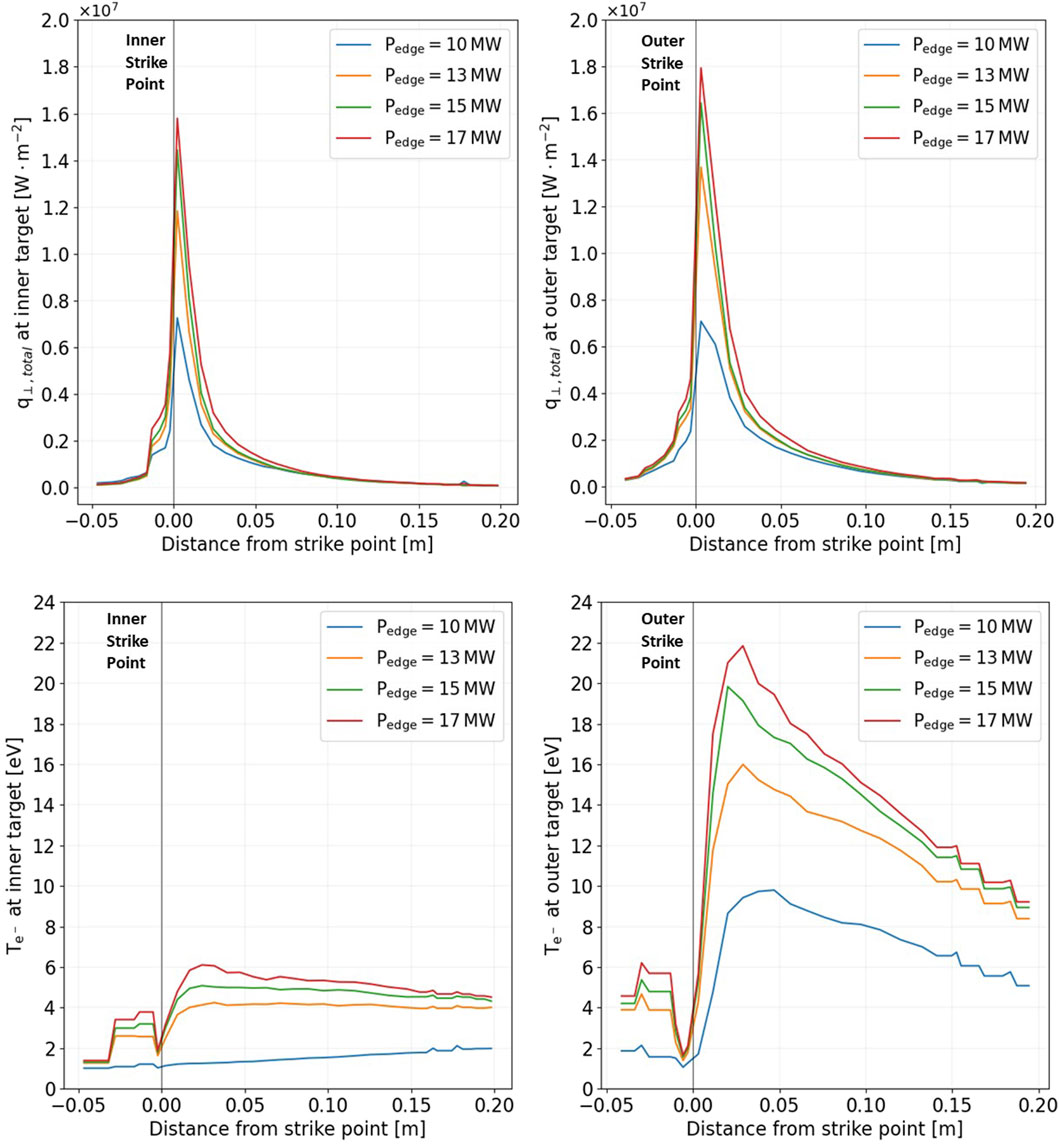
Figure 8. Total (ions, neutrals, and radiation) perpendicular heat flux (top) and electron temperature (bottom) at the inner and outer targets as a function of the distance from the respective strike points for an unseeded power scan at Pedge = 10, 13, 15, and 17 MW.
The only case to be sustainable for the targets is the case at low power Pedge = 10 MW. Therefore, the heat loads at the targets for higher-injected power cases need to be lowered through impurity injection.
Two different scans have been carried out when including neon seeding: a neon injection rate scan at fixed Pedge and a power scan at a fixed neon injection rate.
For the former, the deuterium puff rate has been fixed to 2.4 × 10²² particles/s and the power to Pedge = 15 MW, varying the neon injection rate from 3 × 10²⁰ particles/s to 12 × 1020 particles/s. Under such conditions, the OMP electron density at the separatrix is between 2.8 and 3.0 × 10¹⁹ m−3. For the latter, the neon puff has been set to 3 × 10²⁰ particles/s, and Pedge has been increased up to 17 and 20 MW. The heat loads and temperatures at the targets resulting from the neon injection rate scan are shown in Figure 9, and those from the power scan are shown in Figure 10. The injection of neon causes the growth of the asymmetry between the heat loads on the inner and outer targets, as observed when comparing Figure 8 and Figure 10. This could be due to the higher concentration of impurities at the inner targets with respect to the outer target for seeded cases, at the opposite of what happens for unseeded cases, as shown in Figure 11. We point out that carbon, which at first is sputtered mainly from the outer target because of the higher temperatures (Figure 11, left), globally decreases when neon is puffed (the total carbon content decreases from 3 × 10¹⁹ to 0.5 × 10¹⁹ carbon particles after neon injection). Additionally, as observed from the difference in carbon density at the targets between the left and the central plot of Figure 11, carbon migrates toward the inner target when adding seeding. Furthermore, a higher neon density is observed at the inner target with respect to the outer target. The higher impurity fluxes at the inner target are mainly due to friction forces, both for carbon and neon.
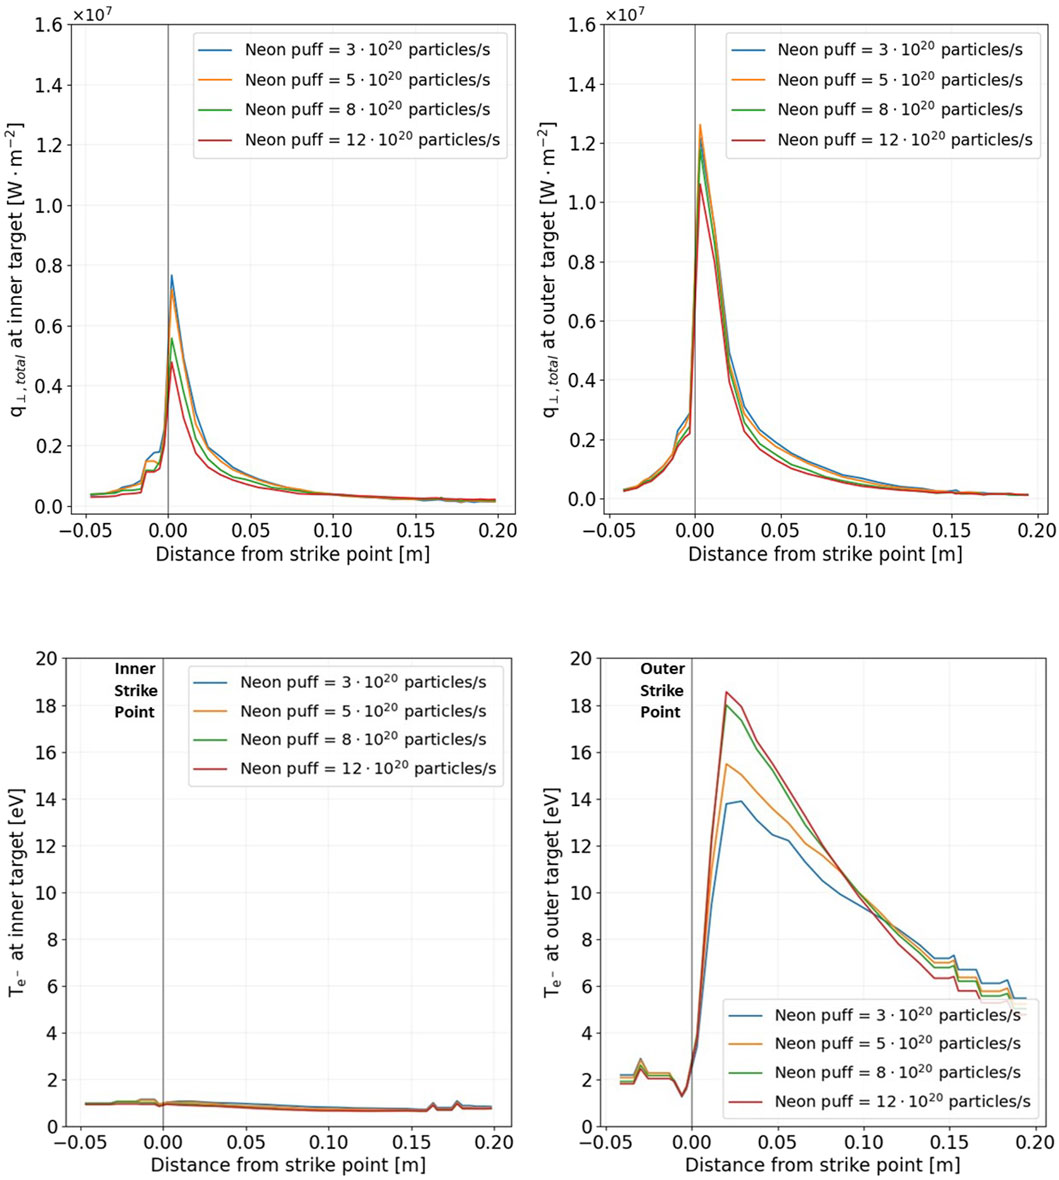
Figure 9. Total (ions, neutrals, and radiation) perpendicular heat flux (top) and electron temperature (bottom) at the inner and outer targets as a function of the distance from the respective strike points for a neon seeding rate scan at Pedge = 15 MW. Deuterium puff = 2.4 × 10²² particles/s.
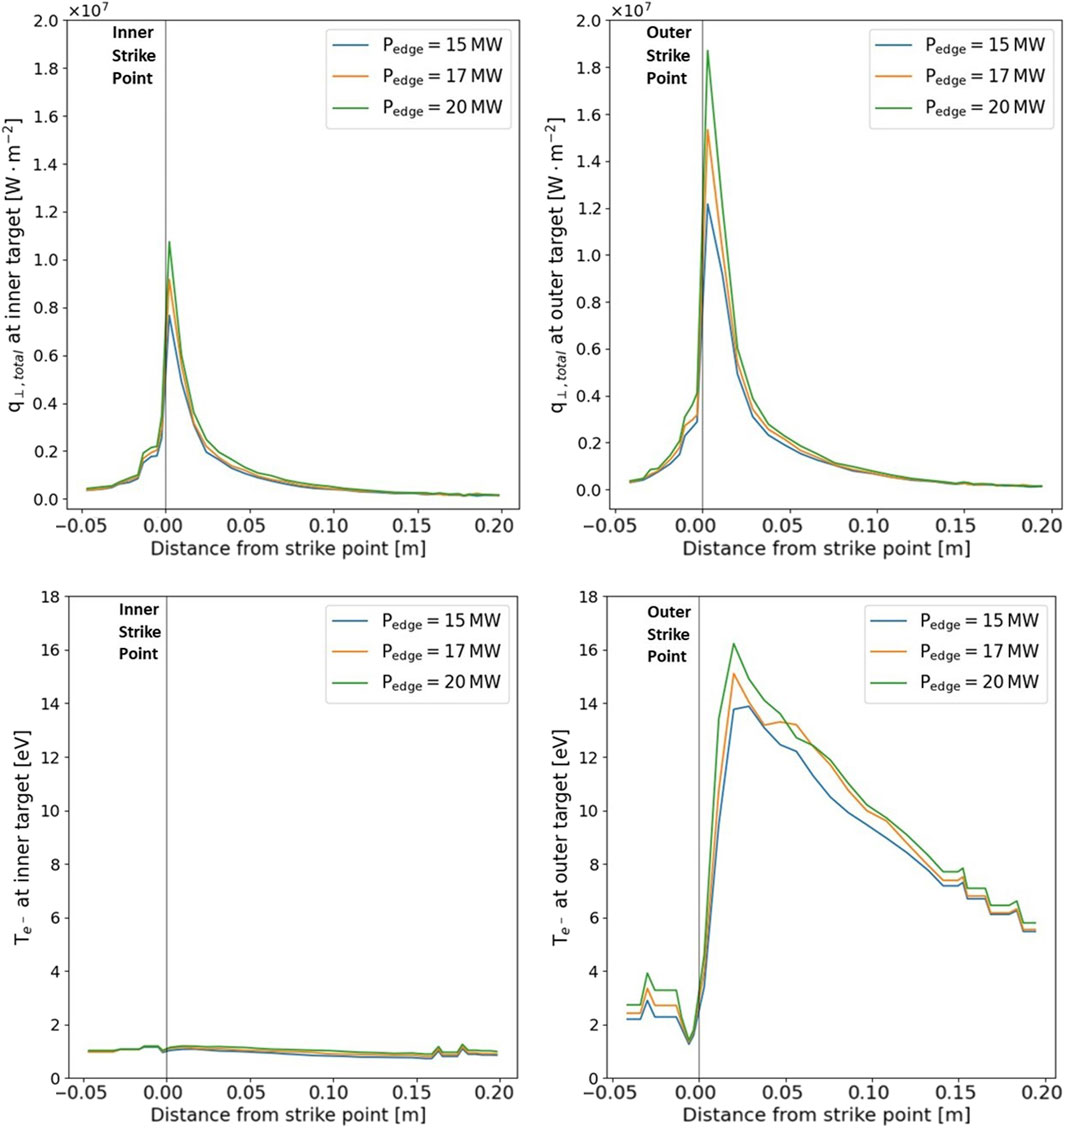
Figure 10. Total (ions, neutrals, and radiation) perpendicular heat flux (top) and electron temperature (bottom) at the inner and outer targets as a function of the distance from the separatrix for a neon-seeded (injection rate = 3 × 10²⁰ particles/s) power scan at Pedge = 15, 17, and 20 MW.
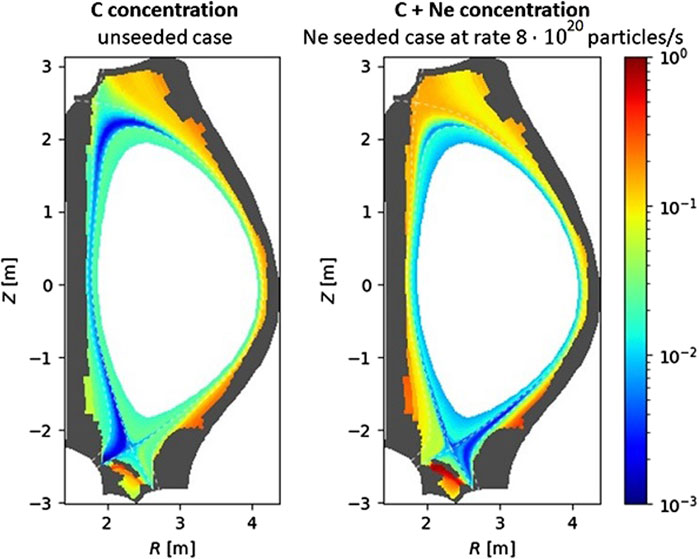
Figure 11. 2D plot of impurity concentration for the unseeded case with Pedge = 15 MW (left side) and for a seeded case with neon injection at a rate of 8 × 10²⁰ particles/s (right side). The color map has been set on a logarithmic scale.
Figure 9 (bottom) shows an increase in the electron temperature at the outer target with increasing neon puff. However, the heat fluxes decrease (Figure 9, bottom) due to a simultaneous decrease in electron density.
The effects of increasing neon puff on the edge plasma can be mainly studied through the computation of the total power radiated in the SOL, as shown in Figure 12 (left), while the core contamination is taken into account by Zeff at the separatrix, whose value is given in Figure 12 (right), and by the estimation of the power radiated in the core computed using METIS, which is shown in Table 3. It can be observed that most of the core radiation is from bremsstrahlung, mainly generated by fully or partially ionized carbon and neon particles entering the core. METIS simulations without neon injection show that the power radiated in the core is approximately 2 MW (when Pedge = 15 MW), even for unseeded cases, mainly due to ionized carbon in the core. On the other hand, the power radiated by line radiation is low for unseeded cases and low-neon puff cases, as expected, since carbon is fully ionized at temperatures lower than the typical core temperatures of such machines. The electron and ion temperatures in the core do not decrease significantly during high seeding, in the limit of the light coupling performed in this work between SOLEDGE3X–EIRENE and METIS.
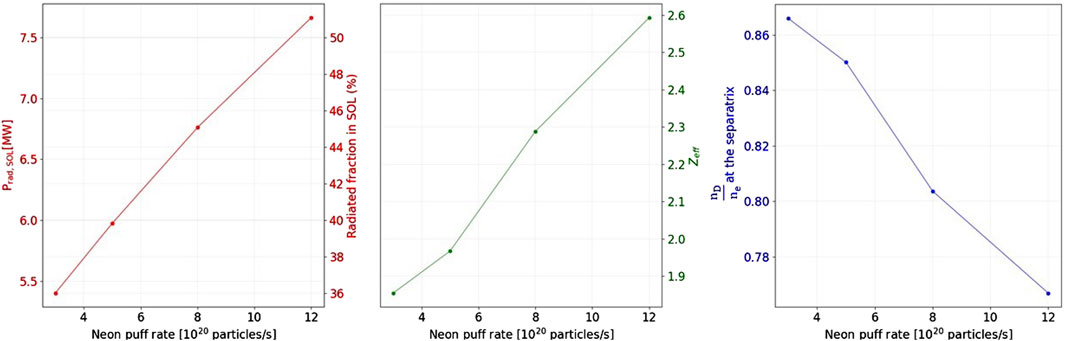
Figure 12. Total power radiated in the SOL (left side), values of Zeff at the separatrix (central plot), and values of plasma purity (relative concentration of deuterium) at the separatrix (right side) for a neon seeding scan.
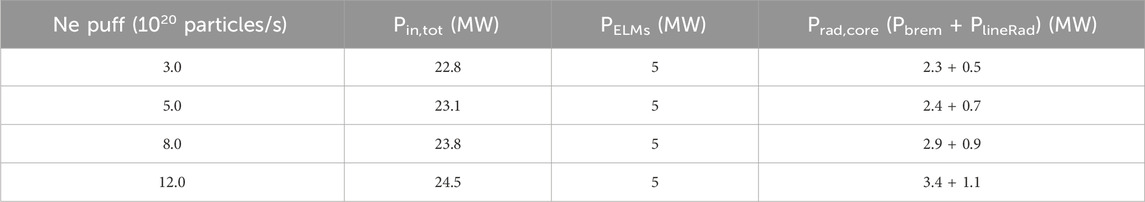
Table 3. Computation of Prad,core for neon puff scan cases, starting from Pedge = 15 MW. The power radiated in the core has been computed using METIS as the sum of the power emitted through line radiation PlineRad and bremsstrahlung Pbrem.
One can see that for all the neon-seeded cases, the temperature at the strike points is very low and compatible with a safe operation. On the contrary, the peak heat flux at the outer target is slightly above 10 MW/m2, which could imply a limitation in the discharge duration. Because of that, the machine will probably need to be operated in deep detached regimes in its first phase of exploitation. This is even truer when considering that all the simulations presented did not include drifts; it is probable that the drift terms would further move the operational space in the direction where relatively deep detachment is necessary, as they might increase the asymmetry between inner and outer targets in favor of higher heat fluxes at the outer target.
However, further studies on the sensitivity of such a peak heat flux with respect to the cross-field transport coefficients will be needed to verify whether a less conservative assumption, i.e., a larger value on the χ⊥ parameter, according to what has been found in present experiments for high-density and high recycling conditions, will reduce such a peak to acceptable values for discharges lasting longer than few seconds.
Starting from the simulations presented above, an attempt to scan for higher deuterium and/or higher neon injection rates has been carried out. In such high particle injection cases, SOLEDGE3X–EIRENE simulations reach a state where deuterium highly recombines at the divertor, leading to high neutral pressure and a subsequent increase in the main plasma out-flux, especially at the inner target. This mechanism is responsible for a long computational time, which is the reason why such simulations have not reached a steady state yet.
The source of neutrals at the targets in an example case for such a high recombination state (deuterium puff equal to 3 × 10²² particles/s and neon puff to 15 × 1020 particles/s) and the source of neutrals for a converged case with slightly lower particle injection (deuterium puff equal to 2.4 × 10²² particles/s and neon puff to 8 × 10²⁰ particles/s) can be compared when analyzing Figure 13. The same picture on the right-hand side of Figure 13 is found when puffing deuterium at a rate of 4 × 10²² particles/s and neon at a rate of 10 × 1020 particles/s.

Figure 13. Source of neutral deuterium close to the targets for a steady-state case (left-hand side) and a case with higher deuterium and neon injection (right-hand side). The latter case has not reached a steady-state yet. The color bar has been set on a symmetric logarithmic scale, where a negative source value corresponds to recombining plasma (recombination-dominating ionization).
This contribution aimed to investigate the operational conditions needed to carry out long pulses during the initial research phase of the JT-60SA tokamak with a carbon wall and inertially cooled divertor.
Starting from scenario 3 designed in the Research Plan 2018, highly radiative H-mode scenarios have been explored through the integrated use of the codes SOLEDGE3X-EIRENE (in 2D configuration) and METIS, with the aim of identifying the physical conditions needed to run the tokamak with heat fluxes at the targets significantly lower than 10 MW/m2, and potentially operating the divertor in a detachment regime while maintaining high-core plasma performances.
A first analysis has focused on unseeded cases: the conditions for early detachment in unseeded shots have been investigated, showing that an upstream electron density higher than 4.2 × 10¹⁹ m−3 is required, with heat loads close to the operational limit of 10 MW/m2 even in the highest density case analyzed. This shows that achieving low heat loads without impurity seeding will probably be challenging for JT-60SA in its first phase of exploitation and will require very high densities. However, the cases with the highest density among the ones simulated show electron temperatures lower than 5 eV on both targets.
Neon-seeded cases have been investigated through power and impurity concentration scans, where strong asymmetry between the outer and inner targets has been observed in all cases.
It has been shown that obtaining low heat fluxes at the outer target is particularly challenging, even for highly seeded, high-density plasmas. As proof for this statement, we show a case with a total injected power of 24.5 MW. It has an upstream electron density between 2.8 × 10¹⁹ m−3 and 3 × 10¹⁹ m−3;
Lower heat fluxes could be obtained by relaxing the assumption of a small SOL width (λq ∼ 1.4 mm), according to the broadening of the SOL width foreseen for high-density plasmas [17].
An attempt to simulate fully detached cases in the framework of scenario 3 has been carried out through a neon high-rate injection. In such cases, it has been observed that the fast decrease in temperature leads to massive deuterium recombination. Since we did not manage to run them to a steady state, we refer to a future publication for an analysis of their results.
The original contributions presented in the study are included in the article/Supplementary Material; further inquiries can be directed to the corresponding author.
LG: conceptualization, data curation, investigation, software, writing–original draft, and writing–review and editing. GC: project administration, supervision, and writing–review and editing. GG: project administration, supervision, validation, and writing–review and editing. GF: conceptualization, methodology, validation, and writing–review and editing. NR: investigation, software, supervision, validation, and writing–review and editing. KG: conceptualization, investigation, methodology, supervision, and writing–review and editing. LB: conceptualization, methodology, and writing–review and editing. NV: data curation, investigation, software, and writing–review and editing. SS: data curation, investigation, software, and writing–review and editing. JA: software and writing–review and editing. HB: software and writing–review and editing. RD: software and writing–review and editing. AG: methodology and writing–review and editing. PG: methodology and writing–review and editing. VQ: software and writing–review and editing. GR: methodology and writing–review and editing. PT: formal analysis, software, validation, and writing–review and editing.
The author(s) declare that financial support was received for the research, authorship, and/or publication of this article. This work was carried out within the framework of the EUROfusion Consortium, funded by the European Union via the Euratom Research and Training Programme (grant agreement no. 101052200 EUROfusion) and the European Union’s Horizon 2020 research and innovation program under grant agreement no. 824158 (EoCoE-II).
The authors declare that the research was conducted in the absence of any commercial or financial relationships that could be construed as a potential conflict of interest.
All claims expressed in this article are solely those of the authors and do not necessarily represent those of their affiliated organizations, or those of the publisher, the editors, and the reviewers. Any product that may be evaluated in this article, or claim that may be made by its manufacturer, is not guaranteed or endorsed by the publisher.
Views and opinions expressed are those of the author(s) only and do not necessarily reflect those of the European Union or the European Commission. Neither the European Union nor the European Commission can be held responsible for them.
The Supplementary Material for this article can be found online at: https://www.frontiersin.org/articles/10.3389/fphy.2024.1422286/full#supplementary-material
1R is defined as the ratio between the recycled neutral flux and the outgoing ion flux.
2The fact that χsep values are very close is a chance that allowed us to use the same diffusion profiles for both cases.
1. JT-60SA. Jt − 60sa research plan: research objectives and strategy. (2018). Available from: http://jt60sa.org/pdfs/JT−60SAResPlan.pdf.
2. Eich T, Sieglin B, Scarabosio A, Fundamenski W, Goldston RJ, Herrmann A, et al. Inter-elm power decay length for jet and asdex upgrade: measurement and comparison with heuristic drift-based model. Phys Rev Lett (2011) 107:215001. doi:10.1103/physrevlett.107.215001
3. Pitcher CS, Stangeby P. Experimental divertor physics. Plasma Phys Controlled Fusion (1997) 39:779–930. doi:10.1088/0741-3335/39/6/001
4. Leonard AW. Plasma detachment in divertor tokamaks. Plasma Phys Controlled Fusion (2018) 60:044001. doi:10.1088/1361-6587/aaa7a9
5. Loarte A, Monk R, Martín-Solís J, Campbell D, Chankin A, Clement S, et al. Plasma detachment in jet mark i divertor experiments. Nucl Fusion (1998) 38:331–71. doi:10.1088/0029-5515/38/3/303
6. Krasheninnikov S, Kukushkin A, Lee W, Phsenov A, Smirnov R, Smolyakov A, et al. Edge and divertor plasma: detachment, stability, and plasma-wall interactions. Nucl Fusion (2017) 57:102010. doi:10.1088/1741-4326/aa6d25
7. Angioni C. Impurity transport in tokamak plasmas, theory, modelling and comparison with experiments. Plasma Phys Controlled Fusion (2021) 63:073001. doi:10.1088/1361-6587/abfc9a
8. Artaud JF, Imbeaux F, Garcia J, Giruzzi G, Aniel T, Basiuk V, et al. Metis: a fast integrated tokamak modelling tool for scenario design. Nucl Fusion (2018) 58:105001. doi:10.1088/1741-4326/aad5b1
9. Bufferand H, Bucalossi J, Ciraolo G, Falchetto G, Gallo A, Ghendrih P, et al. Progress in edge plasma turbulence modelling—hierarchy of models from 2d transport application to 3d fluid simulations in realistic tokamak geometry. Nucl Fusion (2021) 61:116052. doi:10.1088/1741-4326/ac2873
11. ITER Physics Expert Group on Confinement and Transport. Plasma confinement and transport. Nucl Fusion (1999) 39:2175–249. doi:10.1088/0029-5515/39/12/302
12. Martin YR, Takizuka T. Power requirement for accessing the h-mode in iter. J Phys Conf Ser (2008) 123:012033. doi:10.1088/1742-6596/123/1/012033
13. Rivals N. Understanding density regimes and divertor detachment in ITER relevant conditions. IRFM-CEA Cadarache. Ph.D. thesis. Aix-Marseille Univeristy (2023).
14. Yang H. Control of detachment in the divertor region of tokamaks: impact of wall geometry, particle, and energy sources. Ph.D. thesis. Aix-Marseille University (2023).
15. Bohdansky J. A universal relation for the sputtering yield of monatomic solids at normal ion incidence. Nucl Instr Methods Phys Res Section B: Beam Interactions Mater Atoms (1984) 2:587–91. doi:10.1016/0168-583x(84)90271-4
16. Balbinot L, Rubino G, Casiraghi I, Meineri C, Frassinetti L, Aucone L, et al. Multi-code estimation of dtt edge transport parameters. Nucl Mater Energ (2023) 34:101350. doi:10.1016/j.nme.2022.101350
17. Faitsch M, Eich T, Harrer G, Wolfrum E, Brida D, David P, et al. Broadening of the power fall-off length in a high density, high confinement h-mode regime in asdex upgrade. Nucl Mater Energ (2021) 26:100890. doi:10.1016/j.nme.2020.100890
19. Balbinot L. Power exhaust and plasma divertor interaction study by means of a 2D edge numerical code. Ph.D. thesis. Padova University (2022).
Keywords: JT-60SA, modeling, core, edge, scrape-off layer, power exhaust
Citation: De Gianni L, Ciraolo G, Giruzzi G, Falchetto G, Rivals N, Gałązka K, Balbinot L, Varadarajan N, Sureshkumar S, Artaud JF, Bufferand H, Düll R, Gallo A, Ghendrih P, Quadri V, Rubino G and Tamain P (2024) Core and edge modeling of JT-60SA H-mode highly radiative scenarios using SOLEDGE3X–EIRENE and METIS codes. Front. Phys. 12:1422286. doi: 10.3389/fphy.2024.1422286
Received: 23 April 2024; Accepted: 10 June 2024;
Published: 30 July 2024.
Edited by:
Peter Manz, University of Greifswald, GermanyReviewed by:
Aaro Järvinen, VTT Technical Research Centre of Finland Ltd., FinlandCopyright © 2024 De Gianni, Ciraolo, Giruzzi, Falchetto, Rivals, Gałązka, Balbinot, Varadarajan, Sureshkumar, Artaud, Bufferand, Düll, Gallo, Ghendrih, Quadri, Rubino and Tamain. This is an open-access article distributed under the terms of the Creative Commons Attribution License (CC BY). The use, distribution or reproduction in other forums is permitted, provided the original author(s) and the copyright owner(s) are credited and that the original publication in this journal is cited, in accordance with accepted academic practice. No use, distribution or reproduction is permitted which does not comply with these terms.
*Correspondence: L. De Gianni, bHVkb3ZpY2EuZGVnaWFubmlAY2VhLmZy
Disclaimer: All claims expressed in this article are solely those of the authors and do not necessarily represent those of their affiliated organizations, or those of the publisher, the editors and the reviewers. Any product that may be evaluated in this article or claim that may be made by its manufacturer is not guaranteed or endorsed by the publisher.
Research integrity at Frontiers
Learn more about the work of our research integrity team to safeguard the quality of each article we publish.