 Min Liu1
 Qiang Guo
 Jianguo Liu
94% of researchers rate our articles as excellent or good
Learn more about the work of our research integrity team to safeguard the quality of each article we publish.
Find out more
ORIGINAL RESEARCH article
Front. Phys., 19 June 2024
Sec. Social Physics
Volume 12 - 2024 | https://doi.org/10.3389/fphy.2024.1420556
This article is part of the Research TopicNetwork Learning and Propagation Dynamics AnalysisView all 14 articles
Dimension reduction is an effective method for system’s resilience analysis. In this paper, we investigate the effect of network structure on the accuracy of resilience dimension reduction. First, we introduce the resilience dimension reduction method and define the evaluation indicator of the resilience dimension reduction method. Then, by adjusting node connections, preferential connection mechanisms, and connection probabilities, we generate artificial networks, small-world networks and social networks with tunable assortativity coefficients, average clustering coefficients, and modularities, respectively. Experimental results for the gene regulatory dynamics show that the network structures with positive assortativity, large clustering coefficient, and significant community can enhance the accuracy of resilience dimension reduction. The result of this paper indicates that optimizing network structure can enhance the accuracy of resilience dimension reduction, which is of great significance for system resilience analysis and provides a new perspective and theoretical basis for selecting dimension reduction methods in system resilience analysis.
Resilience describes a system’s ability to retain the basic functionality when errors or failures occur, which is a fundamental property for complex systems [1–4]. The loss of resilience in numerous real-world systems could lead to catastrophic consequences, such as large-scale extinctions in ecological networks [5], and cascading failures in infrastructure systems [6]. As such, exploring resilience patterns for complex systems, making systems resilient to environmental changes has been one of the most critical issues in network science.
Resilience is an absolute measure that quantifies the extent to which a system recovers from instability. For instance, in biological systems, resilience may refer to a population’s ability to maintain its size and distribution in the face of environmental changes, predation pressures, diseases, or other disturbances. A population with high resilience can adapt to environmental changes by regulating birth rates, death rates, immigration, and emigration, thus maintaining population stability. In some literatures on network analysis, resilience and robustness are used as interchangeable concepts [7]. Resilience is defined on network dynamics [1, 8], measuring the ability of a network to maintain its structure and function in the face of disturbances or attacks, while robustness is related to the static structure of a network, measuring the ability to maintain its connectivity when a fraction of nodes (links) is damaged [9]. However, when dealing with complex networks composed of numerous interconnected components, traditional resilience analysis frameworks may become inadequate. The multi-dimensional and nonlinear characteristics of these networks poses challenges for analysis. As a result, the dimension reduction method is needed to map a large number of nonlinear dynamic systems to one-dimensional dynamic systems, while keeping systems’ key dynamic characteristics. Gao et al. [1] proposed the dimension reduction method that decomposes N-dimensional networks into one-dimensional effective models and uses it to predict the global activity of the original network. Subsequently, based on the theoretical tools for large-scale networks and the advanced data analyzing techniques [10–13], the method has been extended to many aspects such as noise effects [14–16], reduction methods based on spectral dimension [17], sequence mean field [18] and degree weighted average [19], and has been applied to various fields [20–22]. The dynamic characteristics of a system strongly depend on the underlying network structure [17]. Understanding the topology or properties of a network can help us better reveal its inherent behavior from different perspectives [23–25]. Gao et al. [1] found that density, heterogeneity, and symmetry are three key structural factors affecting a system’s resilience. Xu et al. [26] established a dynamic model of a multi-dimensional Supplier-Manufacturer network by combining structural information and network parameters. The results show that the resilience of Supplier-Manufacturer networks is highly sensitive to network structural characteristics, namely, nesting, and density. Dong et al. [3] found that community structure can significantly affect the resilience of a system. Meng et al. [27] used link density, algebraic connectivity, and aggregation coefficients to measure the number of links, fault tolerance, and redundancy in a network to evaluate the resilience of the power system. According to the simulation experiments, Costa [28] found that applying growth strategies on pre-existing structures can significantly enhance the resilience of complex networks. Li et al. [29] proposed a network resilience evaluation method that considers both network structure and node load, and then improved the network resilience enhancement strategy based on optimization theory. Laurence et al. [17] used the dominant eigenvalues and eigenvectors of the network adjacency matrix to construct a dimension reduction method based on spectrogram theory. Therefore, network structure plays an important role in the system’s resilience analysis. Real networks are usually heterogeneous [30, 31] and may have certain topological structures or attributes. For example, interpersonal networks on social networking platforms such as LinkedIn have high assortativity coefficients, protein-protein interaction networks in biology [32], and collaborative networks of jazz musicians have obvious community structures [33]. The dimension reduction proposed by Gao et al. [1] can be used to accurately predict the system’s response to diverse perturbations and correctly locate the critical points, at which the system loses its resilience. So, what role does network structure play in resilience dimension reduction?
In this paper, we investigate the effect of network structure on the accuracy of resilience dimension reduction. First, we introduce the resilience dimension reduction method and define the resilience measurement error. Then, by adjusting node connections, preferential connection mechanisms, and connection probabilities, we construct TAC model, HK model and TQ model, respectively. Based on the TAC model, HK model, and TQ model, we generate artificial networks, small-world networks and social networks with tunable assortativity coefficients, average clustering coefficients, and modularities, respectively. We conduct resilience dimension reduction analysis experiments on gene regulatory dynamics. The experimental results show that network structures with positive assortativity, large clustering coefficient, and significant community can enhance the accuracy of resilience dimension reduction. Finally, through error analysis of resilience dimension reduction on the reconstructed social networks, the results validate our conclusion.
In a multi-dimensional system, the dynamics of each component not only depend on the self-dynamics but also relate to the interactions between the components and their interacting partners [34, 35]. The dynamic equation of a multi-dimensional system consisting of N components (nodes) can be formally written as
The first term on the right-hand side of Eq. 1 describes the self-dynamics of each component, while the second term describes the interaction between component i and its interacting partners. The matrix element aij denotes the interactions between node i and j, and aij = 1 when there are an link between node i and j, and aij = 0 otherwise.
The resilience of multi-dimensional systems can be captured by calculating the stable fix point of Eq. 1. However, this point may depend on the changes in any of the parameters of the adjacency matrix. Moreover, there are maybe different forms of perturbations bringing changes to the adjacency matrix, for example, node/link removal, or weight reduction. It means that the resilience of multi-dimensional systems depends on the network topology and the forms of perturbations. For large-scale multi-dimensional models, it is impossible to predict their resilience by direct calculations on Eq. 1. A framework based on dimension reduction addresses this challenge.
In a network, the activity of each node is governed by its nearest neighbors through the interaction term
where the unit vector
where
where
Then, based on the mean field approximation theory, L (G (xi, x)) ≈ G (xi, L(x)), L (F(x)) ≈ F (L(x)), L (sin◦G (x, L(x))) ≈ L (sin)◦G (L(x), L(x)). Eq. 5 can be written as
and then this allows us to write Eq. 6 and Eq. 7 as
where ◦ represents Hadamard convolution [36].
Finally, based on the Eq. 3, we obtain the average effective state of the system
and the nearest neighbor weighted degree
where
Based on the Eqs 8–10 and Eq. 1 is simplified into an effective one-dimensional equation
Although the resilience function is uniquely determined by the dynamical functions F(xi) and G (xi, xj), the actual position of the system along this curve, capturing its momentary state, is determined by the network topology aij. So we constructed networks with different structures to explore the effect of network structure on the accuracy of the resilience dimension reduction method.
Networks with different topological structures have different properties. The section mainly introduces three models for generating tunable parameter networks.
1) The assortativity coefficient ρ is an indicator that measures the degree of correlation between adjacent nodes in a network [37]. The Tunable-Assortativity-Coefficient (TAC) model changes the network’s assortativity by adjusting the node connectivity, and generates the artificial networks with tunable assortativity coefficient ρ. The program for an artificial network using the TAC model can be divided into three steps.
a) Initial condition: Randomly generate a connected network consisting of n0 nodes and m0 edges.
b) Network growth: Add one new node i at each time step and connect to m existing nodes, and m ≤ m0.
c) Preferential connection: The probability pj of a new node being connected to an existing node i and the degree ki of node i satisfy the relationship
2) The Holme-Kim (HK) model can construct artificial networks with tunable average clustering coefficient C [39]. When generating a network, the HK model will generate a fixed number of closed triangular adjacency relationships as required to adjust the average clustering coefficient C of the network. The program for generating artificial networks using the HK model can be divided into four steps.
a) Initial condition: Randomly generate a connected network consisting of n0 nodes and m0 edges.
b) Network growth: Add one new node i at each time step. At the same time, node i selects m existing nodes as neighbor nodes through preferential connection or triangulation, and m ≤ m0.
c) Preferential connection: Calculate the probability Πj (Πj = kj/∑iki) of node j being selected as a neighbor node by the new node i based on the degree kj of each existing node j in the network. The new node i selects the neighbor nodes based on probability Πj, and the first neighbor node of node i is selected according to the preferential connection.
d) Triangle formation: Triangle formation is generally executed with a probability of 1 − Pt after preferential connection. If a new node i has already selected a neighbor j, then the selection range for the next neighbor of node i is all the neighbors of node j, thus forming a closed triangular adjacency relationship.
3) The modularity Q is a parameter used to characterize the strength of community features. The Tunable-Modularity (TM) model can adjust the connection probability as needed to generate the artificial networks with tunable modularity Q. The program for an artificial network using the TM model can be divided into three steps.
a) Initialize the network: Create an initial network containing a small number of nodes that are interconnected to ensure network connectivity.
b) Gradually add nodes: Gradually add new nodes and connect them to existing nodes.
c) Reconnect edges: When connecting new nodes, reconnect some edges according to the required modularity to adjust the network’s community structure.
In Addition, by adjusting the reconnection probability, we can generate small-world networks and social networks [40] with different average clustering coefficients, assortativity coefficients, and modularities.
The dynamic equation of the gene regulatory network is governed by Michaelis-Menten [1].
where the first item on the right-hand side describes the self-dynamic of each cell, and the second item is intercellular activity. The Hill coefficient h describes the level of cooperation in gene regulation [34]. We conduct interference experiments on three types of different tunable parameter networks, and explore the resilience reduction performance of tunable parameter networks. Then we mainly perturb the network in three different ways, including randomly deleting a certain proportion of nodes, deleting a certain proportion of edges, and changing a certain proportion of global weights. The initial state of all nodes is set to x0 = 2, and it depends on the dynamic equation to calculate the node state when the system converges. Conducting 100 removals for each type of perturbation. Based on the mapping process and Eqs 11, 12 is rewritten as
Based on this, we define the system’s resilience measurement error to quantify the accuracy of the resilience dimension reduction model. The parameter settings for the gene regulatory dynamic equation are B = 1, q = 1, and h = 2.
In this section, we define the system’s resilience measurement error Err to quantify the accuracy of the resilience dimension reduction model. The Err can be expressed as
where xeff(i) − x (βeff(i)) denotes the error between the numerical value xeff(i) of the system state obtained through Eq. 9 and the numerical value x (βeff(i)) of the system state obtained through Eqs 10, 13. l represents the total number of perturbations, including randomly removing a certain proportion of nodes, removing a certain proportion of links, and changing a certain proportion of global weights. We conduct 100 experiments on each perturbation. The smaller the Err value, the better the performance of the dimension reduction method.
We analyze the accuracy of the resilience dimension reduction method on empirical networks, as measured by the error Err (Eq. 14). Table 1 shows the accuracy results of resilience dimension reduction on empirical networks. We can find that the errors Err of resilience dimension reduction on Facebook and Twitter networks are relatively small comparing with other networks (biological and ecological networks) (bold values in Table 1). For the same dynamics, the errors Err of resilience dimension reduction on Polbooks and Jazz networks are smaller than that of E. coli and S. cerevisiae networks (bold values in Table 1), which indicates that comparing with other networks, the accuracy of resilience dimension reduction on social networks is larger, and dynamics do not affect the accuracy of resilience dimension reduction. As shown in Figure 1, the error Err of uniform networks is smaller than that of homogeneous networks, random networks, scale-free networks, small-world networks, and community networks, while the error Err of scale-free networks is larger than that of uniform networks, homogeneous networks, random networks, small-world networks, and community networks. Hence, we obtain the order of accuracy of resilience dimension reduction as follows: uniform networks, small-world networks, homogeneous networks, community networks, random networks, and scale-free networks. The dimension reduction method analysis by Gao et al. [1], it can be concluded that the accuracy of a uniform network reaches the optimal values, which is shown in Figure 1. In addition, we can also find that the accuracy of small world networks is smaller than the one obtained from the uniform networks and larger than the ones get from other networks. The reason lies in the fact that a uniform network, each node is connected to the same number of other nodes. Comparing with other networks, small-world networks usually have higher homogeneity, meaning that nodes tend to connect to nodes with similar degrees, while in scale-free networks, the connection patterns of nodes exhibit high heterogeneity, meaning that there are a few “hub nodes” with a large number of connections. The above results indicate that the dimension reduction method of the resilience has remarkable performance for social networks.
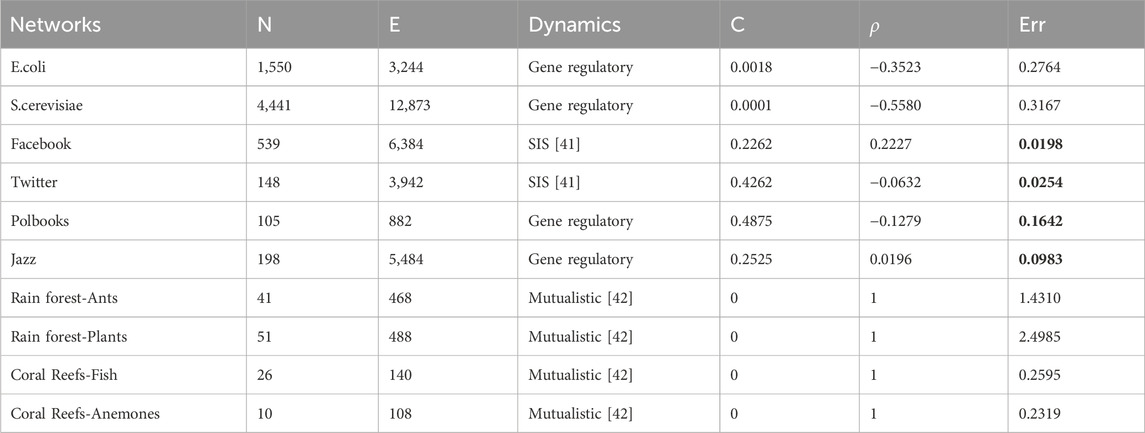
Table 1. Network characteristics of empirical networks and accuracy results of resilience dimension reduction.
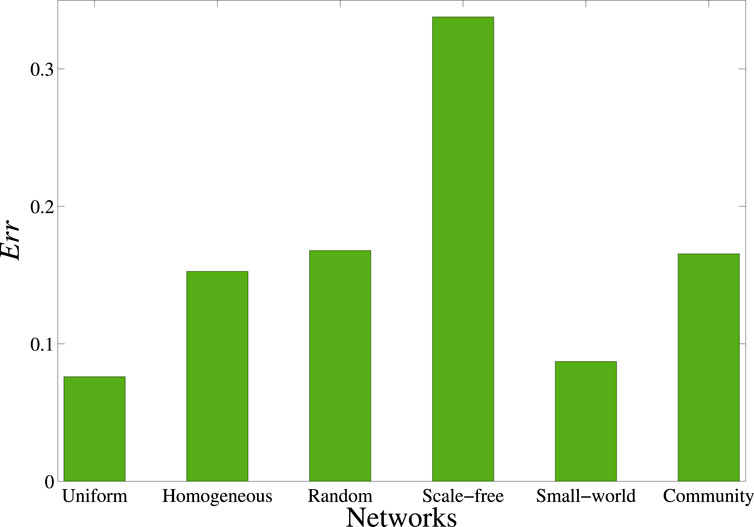
Figure 1. The resilience dimension reduction performance of different networks.
In Table 1, we find that the error Err of resilience dimension reduction on Polbooks network is larger than that of Jazz network. The reason is that the accuracy of the resilience dimension reduction method varies depending on the size and structure of the network. So we investigate the accuracy of resilience dimension reduction on networks with different network sizes. As shown in Figure 2, we find that the error Err of network with N = 200 is larger than that of 150 and 100, and the error Err of network with N = 150 is larger than that of 100, which indicates that the network size will affect the accuracy of resilience dimension reduction, and the larger the size, the greater the influence. We can also find in Figure 2 that as the assortativity coefficient ρ increases, the error Err decreases. Therefore, one can find that the accuracy of resilience dimension reduction for social networks is large. The question is raised what kind of structure can enhance the accuracy of resilience dimension reduction? We generate artificial networks with different structures (assortativity coefficient, average clustering coefficient and modularity) and analyze the accuracy of the resilience dimension reduction method.
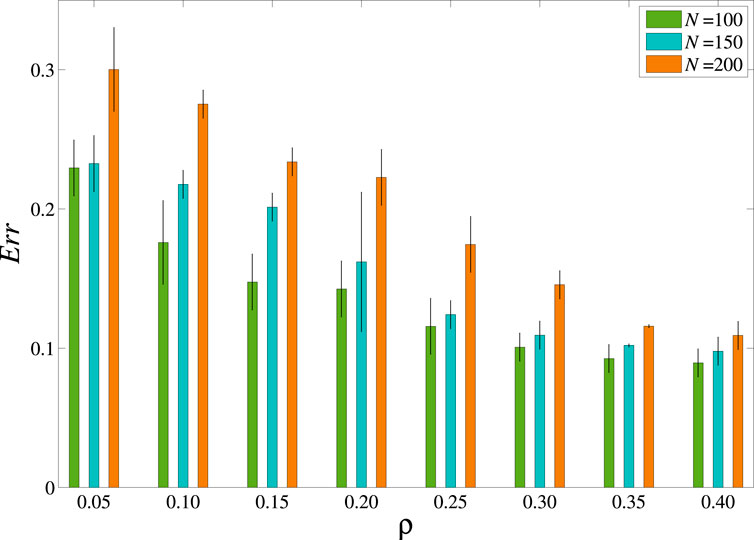
Figure 2. The resilience dimension reduction performance of different network sizes.
Firstly, based on the models in Section 2.2, we generate three sets of networks with 200 nodes and 800 edges, including assortativity coefficient ρ ∈ [-0.4,0.4], average clustering coefficient C ∈ [0.1,0.7] and modularity Q ∈ [0.1,1.0]. Figure 3A shows the accuracy of dimension reduction on networks with different assortativity coefficients ρ. As the assortativity coefficient ρ increases, the error Err decreases, indicating that the network structure with high assortativity coefficient has larger accuracy of resilience dimension reduction. The error Err of the network resilience dimension reduction method with the assortativity coefficient ρ > 0 is smaller than that of the network resilience dimension reduction method with the assortativity coefficient ρ < 0, indicating that the accuracy of resilience dimension reduction is larger for the network structure with positive assortativity coefficient. Figure 3B shows the accuracy of resilience dimension reduction under different average clustering coefficients C. As the average clustering coefficient C increases, the error Err decreases. The results indicate that the dimension reduction method could generate larger accuracy for networks with large average clustering coefficient. Figure 3C shows the accuracy of resilience dimension reduction under different modularity Q. As the modularity Q increases, the error Err decreases. The results indicate that the accuracy of resilience dimension reduction is large for networks with high modularity. The clustering coefficient measures the probability that the neighbors of a node are also neighbors of each other, reflecting the local clustering property of the network. Assortativity describes the tendency of similar nodes (such as nodes with similar degrees) in the network to connect with each other. The community structure network refers to the clear division of the network into communities, where nodes within a community are densely connected while connections between communities are relatively sparse. Networks with large clustering coefficient often have large modularity, which indicates that networks with clustering coefficient also exhibit large modularity, leading to smaller resilience dimension reduction errors. Networks with large assortativity, similar nodes are more likely to form tightly connected communities, which suggests that networks with large assortativity also large modularity, resulting in smaller resilience dimension reduction errors. Both clustering coefficient and assortativity are related to the local structure of the network. The clustering coefficient focuses on connections between neighboring nodes, while assortativity focuses on connections between similar nodes. In some cases, large clustering coefficient may be associated with large assortativity because a high probability of connections between neighboring nodes may imply that these nodes are similar in some attribute. This indicates that the more homogeneous the local structure of the network, the better the performance of resilience dimension reduction. In summary, for networks with large assortativity, large average clustering coefficient, and large modularity, the resilience dimension reduction can result in smaller errors. In other words, large assortativity indicates the presence of similar nodes in the network, large average clustering coefficient indicate high local connectivity between neighboring nodes, and large modularity indicates the presence of closely related subnetworks in the network. In such network structures, resilience dimension reduction can better preserve information about these similar nodes, closely related subnetworks, and connections between neighboring nodes, thereby improving the accuracy of resilience dimension reduction.

Figure 3. The resilience dimension reduction performance of networks with different structures. The subplots (A–C) show the correlations between the assortativity coefficient ρ ∈ [−0.4,0.4], average clustering coefficient C ∈ [0.1,0.7], modularity Q ∈ [0.1,1.0], and resilience dimension reduction error Err of the network. The network size is all 200. We obtain each data value by averaging 10 independent runs of each network.
Secondly, we investigate the accuracy of resilience dimension reduction on small-world networks with different structures. The small-world network is a network structure that lies between regular networks and random networks, characterized by short average paths, high clustering coefficients, and community structure. We generate three sets of small-world networks with 200 nodes and 800 edges, with assortativity coefficient ρ ∈ [0.05,0.45], average clustering coefficient C ∈ [0.05,0.50], and modularity Q ∈ [0.65,1.0]. As shown in Figure 4, with the increase of ρ, C, and Q increase, the Err values decrease. The experimental results show that the larger the assortativity coefficient, average clustering coefficient, and modularity of the network, the better the accuracy of resilience dimension reduction.
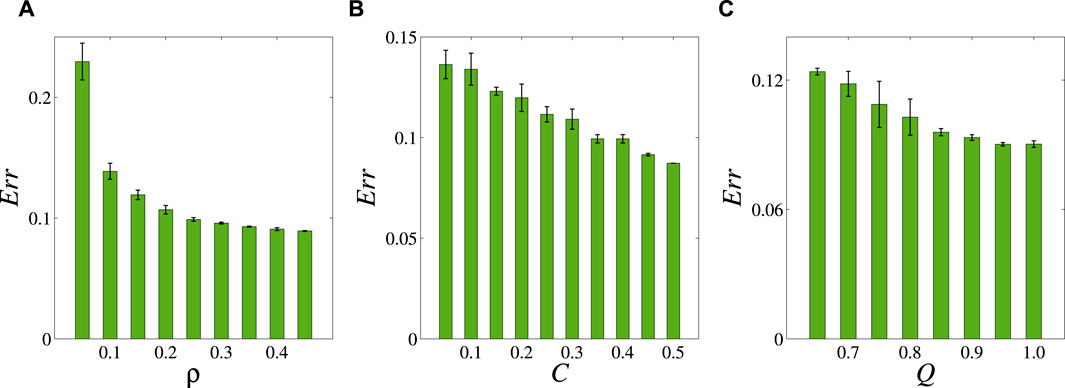
Figure 4. The resilience dimension reduction performance of small-world networks with different structures. The subplots (A–C) show the correlations between the assortativity coefficient ρ ∈ [0.05,0.45], average clustering coefficient C ∈ [0.05,0.50], modularity Q ∈ [0.65,1.0], and resilience dimension reduction error Err of the network. The network size is all 200. We obtain each data value by averaging 10 independent runs of each network.
Social networks have characteristics such as small world phenomena, node degree distributions that follow power-law distributions, high clustering coefficients, assortativity that nodes are more inclined to connect with similar nodes, and community structures. The above results indicate that the network structure with positive assortativity, large average clustering coefficient, and significant community can enhance the accuracy of resilience dimension reduction.
Finally, we reconstruct the network structures to generate social networks with different assortativity coefficients, average clustering coefficients and modularities. As shown in Figure 5, the error analysis of dimension reduction on social networks indicates that as ρ, C and Q increase, the accuracy of resilience dimension reduction on social networks increases. The empirical results show that the network structure with positive assortativity, large average clustering coefficient, and significant community can enhance the accuracy of resilience dimension reduction.
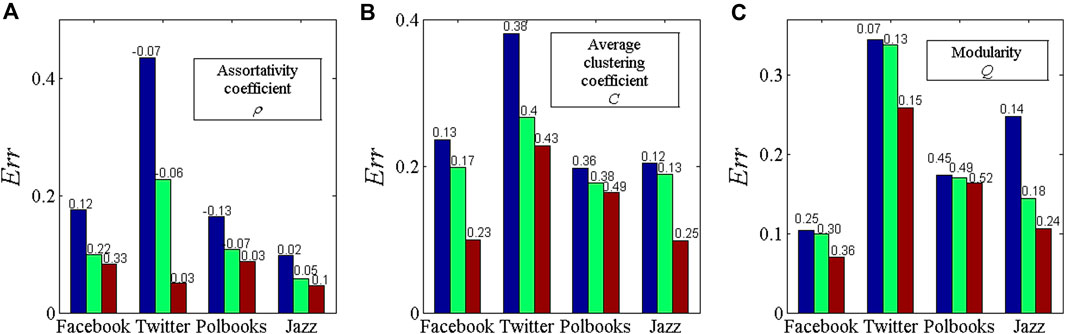
Figure 5. The resilience dimension reduction performance of social networks. The subplots (A–C) show the correlations between the assortativity coefficient ρ, average clustering coefficient C, modularity Q, and resilience dimension reduction error Err of the social network, respectively.
In this paper, we investigated the effect of network structure on the accuracy of resilience dimension reduction. First, we introduce the resilience dimension reduction method and define the resilience measurement error. Then, by adjusting node connections, preferential connection mechanisms, and connection probabilities, we construct TAC model, HK model and TQ model, respectively. Based on the TAC model, HK model, and TQ model, we generated artificial networks, small-world networks and social networks with tunable assortativity coefficients, average clustering coefficients, and modularities, respectively. We conducted dimension reduction analysis experiments on gene regulatory dynamics using the generated networks, and analyzed the effect of tunable parameters on the accuracy of resilience dimension reduction based on the error analysis. We found that the error Err of resilience dimension reduction for social networks is small. The larger the assortativity coefficient ρ( > 0), the smaller the error Err. The larger the average clustering coefficient C, the smaller the error Err. As the modularity Q increases, the error Err decreases. The error values Err of resilience dimension reduction on small-world networks with large assortativity coefficient, high average clustering coefficient, and high modularity are small, which indicates that the resilience dimension reduction method has remarkable performance for networks with positive assortativity, large average clustering coefficient, and significant community.
In summary, network structure has a significant impact on the accuracy of the resilience dimension reduction, which is of great research importance on practical applications. In this paper, when the HK model generated a tunable clustering coefficient network, due to the limitations of structural properties such as sparsity and average assortativity coefficient, we did not further analyze the accuracy of the dimension reduction for networks with the average clustering coefficient C > 0.7. According to preliminary speculation, if the number of nodes, sparsity, and average assortativity coefficient of the network remains unchanged, the average clustering coefficient C will continue to increase from 0.7, and the number of triangles in the network will increase accordingly. When the total number of edges in the network remains constant, an increase in the number of triangles should cause most of the edges of dense nodes to transfer to the adjacency relationships of other non-dense nodes. The accuracy of the resilience dimension reduction should increase with the increase of the average clustering coefficient. In the process of resilience analysis of artificial networks, although we applied it to gene regulation dynamics, we can obtain corresponding results by applying it to SIS propagation dynamics. For example, when Polbooks, Jazz, E. coli, and S. cerevisiae networks are all applied in gene regulation dynamics, we found that the error values of resilience dimension reduction on Polbooks and Jazz networks are smaller than that of E. coli and S. cerevisiae networks. In addition, we only studied the effects of assortativity coefficient, average clustering coefficient, and modularity on the accuracy of the resilience dimension reduction. However, in real networks, there often exist motifs [43, 44] or hypernetworks that describe rich and complex multivariate relationships [45]. So further research is needed to investigate the accuracy of resilience dimension reduction for motifs and hypernetworks.
The original contributions presented in the study are included in the article/Supplementary material, further inquiries can be directed to the corresponding author.
ML: Methodology, Validation, Writing–original draft, Writing–review and editing. QG: Conceptualization, Methodology, Validation, Writing–original draft, Writing–review and editing. JL: Conceptualization, Methodology, Supervision, Writing–original draft, Writing–review and editing, Validation.
The author(s) declare that financial support was received for the research, authorship, and/or publication of this article. This work was partially supported by the National Natural Science Foundation of China (Grant Nos 72371150, 72171150), and the Fundamental Research Funds for the Central Universities: High-Quality Development of Digital Economy: An Investigation of Characteristics and Driving Strategies (Grant No. 2023110139).
The authors declare that the research was conducted in the absence of any commercial or financial relationships that could be construed as a potential conflict of interest.
All claims expressed in this article are solely those of the authors and do not necessarily represent those of their affiliated organizations, or those of the publisher, the editors and the reviewers. Any product that may be evaluated in this article, or claim that may be made by its manufacturer, is not guaranteed or endorsed by the publisher.
1. Gao JX, Barzel B, Barabási AL. Universal resilience patterns in complex networks. Nature (2016) 530:307–12. doi:10.1038/nature16948
2. Asllani M, Carletti T. Topological resilience in non-normal networked systems. Phys Rev E (2018) 97:042302. doi:10.1103/PhysRevE.97.042302
3. Dong GG, Fan JF, Shekhtman LM, Shai S, Du RJ, Tian LX, et al. Resilience of networks with community structure behaves as if under an external field. Proc Natl Acad Sci USA (2018) 115:6911–5. doi:10.1073/pnas.1801588115
4. De Domenico M, Arenas A. Modeling structure and resilience of the dark network. Phys Rev E (2017) 95:022313. doi:10.1103/PhysRevE.95.022313
5. Barzel B, Biham O. Quantifying the connectivity of a network: the network correlation function method. Phys Rev E (2009) 80:046104. doi:10.1103/PhysRevE.80.046104
6. Duan DL, Lv CC, Si SB, Wang Z, Li DQ, Gao JX, et al. Universal behavior of cascading failures in interdependent networks. Proc Natl Acad Sci USA (2019) 116:222452–7. doi:10.1073/pnas.1904421116
7. Cohen R, Erez K, ben-Avraham D, Havlin S. Resilience of the internet to random breakdowns. Phys Rev L (2000) 85(21):4626–8. doi:10.1103/PhysRevLett.85.4626
8. Holling CS. Resilience and stability of ecological systems. Annu Rev Ecol S (1973) 4(1):1–23. doi:10.1146/annurev.es.04.110173.000245
9. Albert R, Jeong H, Barabasi AL. Error and attack tolerance of complex networks. Nature (2000) 406(6794):378–82. doi:10.1038/35019019
10. Chaovalitwongse WA, Yuan Y, ZhangLiu QPJG. Special issue: innovative applications of big data and artificial intelligence. Front Eng Manag (2022) 9:517–9. doi:10.1007/s42524-022-0234-0
11. He YJ, Xu XK, Xiao J. Predicting higher order links in social interaction networks. IEEE Trans Comput Soc Syst (2024) 11(2):2796–806. doi:10.1109/TCSS.2023.3293075
12. Ni XL, Xiong F, Pan SR, Wu J, Wang L, Chen HS. Community preserving social recommendation with cyclic transfer learning. ACM Trans Inf Syst (2023) 42(3):1–36. doi:10.1145/3631115
13. Zhu HR, Xiong F, Chen HS, Xiong X, Wang L. Incorporating a triple graph neural network with multiple implicit feedback for social recommendation. ACM Trans Web (2024) 18(2):1–26. doi:10.1145/3580517
14. Liang JH, Hu YQ, Chen GR, Zhou TS. A universal indicator of critical state transitions in noisy complex networked systems. Sci Rep (2017) 7:42857. doi:10.1038/srep42857
15. Tu CY, Grilli J, Schuessler F, Suweis S. Collapse of resilience patterns in generalized Lotka-Volterra dynamics and beyond. Phys Rev E (2017) 95:062307. doi:10.1103/PhysRevE.95.062307
16. Lv CC, Si SB, Duan DL, Zhan RJ. Dynamical robustness of networks against multi-node attacked. J Phys A Math Theor (2017) 471:837–44. doi:10.1016/j.physa.2016.12.066
17. Laurence E, Doyon N, Dube LJ, Desrosiers P. Spectral dimension reduction of complex dynamical networks. Phys Rev (2019) 9:011042. doi:10.1103/PhysRevX.9.011042
18. Moutsinas G, Guo WS. Node-level resilience loss in dynamic complex networks. Sci Rep (2020) 10:3599. doi:10.1038/s41598-020-60501-9
19. Jiang JJ, Huang ZG, Seager TP, Lin W, Grebogi C, Hastings A, et al. Predicting tipping points in mutualistic networks through dimension reduction. Proc Natl Acad Sci USA (2018) 115:E639–E647. doi:10.1073/pnas.1714958115
20. Zhang HX, Liu XM, Wang Q, Zhang WD, Gao JX. Co-adaptation enhances the resilience of mutualistic networks. J R Soc Interf (2020) 17(168):20200236. doi:10.1098/rsif.2020.0236
21. Macy MW, Ma MQ, Tabin DR, Gao JX, Szymanski BK. Polarization and tipping points. Proc Natl Acad Sci USA (2021) 118(50):e2102144118. doi:10.1073/pnas.2102144118
22. Dong SJ, Gao XY, Mostafavi A, Gao JX, Gangwal U. Characterizing resilience of flood-disrupted dynamic transportation network through the lens of link reliability and stability. Reliab Eng Syst Saf (2023) 232:109071. doi:10.1016/j.ress.2022.109071
23. Ahn YY, Bagrow JP, Lehmann S. Link communities reveal multiscale complexity in networks. Nature (2010) 466:761–4. doi:10.1038/nature09182
24. Boccaletti S, Bianconi G, Criado R, del Genio CI, Gómez-Gardeñesi J, Romance M, et al. The structure and dynamics of multilayer networks. Phys Rep (2014) 544:1–122. doi:10.1016/j.physrep.2014.07.001
25. Peng ST, Shu XC, Ruan ZY, Huang ZG, Xuan Q. Classifying multiclass relationships between ASes using graph convolutional network. Front Eng Manag (2022) 9:653–67. doi:10.1007/s42524-022-0217-1
26. Xu MK, Radhakrishnan S, Kamarthi S, Jin XN. Resiliency of mutualistic supplier-manufacturer networks. Sci Rep (2019) 9:13559. doi:10.1038/s41598-019-49932-1
27. Meng FL, Fu GT, Farmani R, Sweetapple C, Butler D. Topological attributes of network resilience: a study in water distribution systems. Water Res (2018) 143:376–86. doi:10.1016/j.watres.2018.06.048
28. Costa LDF. Reinforcing the resilience of complex networks. Phys Rev E (2004) 69(6):066127–7. doi:10.1103/PhysRevE.69.066127
29. Li J, Wang Y, Zhong JL, Sun Y, Guo ZJ, Chen ZW, et al. Network resilience assessment and reinforcement strategy against cascading failure. Chaos Soliton Fract (2022) 160(C):112271. doi:10.1016/j.chaos.2022.112271
30. Sun HC, Liu XF, DuWu ZWY, Zhang HF, Xu XK. Heterogeneous influence of individuals’ behavior on mask efficacy in gathering environments. Front Eng Manag (2022) 9:550–62. doi:10.1007/s42524-022-0193-5
31. Sakib N, Sun X, KongMasterson NC, Meng HD, Smith K, et al. Heterogeneous length-of-stay modeling of post-acute care residents in the nursing home with competing discharge dispositions. Front Eng Manag (2022) 9:577–91. doi:10.1007/s42524-022-0203-7
32. Barabási AL, Oltvai ZN. Network biology: understanding the cell’s functional organization. Nat Rev Genet (2004) 5(2):101–13. doi:10.1038/nrg1272
33. Gleiser PM, Danon L. Community structure in jazz. Adv Complex Syst (2003) 06(04):565–73. doi:10.1142/S0219525903001067
34. Barzel B, Barabási AL. Universality in network dynamics. Nat Phys (2013) 9(10):673–81. doi:10.1038/NPHYS2741
35. Barzel B, Liu YY, Barabási AL. Constructing minimal models for complex system dynamics. Nat Commun (2015) 6:7186. doi:10.1038/ncomms8186
36. Davis C. The norm of the Schur product operation. Numer Math (1962) 4(1):343–4. doi:10.1007/BF01386329
37. Zhou B, Yan X, Lv Y, Xuan Q. Adversarial attacks on clustering coefficient in complex networks. IEEE Trans Circuits Syst Express Briefs (2024) 71(4):2199–203. doi:10.1109/TCSII.2023.3337896
38. Guo Q, Liang G, Fu JQ, Han JT, Liu JG. Roles of mixing patterns in the network reconstruction. Phys Rev E (2016) 94(5):052303–3. doi:10.1103/PhysRevE.94.052303
39. Holme P, Kim BJ. Growing scale-free networks with tunable clustering. Phys Rev E (2002) 65(2):026107. doi:10.1103/PhysRevE.65.026107
40. Ou Y, Guo Q, Liu JG. Identifying spreading influence nodes for social networks. Front Eng Manag (2022) 9:520–49. doi:10.1007/s42524-022-0190-8
41. Pastor-Satorras R, Castellano C, Van Mieghem P, Vespignani A. Epidemic processes in complex networks. Rev Mod Phys (2015) 87:925–79. doi:10.1103/RevModPhys.87.925
42. Holland JN, Deangelis DL, Bronstein JL. Population dynamics and mutualism: functional responses of benefits and costs. Am Nat (2002) 159:231–44. doi:10.1086/338510
43. Milo R, Shen-Orr S, Ltzkovitz S, Kashtan N, Chklovskii D, Alon U. Network motifs: simple building blocks of complex networks. Science (2002) 298(5594):824–7. doi:10.1126/science.298.5594.824
44. Xu MD, Zhang ZF, Xu XK. Research on spreading mechanism of false information in social networks by motif degree. J Comput Res Dev (2021) 58(7):1425–35. doi:10.7544/ISSN1000-1239.2021.20200806
Keywords: system’s resilience, dimension reduction, network structure, social network, assortativity, clustering coefficient, modularity
Citation: Liu M, Guo Q and Liu J (2024) Effect of network structure on the accuracy of resilience dimension reduction. Front. Phys. 12:1420556. doi: 10.3389/fphy.2024.1420556
Received: 20 April 2024; Accepted: 28 May 2024;
Published: 19 June 2024.
Edited by:
Fei Xiong, Beijing Jiaotong University, ChinaReviewed by:
Qi Xuan, Zhejiang University of Technology, ChinaCopyright © 2024 Liu, Guo and Liu. This is an open-access article distributed under the terms of the Creative Commons Attribution License (CC BY). The use, distribution or reproduction in other forums is permitted, provided the original author(s) and the copyright owner(s) are credited and that the original publication in this journal is cited, in accordance with accepted academic practice. No use, distribution or reproduction is permitted which does not comply with these terms.
*Correspondence: Jianguo Liu, bGl1amcwMDRAdXN0Yy5lZHUuY24=
Disclaimer: All claims expressed in this article are solely those of the authors and do not necessarily represent those of their affiliated organizations, or those of the publisher, the editors and the reviewers. Any product that may be evaluated in this article or claim that may be made by its manufacturer is not guaranteed or endorsed by the publisher.
Research integrity at Frontiers
Learn more about the work of our research integrity team to safeguard the quality of each article we publish.