 Luyang Wang
 Gongxue Zhang1
 Jinyuan Chen
 Zucheng Huang
- 1College of Mechanical and Electrical Engineering, Shaanxi University of Science and Technology, Xi’an, China
- 2Guangzhou Institute of Advanced Technology, Guangzhou, China
In industrial aluminum sheet surface defect detection, false detection, missed detection, and low efficiency are prevalent challenges. Therefore, this paper introduces an improved YOLOv8 algorithm to address these issues. Specifically, the C2f-DSConv module incorporated enhances the network’s feature extraction capabilities, and a small target detection layer (160 × 160) improves the recognition of small targets. Besides, the DyHead dynamic detection head augments target representation, and MPDIoU replaces the regression loss function to refine detection accuracy. The improved algorithm is named YOLOv8n-DSDM, with experimental evaluations on an industrial aluminum sheet surface defect dataset demonstrating its effectiveness. YOLOv8n-DSDM achieves an average mean average precision (mAP50%) of 94.7%, demonstrating a 3.5% improvement over the original YOLOv8n. With a single-frame detection time of 2.5 ms and a parameter count of 3.77 M, YOLOv8n-DSDM meets the real-time detection requirements for industrial applications.
1 Introduction
The extensive development of technology has led to the widespread use of aluminum and its alloys in diverse industries, including aerospace, transportation, construction, and power generation. However, during the manufacturing process of industrial aluminum sheets, various surface defects, e.g., scratches, pinholes, black spots, and creases, may arise due to the quality of raw materials, production techniques, and equipment conditions. These imperfections compromise the aluminum sheets’ aesthetic appeal and, more importantly, diminish their mechanical strength and resistance to corrosion. Consequently, industrial aluminum sheets’ usability and service life are adversely affected. Therefore, effectively detecting and controlling surface defects in industrial aluminum sheets is paramount in guaranteeing their quality and reliability.
The surface defect detection of industrial aluminum sheets in production workshops primarily relies on manual visual inspection and tactile methods. However, these approaches are inefficient and heavily influenced by human factors, hindering the detection results’ accuracy and consistency. The traditional image detection method consists of three steps: image processing, feature extraction and target recognition. In recent years, with the advancements in computer vision, image processing, machine learning, and other technologies, deep learning-based surface defect detection methods have gained significant research attention. However, there are still many challenges, such as the slow detection speed of the model, which cannot meet the requirements of real-time detection, the detection environment that affects the detection effect of the model due to factors such as lighting, the low frequency of some defects low, and the small number of available samples. Current deep learning-based object detection algorithms are divided into one-stage and two-stage. The one-stage object detection algorithms, such as the YOLO (You Only Look Once) [1] series and the SSD (Single Shot MultiBox Detector) [2] algorithm, simultaneously locate and classify objects. Accordingly, the two-stage object detection algorithms, such as RCNN [3], Fast R-CNN [4], Faster R-CNN [5], and R-FCN [6], first generate candidate regions and then classify them. Consequently, two-stage object detection algorithms offer higher accuracy but slower detection speed than one-stage algorithms.
For surface defect detection in industrial settings, sacrificing a small portion of detection accuracy and employing a one-stage object detection algorithm is a more practical choice. Currently, several industrial surface defect detection solutions have been proposed. For instance, Sun et al. [7] developed an object detection network based on the R-FCN algorithm for detecting pin-like defects in unmanned aerial vehicle inspection images. They achieved a detection accuracy of 83.45%. Huang et al. [8] proposed an improved aluminum profile surface defect detection algorithm based on Faster R-CNN, which enhanced detection accuracy by incorporating feature pyramids and deformable convolution. However, the detection speed of that method did not meet the industrial requirements, and it consumed a large amount of computing resources. Wei et al. [9] introduced an improved YOLOv3 method for detecting surface defects in steel rolling, utilizing the PSA feature pyramid attention module for multi-scale feature fusion. Their method achieved a detection accuracy of 80.01%. LI et al. [10] developed a lightweight network, M2-BL-YOLOv4, for detecting surface defects in aluminum based on the enhanced YOLOv4. By modifying the backbone network to an inverted residual structure, they significantly reduced the model’s parameters and improved its detection speed. Xu et al. [11] proposed an industrial aluminum sheet defect detection method based on YOLOv4, which employed GhostNet [12] as the backbone network to enhance feature extraction capability while reducing network parameters. This approach achieved a detection accuracy of 90.98%. Besides, Tang et al. [13] presented an improved YOLOv5 method for cylinder head forging defect detection, which replaced the SPP-YOLO structure in the original YOLOv5 head with the Decoupled Head structure. This modification enabled the model to utilize multiple feature maps of varying sizes for object detection, adapting to targets with diverse scales. Dou et al. [14] applied an improved YOLOv7 for insulator detection tasks and achieved significant accuracy improvement by incorporating a small target detection layer. Zhou et al. [15] innovatively integrated a context aggregation module (CAM) between the backbone and feature fusion networks based on the YOLOv8 architecture. This approach enhanced feature utilization and yielded a detection accuracy of 89.90% on the photovoltaic cell EL dataset. However, there is still much room for developing surface defect detection technology based on deep learning. For example, defect detection can be fused with cross-modal retrieval technology [16–20], and deep learning models can be used to fuse data from different modalities (images and sensor data) to improve detection accuracy. At the same time, there are still many problems in the surface defect detection of industrial aluminum sheets, such as improving the detection accuracy of the network for small targets, balancing real-time and accuracy, and enhancing the generalization of algorithms.
YOLOv8, a novel algorithm in the YOLO series, introduced by Ultralytics in January 2023, leverages the advancements made throughout the development of the YOLO series to achieve high detection accuracy and speed. Thus, YOLOv8 is well-suited for targeted improvements in surface defect detection of industrial aluminum sheets. Therefore, this paper proposes an industrial aluminum sheet surface defect detection algorithm based on an improved YOLOv8 to enhance defect detection accuracy. Experimental results demonstrate that the improved YOLOv8n algorithm achieves high accuracy on the industrial aluminum sheet dataset while meeting the detection speed requirements for industrial scenarios.
2 Introduction to YOLOv8 algorithm
The YOLOv8 algorithm is an advanced object detection model refined and improved upon its predecessors, establishing it as a powerful and highly accurate model. YOLOv8 encompasses five models categorized by size: YOLOv8n, YOLOv8s, YOLOv8m, YOLOv8l, and YOLOv8x. The YOLOv8n model was selected as the baseline model due to its compact size and computational efficiency, making it an appealing solution for surface defect detection in industrial aluminum sheets. The structural details of the YOLOv8n algorithm model are illustrated in Figure 1.
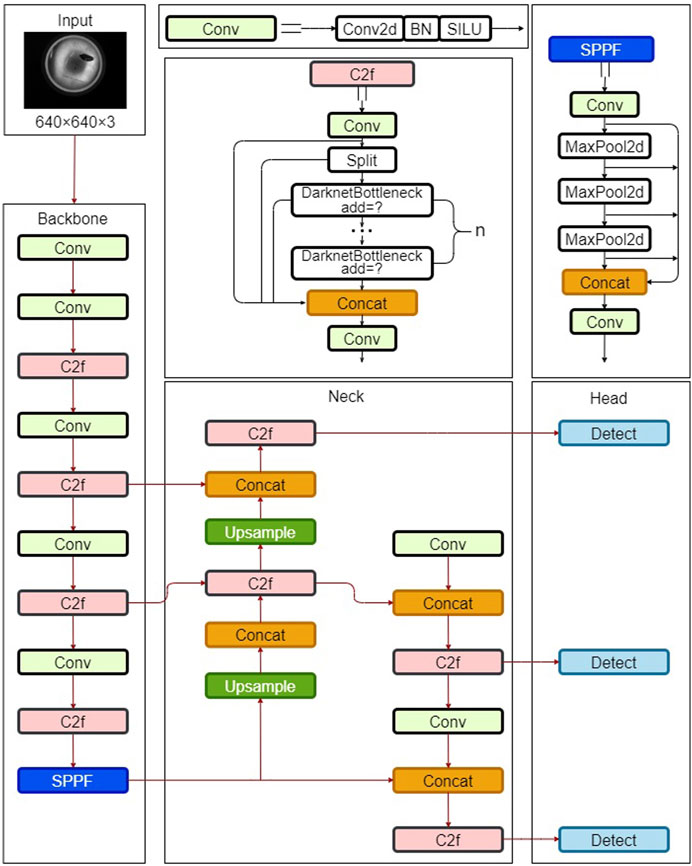
Figure 1. Architecture of the YOLOv8n Algorithm model.
The YOLOv8 algorithm comprises three primary components: Backbone, Neck, and Head. The Backbone extracts the features, the Neck performs feature fusion, and the Head is utilized for object classification and localization prediction. YOLOv8 introduces significant innovations and improvements in each component compared to its predecessors. Firstly, YOLOv8 introduces the ELAN concept from YOLOv7 [21] and replaces the previous C3 module with a new C2f module. This modification makes the model more lightweight while obtaining more diverse gradient flow information. Secondly, the Head part adopts a decoupled head structure, using two parallel branches to handle the localization and classification tasks separately, allowing the model to be optimized for different tasks. Thirdly, YOLOv8 replaces the anchor-based approach with an anchor-free one. It also employs the Task-Aligned Assigner sample allocation strategy. Furthermore, YOLOv8 uses the Varifocal Loss for classification and incorporates the Distribution Focal Loss into the original Complete IoU Loss for regression. These modifications enhance the model’s generalization capability. Consequently, YOLOv8 emerges as a superior algorithm within the YOLO series, surpassing the performance of most detection algorithms, including YOLOv6 [22] and YOLOR [23].
3 Improving the YOLOv8 algorithm
3.1 C2f-DSConv module
In order to further enhance the algorithm’s detection accuracy, this paper incorporates the DSConv (Dynamic Snake Convolution) [24] module proposed by Southeast University into the C2f module of the YOLOv8 backbone and replaces the two Conv modules in the original C2f module with the DSConv module. Traditional convolutional operations have a fixed receptive field, which can hinder capturing detailed features, particularly locally curved and elongated features, which are challenging to detect due to their limited presence in the image.
Inspired by deformable convolutions, DSConv introduces deformable offsets to traditional convolutions. To prevent the model from learning deformable offsets freely, which could lead to deviations in the receptive field, DSConv employs an iterative strategy. The position of each convolutional operation is determined by using all deformable offsets concerning the central grid as a reference, ensuring the continuity of attention. Figure 2 depicts the DSConv coordinate calculation and the diagram of the receptive field.
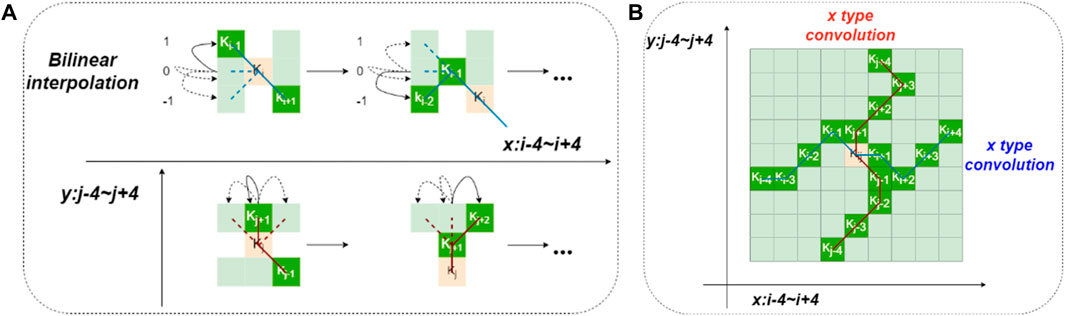
Figure 2. (A) Coordinate calculation diagram of DSConv, (B) DSConv receptive field.
Regarding the DSConv coordinate calculation, first, assuming a coordinate K with a size of 3 × 3 for the standard 2D convolution, where the central coordinate is
Next, deformable offsets are introduced to enhance the flexibility of the convolutional kernel in capturing the target’s complex geometric features. These offsets allow the receptive field to better align with the actual shape of the target. However, to prevent the receptive field from deviating excessively from the target due to unconstrained learning by the model, DSConv applies constraints to the deformable offsets in the x-axis and y-axis directions. Taking the x-axis direction as an example, each grid in K is represented as
In the y-axis direction, the grid coordinates are shown in Eq. (3):
As illustrated in Figure 2B, the dynamic adjustment of DSConv in the x and y directions allows its receptive field to cover a range of 9 × 9. Furthermore, DSConv can better adapt to elongated and curved structures from a structural perspective, allowing it to capture more important fine-grained features.
3.2 Addition of small object detection layer
Due to uncontrollable factors in industrial environments, aluminum plates often exhibit surface defects, including numerous small objects like holes and tiny scratches. In convolutional neural networks (CNNs), lower-level feature maps have larger dimensions and smaller receptive fields, providing abundant location information and fine-grained features. Conversely, higher-level feature maps have smaller dimensions and larger receptive fields, capturing semantic information [25].
In the original YOLOv8 architecture, the Neck module combines features extracted from the backbone and generates three distinct scales of feature maps to detect objects of varying sizes: 20 × 20, 40 × 40, and 80 × 80. Specifically, the 20 × 20 detects large target objects exceeding 32 × 32, the 40 × 40 medium-sized objects larger than 16 × 16, and the 80 × 80 smaller objects exceeding 8 × 8. When the downsampling factor of the neck is large, the deeper feature map will lose detailed information about the small target, which makes the small target sample difficult to predict.
However, the original YOLOv8 detection layers prove ineffective for detecting minute defects on industrial aluminum plates, often leading to missed detections. Therefore, an additional 160 × 160 detection layer is added at the end of the model to detect tiny objects smaller than 8 × 8. Figure 3 illustrates an upsampling operation added to the neck module after the second upsampling, resulting in a 160 × 160 feature map. This feature map is concatenated with the 160 × 160 feature map from the backbone module, creating a new prediction scale. The modified YOLOv8 model now comprises four detection layers, enhancing its capability to detect small objects.
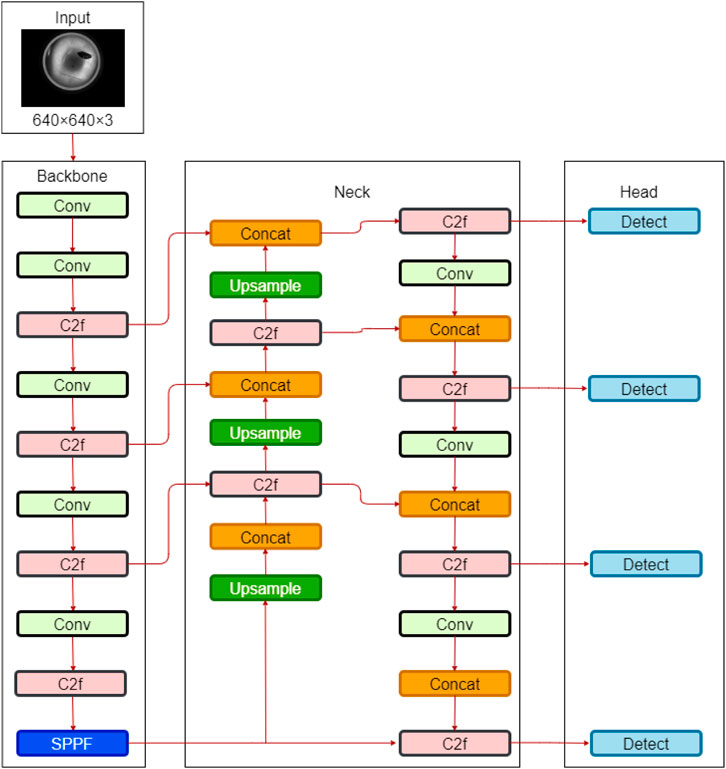
Figure 3. Architecture of the YOLOv8 mode with detection layer.
3.3 DyHead
YOLOv8 incorporates the decoupled head structure introduced in YOLOX [26] for classification and localization tasks. However, challenges arise in the industrial aluminum plate inspection process due to variations in defect scales, random changes in angles, and random distributions of defect positions, which the decoupled head struggles to address effectively.
Researchers have investigated how to enhance the detection performance of the Head, with improvements concentrated in three primary areas. 1) Scale perception capability by addressing the presence of targets or defects with vastly different scales within a single image. 2) Spatial perception capability enhances the head’s ability to handle targets with varying shapes and positions under different viewpoints. 3) Task perception capability enables the Head to adopt more suitable representation methods for diverse objects.
However, current research focuses on a single aspect of these capabilities. For instance, DyHead (Dynamic Head) [27], proposed by Microsoft, presents a novel dynamic detection Head that simultaneously addresses all three capabilities. Its structure illustrated in Figure 4 reveals that it leverages attention mechanisms in hierarchical, spatial, and channel dimensions, unifying the attention mechanisms of the detection Head, thereby improving detection accuracy and providing a unified analytical perspective for subsequent studies.
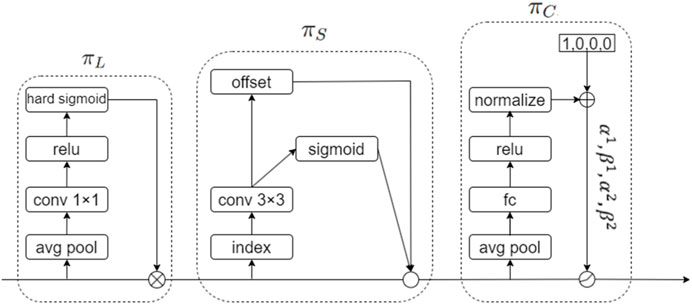
Figure 4. Structure of DyHead.
DyHead applies the following attention formula (Eq. 4) to the given feature tensor
where L, S, and C denote the dimensions of hierarchy, spatial extent, and channel, respectively,
3.4 MPDIoU
YOLOv8’s loss comprises two components: classification loss and regression loss. The classification loss evaluates the accuracy of the predicted class, while the regression loss assesses the precision of the predicted bounding box position. Besides, this paper introduces an improved regression loss function to enhance further the model’s detection accuracy. The original YOLOv8 model employs the Complete IoU Loss (CIoU) bounding box loss function [28], which incorporates the impact of aspect ratio based on DIoU. CIoU is formulated as Eqs 5–7:
where
However, the aspect ratio defined in CIoU is a relative value and does not reflect the actual relationship between the width and height of the ground truth and the predicted bounding boxes. This may hinder the model’s effective optimization of similarity. Moreover, the bounding box loss function loses effectiveness when the predicted and ground truth bounding boxes have the same aspect ratio but different widths and heights.
Therefore, this paper proposes a new bounding box loss function called MPDIoU (Minimum Point Distance Intersection over Union) [29], which measures the bounding box similarity based on the minimum point distance. Specifically, it directly minimizes the distances between the top-left and top-right points of the predicted and ground truth bounding boxes, thereby simplifying the computation process while considering the non-overlapping area, distance between center points, and width and height deviations. Therefore, MPDIoU can effectively replace CIoU as the bounding box loss function and improve the algorithm’s detection accuracy. The MPDIoU and MPDIoU LOSS are formulated as Eqs 9, 10:
where
The improved network incorporates DSConv into the C2f module of the backbone to enhance the network’s feature extraction capability. Additionally, a small object detection layer is added to enhance the network’s ability to detect low-resolution small objects, and DyHead is introduced to improve the performance of the detection Head. Finally, the original bounding box loss function is replaced with MPDIoU to improve the algorithm’s accuracy. Figure 5 depicts the structure of the improved YOLOv8-DSDM network.
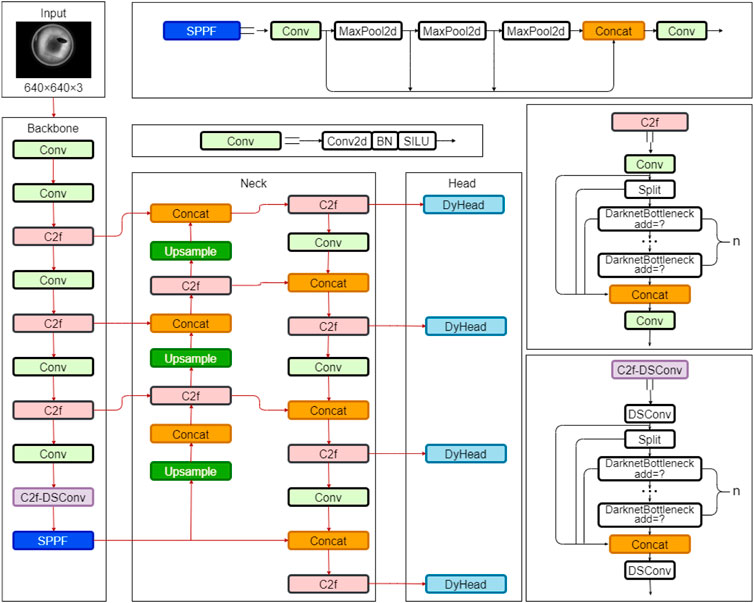
Figure 5. Architecture of the improved YOLOv8 algorithm model.
4 Experimental setup and results analysis
4.1 Dataset
The effectiveness of the YOLOv8n-DSDM algorithm is validated on an industrial aluminum sheet surface defect dataset obtained from the Paddle AI Studio Galaxy Community. All defect images are captured using Hikvision industrial cameras. The dataset comprises 400 images in jpg format, with a resolution of 640 × 480, and involves four types of defects: fold, crake, black, and hole. Each image can contain one or more types of defects, and the total number of defects in the dataset exceeds 1,000. As shown in Figure 6, the dataset sample images illustrate the various types of defects.
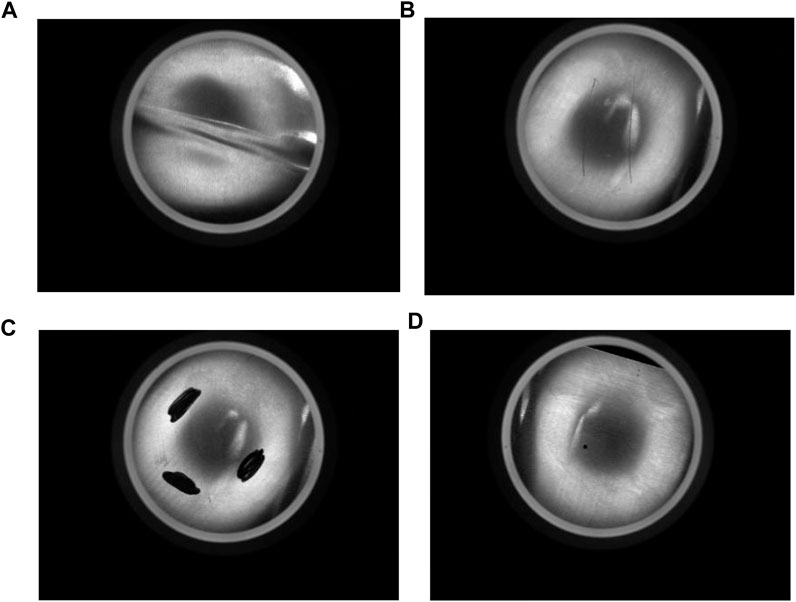
Figure 6. Industrial aluminum sheet surface defect Dataset. (A) Fold, (B) Crake, (C) Black, (D) Hole.
This study uses the MVTec Deep Learning Tool annotation software to annotate the four types of defects. The annotated defects are depicted in Figure 7, where yellow, blue, purple, and red represent a fold, crake, black, and hole, respectively.
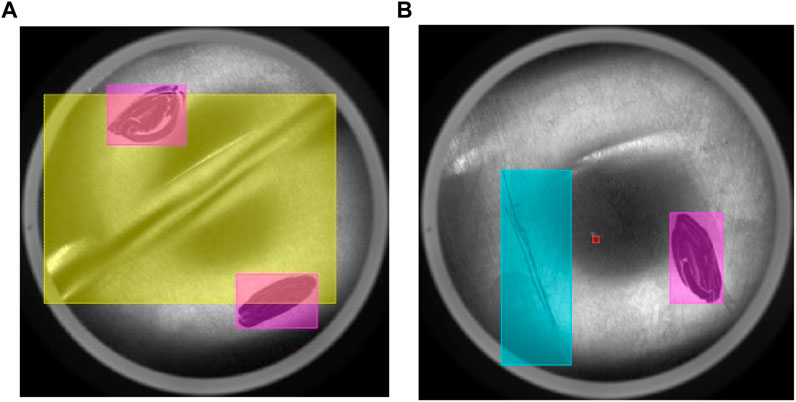
Figure 7. Annotated defects. (A) Fold and Black, (B) Black, Crake and Hole.
Furthermore, this study expands the original dataset through data augmentation techniques to overcome the limited sample size of the industrial aluminum sheet dataset and mitigate the risk of overfitting. These techniques include random brightness variation, scaling, Gaussian blur, Gaussian noise, horizontal flipping, random rotation, and vertical flipping. The augmented effects are illustrated in Figure 8. By applying these data augmentation techniques, the total sample size increases from 400 to 3,200, thereby enhancing data diversity and improving the robustness of the deep learning model. To ensure unbiased evaluation, the dataset is divided into training, validation, and testing sets based on a ratio of 7:1:2. Thus, the number of training, validation, and test sets is 2,240, 320, and 640, respectively.
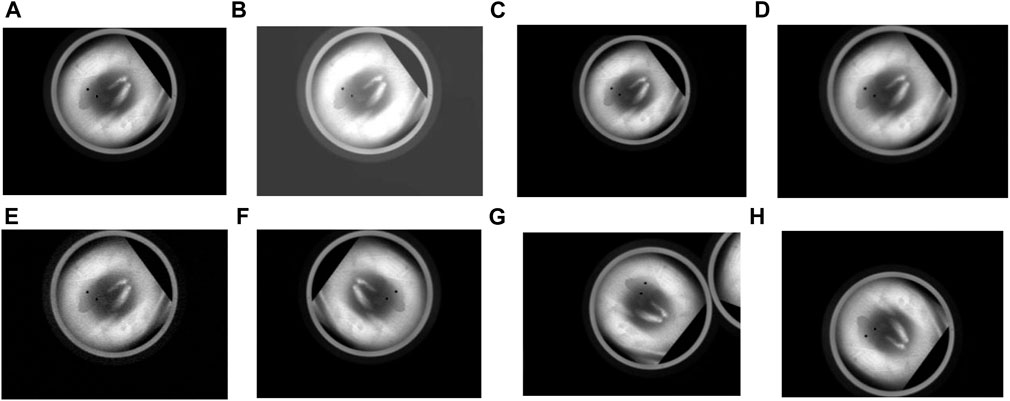
Figure 8. Visualization of the augmented data. (A) Original (B) Random brightness variation (C) Scaling (D) Gaussian blur (E) Gaussian noise (F) Horizontal flipping (G) Random rotation (H) Vertical flipping.
After data augmentation, the specific defect data statistics are presented in Table 1.
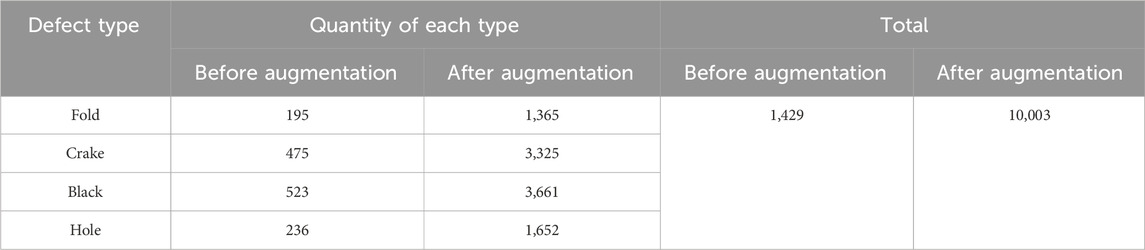
Table 1. Statistical analysis of defective industrial aluminum sheets.
4.2 Experimental environment and training parameters
The experimental environment and hardware configuration are reported in Table 2, and the training parameters are presented in Table 3. All experiments are conducted under the same experimental environment and parameter settings to ensure validity.
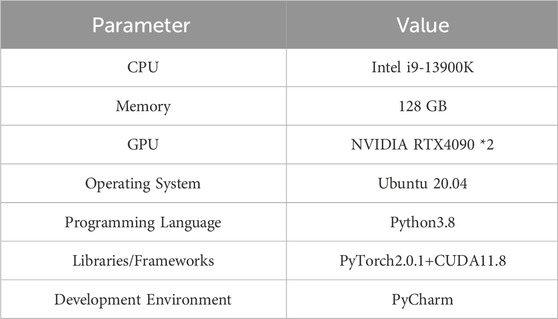
Table 2. Experimental environment parameters.
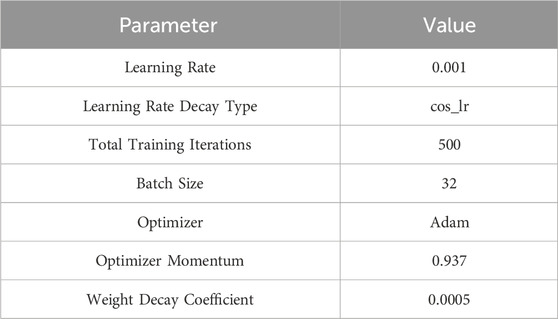
Table 3. Training parameters.
4.3 Evaluation metrics
This study uses four evaluation metrics, including mAP@0.5, single-image detection time T, FLOPs, and the number of parameters Params, which are defined as follows:
(1) mAP is the mean average precision, as shown in Eq. (11):
where
(2) The inference speed of the model is measured based on the single-image detection time T in milliseconds (ms).
(3) FLOPs, or floating-point operations per second, measure computational complexity, reflecting the model’s complexity.
(4) Params, or the number of parameters, refers to the total number of trainable parameters in the model, which indicates the model’s size.
4.4 Ablation experiments of integrating the C2f-DSConv module
Ablation experiments are also conducted on the divided test set to demonstrate the effectiveness of the proposed algorithm and the effectiveness of the C2f-DSConv module in detecting elongated and curved defects on the surface of industrial aluminum plates. In order to ensure the validity of the experiments, the experimental environment and parameter settings were the ones described in the previous section. Table 4 reports the corresponding results.
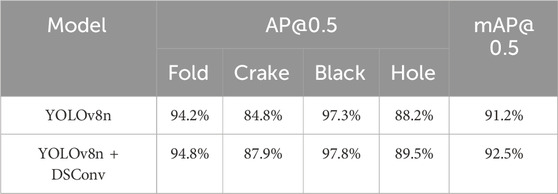
Table 4. Ablation experiments of the C2f-DSConv module.
According to the experimental results presented in Table 4, incorporating the C2f-DSConv module significantly improves the detection accuracy for various defect types. Compared to the baseline model, the accuracy for wrinkles, scratches, dirt, and holes increases by 0.6%, 3.1%, 0.5%, and 1.3%, respectively. Notably, the improvement in scratch detection is the most pronounced, which is important, as scratches on industrial aluminum sheets often exhibit irregular, elongated, and curved shapes, with slender structures occupying a relatively small portion of the image and having limited pixel representation. Moreover, these structures are susceptible to interference from complex backgrounds. Therefore, the experimental results demonstrate that integrating DSConv into the C2f module effectively enhances the model’s ability to detect slender and subtle defects. In order to more intuitively demonstrate the effectiveness of adding the C2f-DSConv module to Crake defects, this paper visualizes the feature map in the form of a heat map, which can help us intuitively understand which regions are most important for the model’s decision-making. The heat map detection effect is shown in Figure 9. As can be seen from the figure, the model with the C2f-DSConv module pays more attention to the defective part and gives it more weight.
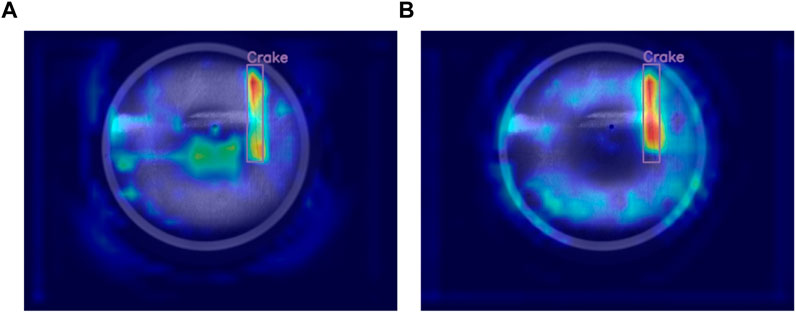
Figure 9. Comparison of the heat map effect of the C2F-DSConv module, (A) YOLOv8, (B) YOLOv8n + C2f-DSConv.
4.5 Ablation experiments of adding small target detection layer
The following ablation experiments assess the efficacy of the YOLOv8 algorithm enhanced with a small target detection layer. The experimental setup and parameter configurations are the ones previously described. The corresponding findings are reported in Table 5.
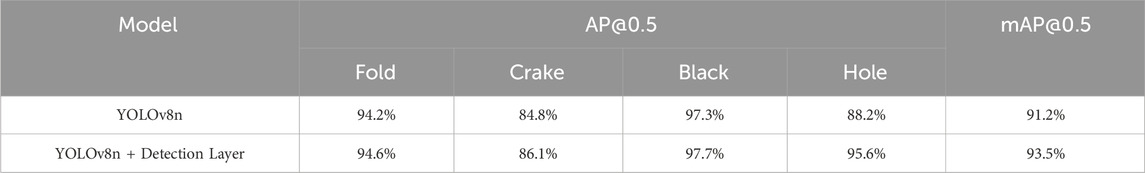
Table 5. Ablation experiments of small target detection layer.
In this study, a 160 × 160 small target detection layer is incorporated into the original set of detection layers (20 × 20, 40 × 40, and 80 × 80) in YOLOv8 to identify targets smaller than 8 × 8. The experimental results presented in Table 5 indicate that compared to the original model, the average accuracy for detecting wrinkles increased by 0.4%, scratches by 1.3%, dirt by 0.4%, and holes by 7.4%, with the most notable enhancement observed in hole detection. This outcome can be attributed to the predominance of hole sizes smaller than 8 × 8 on the surface of industrial aluminum sheets, which the original three detection layers struggle to identify effectively. Consequently, these results demonstrate that adding a small target detection layer can significantly enhance the model’s detection capability for small targets. At the same time, to more intuitively verify the effectiveness of the hole after adding a small target detection layer, the feature map is displayed in the form of a heat map, as illustrated in Figure 10. As seen in the figure, the model gives more weight to the background before adding the small object detection layer, and after adding the detection layer, the red part of the heat map is mostly concentrated in the defect part to be detected.
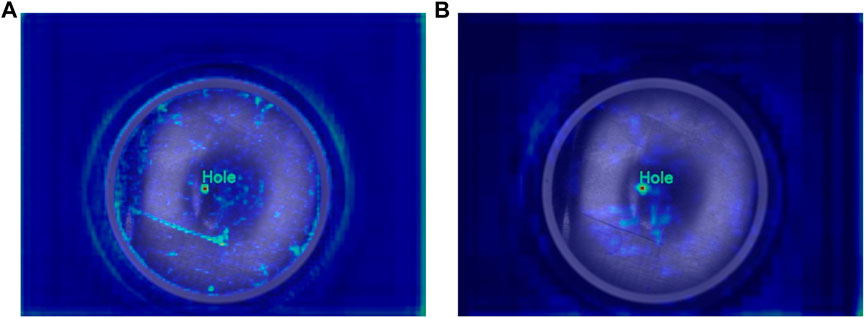
Figure 10. Comparison of the heat map effect after adding the detection layer, (A) YOLOv8, (B) YOLOv8n + detection layer.
4.6 Ablation experiments
The proposed model introduces four enhancements to the YOLOv8 model. Hence, six ablation experiments evaluate the effect of these enhancements, including the original model experiment, individual implementations of the four enhancements, and their simultaneous integration. The experimental environment and parameter configurations remained constant throughout the trials, and the corresponding findings are summarized in Table 6.
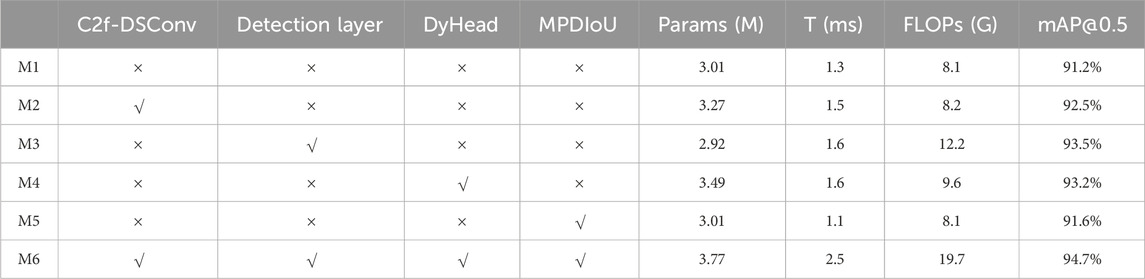
Table 6. Ablation Experiments of the Proposed Improvement Methods. (√ denotes the use of a specific method and × its non-utilization).
M1 represents the experimental result of the original YOLOv8n model, serving as the benchmark for comparing with other models. It achieves a mAP@0.5 of 91.2%. M2 incorporates the C2f-DSConv module, yielding a 1.3% increase in mAP@0.5 with a marginal rise in the number of parameters, single-frame detection time, and computational load. M3 introduces a small target detection layer, reducing 0.09 M parameters, a 0.3 ms increase in single-frame detection time, and a 4.1G rise in computational load while enhancing mAP@0.5 by 2.3%. M4 integrates the DyHead detection head, leading to a parameter increase of 0.48 M, a single-frame detection time increase of 0.3 ms, and a 1.5G boost in computational load, resulting in a mAP@0.5 increase of 2%. M5 substitutes the boundary box loss function with MPDIoU, maintaining the parameter count and computational load, shortening the single-frame detection time by 0.2 ms, and elevating mAP@0.5 by 0.4%. M6 combines all four improvement methods simultaneously, resulting in a parameter increase of 0.76 M, a 1.2 ms single-frame detection time increase, an 11.6G computational load increase, and the highest mAP@0.5 value of 94.7%. The improved M6 model sacrifices several parameters, single-frame detection time, and computation to provide the highest mAP@0.5 of 94.7%.
4.7 Comparison of detection effects
In order to visually demonstrate the detection performance of the enhanced YOLOv8-DSDM model, a comparative analysis is conducted between the original model and the upgraded model using the test environment and parameter settings reported in Table 7. The corresponding results highlight that the improved YOLOv8-DSDM exhibits enhanced detection accuracy across four types of defects. Specifically, crease, scratch, dirt, and hole detection accuracy increased by 1.5%, 2.9%, 1.9%, and 8%, respectively. Consequently, the average mean accuracy mAP@0.5 increases by 3.5%.
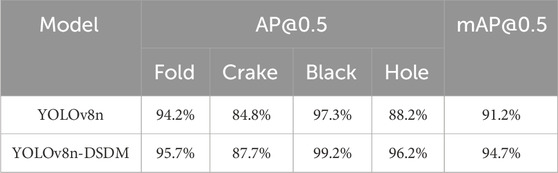
Table 7. Ablation experiments of the improved model.
The YOLOv8 and YOLOv8n-DSDM models are challenged on the test set, with the comparative results illustrated in Figure 11. The visual display indicates that the original YOLOv8 model experiences missed detections and imprecise bounding box localization. In contrast, the enhanced model effectively identifies defects overlooked by the original model, leading to closely aligned detection boxes with the targets. Consequently, the YOLOv8n-DSDM model demonstrates an overall superior detection performance.
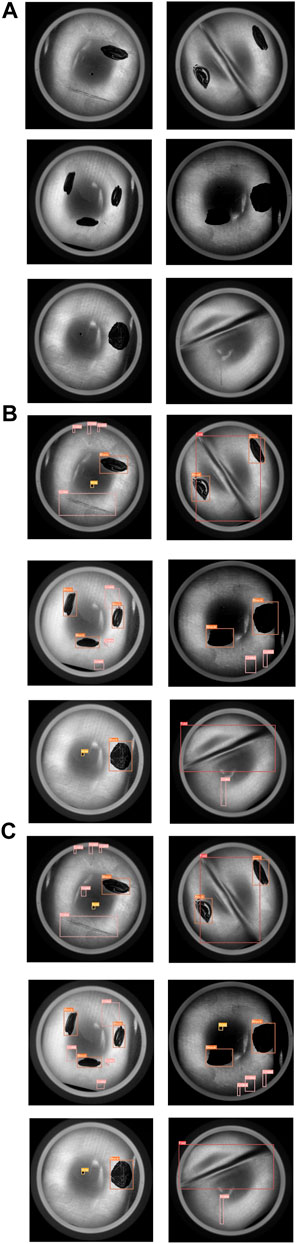
Figure 11. Detection performance. (A) Test image, (B) YOLOv8n, (C) YOLOv8-DSDM.
4.8 Comparison with other mainstream object detection algorithms
To assess further the effectiveness of the proposed YOLOv8-DSDM algorithm, comparative experiments are conducted under consistent conditions using an industrial aluminum sheet surface defect dataset. The evaluated algorithms are SSD, Faster R-CNN, DETR [30], RT-DETR [31], YOLOv5 [32], YOLOv6 [22], YOLOv7 [33], YOLOv7-tiny [34], and YOLOv8, with the corresponding results presented in Table 8.
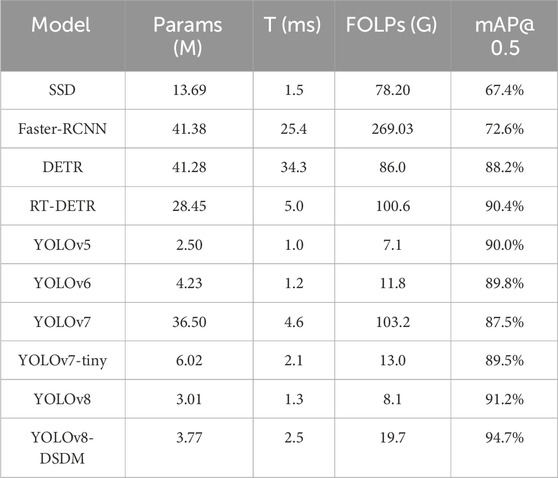
Table 8. Comparative experiments with other algorithm models.
The mAP@0.5 of the SSD algorithm is 67.4%, with a parameter size of 13.69 M. The single image detection time is 1.5 ms, and the computational complexity is 78.20G. The detection accuracy of SSD is relatively subpar, leaving room for optimizing its computational complexity. Comparatively, while the Faster R-CNN algorithm enhances the mAP@0.5 by 5.2%, unlike SSD, it has a considerable increase in parameter size to 27.69 M, accompanied by a surge in single image detection time to 23.9 ms and a substantial rise in computational complexity to 190.83 G. The DETR algorithm, on the other hand, yields a noteworthy 20.8% improvement in mAP@0.5 relative to SSD, with an increase in parameter size of 27.59 M, an increase in single image detection time of 32.8 ms, and an increase in computational complexity of 7.80G. RT-DETR has been optimized based on DETR to achieve real-time object detection, and its mAP@50% can reach 90.4%, and the single detection time is 5 ms. However, the parameters and calculations are still large, which are 28.45 M and 100.6G, respectively. These algorithms have large computational and parameter sizes, making them unsuitable for industrial applications.
Among the YOLO series algorithms, YOLOv5 has the optimal parameter size, single image detection time, and computational complexity, with values of 2.50 M, 1.0 ms, and 7.1G, respectively. YOLOv8 has the highest mAP@0.5, reaching 91.2%. Compared to YOLOv5, YOLOv8 slightly increases mAP@0.5, parameter size, single image detection time, and computational complexity of 1.2%, 0.51 M, 0.3 ms, and 1.0G, respectively. The improved YOLOv8-DSDM algorithm, compared to the original YOLOv8 algorithm, achieves a 3.5% increase in mAP@0.5, reaching 94.7%, at the cost of a parameter size of 0.76 M, single image detection time of 1.2 ms, and computational complexity of 11.6G. In order to see the performance of the proposed model YOLOv8-DSDM more intuitively, the PR curves of each comparison model are given in this paper, as shown in Figure 12. In summary, the proposed YOLOv8-DSDM algorithm outperforms current mainstream algorithms in terms of comprehensive performance.
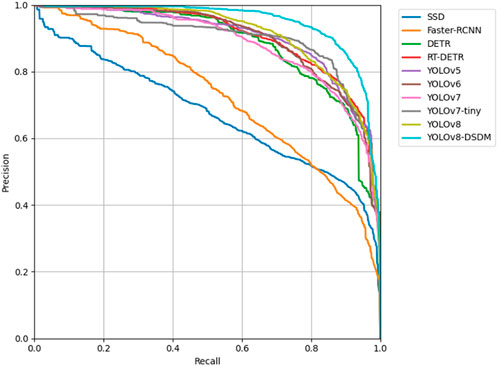
Figure 12. PR curve comparison diagram.
5 Conclusion
This study proposes an enhanced algorithm model, YOLOv8-DSDM, specifically designed to detect defects on industrial aluminum surfaces. This novel model aims to overcome the challenges of low detection accuracy and slow processing speeds associated with conventional methods. Indeed, incorporating DSConv into the C2f module improves the network’s feature extraction capacity. Additionally, introducing a 160 × 160 small object detection layer significantly enhances the network’s capability to identify small-scale targets. Substituting the original detection head with the dynamic detection head (DyHead) enhances the expressive capacity of the detection head. Moreover, by replacing the original bounding box loss function with the MPDIoU method, we bolster the model’s ability to regress bounding boxes while enhancing detection speed. Our experimental findings unequivocally illustrate the substantial advancements in the detection performance of the proposed model. Subsequent efforts will refine the network structure to elevate detection accuracy and streamline model complexity.
Data availability statement
The original contributions presented in the study are included in the article/Supplementary Material, further inquiries can be directed to the corresponding authors.
Author contributions
LW: Conceptualization, Formal Analysis, Investigation, Methodology, Software, Writing–original draft. GZ: Conceptualization, Data curation, Investigation, Methodology, Project administration, Writing–original draft. WW: Formal Analysis, Funding acquisition, Supervision, Validation, Writing–review and editing. JC: Conceptualization, Data curation, Formal Analysis, Methodology, Resources, Validation, Writing–original draft. XJ: Data curation, Funding acquisition, Project administration, Resources, Supervision, Visualization, Writing–review and editing. HY: Funding acquisition, Investigation, Supervision, Validation, Visualization, Writing–review and editing. ZH: Project administration, Resources, Software, Visualization, Writing–review and editing.
Funding
The author(s) declare that financial support was received for the research, authorship, and/or publication of this article. This research was funded in part by the National Key Research and Development Program of China (grant number 2018YFA0902900), the Basic Research Program of Guangzhou City of China (grant number 202201011692), and the Guangdong Water Conservancy Science and Technology Innovation Project(grant number 2023-03).
Acknowledgments
The authors would like to express their thanks to the Guangzhou Institute of Advanced Technology for helping them with the experimental characterization.
Conflict of interest
The authors declare that the research was conducted in the absence of any commercial or financial relationships that could be construed as a potential conflict of interest.
Publisher’s note
All claims expressed in this article are solely those of the authors and do not necessarily represent those of their affiliated organizations, or those of the publisher, the editors and the reviewers. Any product that may be evaluated in this article, or claim that may be made by its manufacturer, is not guaranteed or endorsed by the publisher.
References
1. Redmon J, Farhadi A. YOLO9000: better, faster, stronger. In: Proceedings of the IEEE conference on computer vision and pattern recognition (2017). p. 7263–71.
2. Liu W, Anguelov D, Erhan D, Szegedy C, Reed S, Fu CY, et al. SSD: single shot MultiBox detector. In: Computer Vision–ECCV 2016: 14th European Conference; October 11–14, 2016; Amsterdam, The Netherlands. Springer International Publishing (2016). p. 21–37. doi:10.1007/978-3-319-46448-0_2
3. Girshick RB, Donahue J, Darrell T, Malik J. Rich feature hierarchies for accurate object detection and semantic segmentation. CoRR, abs (2013) 1311:2524. arxiv preprint arxiv:1311.2524.
4. Girshick R. Fast r-cnn. In: Proceedings of the IEEE international conference on computer vision (2015). p. 1440–8.
5. Ren S, He K, Girshick R, Sun J. Faster r-cnn: towards real-time object detection with region proposal networks. Adv Neural Inf Process Syst (2015) 28. doi:10.1109/tpami.2016.2577031
6. Dai J, Li Y, He K, Sun J. R-fcn: object detection via region-based fully convolutional networks. Adv Neural Inf Process Syst (2016) 29. doi:10.5555/3157096.3157139
7. Sun J, Liu G, Liu H. Fine-grained detection of pin defects based on improved R-FCN algorithm and class activation diagram. Guangdong Electric Power (2023)) 36(06):50–7.
8. Huang R, Wang J, Zhang D, Sun W. Surface defect detection of aluminum profile based on improved Faster R-CNN. J Beijing Inf Sci Technology University(Natural Sci Edition) (2021) 36(05):57–62. doi:10.16508/j.cnki.11-5866/n.2021.05.010
9. Xin W, Yingzi T, Chen L, Zhang G. Improved detection method of rolled steel surface defect of YOLOv3. Ind Control Comput (2023) 36(08):85–7.
10. Li S, Guo S, Han Z, Kou C, Huang B, Luan M. Aluminum surface defect detection method based on a lightweight YOLOv4 network. Scientific Rep (2023) 13(1):11077. doi:10.1038/s41598-023-38085-x
11. Xu H, Yu H. Industrial aluminum sheet defect detection based on improved YOLO model. Combined machine tool automatic Process Technol (2023)(09) 106–111. doi:10.13462/j.cnki.mmtamt.2023.09.023
12. Han K, Wang Y, Tian Q, Guo J, Xu C, Xu C, et al. Ghostnet: more features from cheap operations. In: Proceedings of the IEEE/CVF conference on computer vision and pattern recognition (2020). p. 1580–1589.
13. Tang Y, Fang K, Yang S, Wang C, Li Z. Research on visual inspection method of cylinder head forging defects improved by YOLOv5. Manufacturing Technol machine tool (2023)(08) 166–173. doi:10.19287/j.mtmt.1005-2402.2023.08.024
14. Dou L, Yin X, Ai K, Ma Y. Insulator defect detection algorithm based on improved YOLO. Electr Technology (2023)(21) 30–35. doi:10.19768/j.cnki.dgjs.2023.21.008
15. Zhou Y, Yan Y, Chen H, Pei S. Defect detection of photovoltaic cells based on improved YOLOv8. Adv Laser optoelectronics (2024) 1–17. Available from: http://kns.cnki.net/kcms/detail/31.1690.tn.20230821.1446.128.html.
16. Yong K, Shu Z, Yu J, Yu Z. Zero-shot discrete hashing with adaptive class correlation for cross-modal retrieval. Knowledge-Based Syst (2024) 295:111820. doi:10.1016/j.knosys.2024.111820
17. Li L, Shu Z, Yu Z, Wu XJ. Robust online hashing with label semantic enhancement for cross-modal retrieval. Pattern Recognition (2024) 145:109972. doi:10.1016/j.patcog.2023.109972
18. Bai Y, Shu Z, Yu J, Wu XJ. Proxy-based graph convolutional hashing for cross-modal retrieval. IEEE Trans Big Data (2023) 1–15. doi:10.1109/tbdata.2023.3338951
19. Shu Z, Bai Y, Zhang D, Yu J, Yu Z, Wu XJ. Specific class center guided deep hashing for cross-modal retrieval. Inf Sci (2022) 609:304–318. doi:10.1016/j.ins.2022.07.095
20. Shu Z, Yong K, Yu J, Gao S, Mao C, Yu Z. Discrete asymmetric zero-shot hashing with application to cross-modal retrieval. Neurocomputing (2022) 511:366–379. doi:10.1016/j.neucom.2022.09.037
21. Wang CY, Bochkovskiy A, Liao HYM. YOLOv7: trainable bag-of-freebies sets new state-of-the-art for real-time object detectors. In: Proceedings of the IEEE/CVF Conference on Computer Vision and Pattern Recognition (2023). p. 7464–7475.
22. Li C, Li L, Jiang H, Weng K, Geng Y, Li L, et al. YOLOv6: a single-stage object detection framework for industrial applications (2022). arxiv preprint arxiv:2209.02976.
23. Wang CY, Yeh IH, Liao HYM. You only learn one representation: unified network for multiple tasks (2021). arxiv preprint arxiv:2105.04206.
24. Qi Y, He Y, Qi X, Zhang Y, Yang G. Dynamic snake convolution based on topological geometric constraints for tubular structure segmentation. In: Proceedings of the IEEE/CVF International Conference on Computer Vision (2023). p. 6070–6079.
25. Wei C, Yang R, Liu Z, Lan R, Sun X, Luo X, et al. YOLOv8 road scene target detection method with double-layer routing attention. J Graphics (2023) 44(6):1104.
26. Ge Z, Liu S, Wang F, Li Z, Sun J. Yolox: exceeding yolo series in 2021 (2021). arxiv preprint arxiv:2107.08430.
27. Dai X, Chen Y, Xiao B, Chen D, Liu M, Yuan L, et al. Dynamic head: unifying object detection heads with attentions. In: Proceedings of the IEEE/CVF conference on computer vision and pattern recognition (2021). p. 7373–7382.
28. Zheng Z, Wang P, Ren D, Liu W, Ye R, Hu Q, et al. Enhancing geometric factors in model learning and inference for object detection and instance segmentation. IEEE Trans cybernetics (2021) 52(8):8574–8586. doi:10.1109/tcyb.2021.3095305
29. Siliang M, Yong X. MPDIoU: a loss for efficient and accurate bounding box regression (2023). arXiv preprint arXiv:2307.07662.
30. Carion N, Massa F, Synnaeve G, Usunier N, Kirillov A, Zagoruyko S. End-to-end object detection with transformers. In: European conference on computer vision. Cham: Springer International Publishing (2020). p. 213–229.
31. Liang J, Kong R, Ma R, Zhang J, Bian X. Aluminum surface defect detection algorithm based on improved YOLOv5. Adv Theor Simulations (2023) 7:2300695. doi:10.1002/adts.202300695
32. Zhao Y, Lv W, Xu S, Wei J, Wang G, Dang Q, et al. Detrs beat yolos on real-time object detection (2023). arxiv preprint arxiv:2304.08069.
33. Dou Z, Hu C, Li Q, Zheng L. Improved surface defect detection algorithm of small sample steel plate in YOLOv7. Computer Eng Appl (2023) 59(23):283–292. doi:10.3778/j.issn.1002-8331.2306-0138
Keywords: defect detection, YOLOv8 algorithm, C2f-DSConv module, DyHead dynamic detection head network, small target detection layer
Citation: Wang L, Zhang G, Wang W, Chen J, Jiang X, Yuan H and Huang Z (2024) A defect detection method for industrial aluminum sheet surface based on improved YOLOv8 algorithm. Front. Phys. 12:1419998. doi: 10.3389/fphy.2024.1419998
Received: 19 April 2024; Accepted: 31 May 2024;
Published: 24 June 2024.
Edited by:
Zhenqiu Shu, Kunming University of Science and Technology, ChinaReviewed by:
Lei Yang, Zhengzhou University, ChinaTeng Sun, Kunming University of Science and Technology, China
Copyright © 2024 Wang, Zhang, Wang, Chen, Jiang, Yuan and Huang. This is an open-access article distributed under the terms of the Creative Commons Attribution License (CC BY). The use, distribution or reproduction in other forums is permitted, provided the original author(s) and the copyright owner(s) are credited and that the original publication in this journal is cited, in accordance with accepted academic practice. No use, distribution or reproduction is permitted which does not comply with these terms.
*Correspondence: Weijun Wang, d2oud2FuZ0BnaWF0LmFjLmNu; Zucheng Huang, emMuaHVhbmdAZ2lhdC5hYy5jbg==