 Yogita Padwal
 Ratna Chauhan
 Rajani Panchang1
 Suresh W. Gosavi
- 1Department of Environmental Science, Savitribai Phule Pune University (Formerly University of Pune), Pune, India
- 2Applied Medical Science Department, Community College, King Saud University, Riyadh, Saudi Arabia
- 3Department of Physics, Savitribai Phule Pune University (Formerly University of Pune), Pune, India
- 4School of Chemistry, University of Melbourne, Melbourne, VIC, Australia
- 5Photocatalysis International Research Centre, Research Institute for Science and Technology, Tokyo University of Science, Chiba, Japan
In this study, we elucidate the synthesis and characterization of molybdenum (Mo) doped zinc oxide (ZnO) nanoflowers (Mo-ZnO@NF) fabricated via a hydrothermal approach, showcasing their potential application in hydrogen generation and dye degradation. The successful synthesis of these nanoflowers is achieved through the deliberate incorporation of Mo ions into the ZnO lattice, yielding a distinctive hierarchical flower-like morphology. Comprehensive structural, morphological, and optical analyses are conducted employing a suite of analytical techniques, encompassing XRD, Raman, FESEM, and UV-Visible spectroscopy. XRD analysis confirms the retention of the hexagonal wurtzite crystal structure, accompanied by discernible peak shifts indicative of Mo ion integration. FESEM imaging further elucidates the flower-like architecture of Mo-ZnO, underscoring the intricate morphological features. Photocatalytic assessment reveals the remarkable efficacy of Mo-ZnO@NF, as evidenced by an unprecedented hydrogen evolution rate of 2024 mmol/h/g and 97% Methylene Blue (MB) dye degradation within a mere 40-minute timeframe. Furthermore, a comparative investigation between pristine ZnO and varying Mo doping concentrations (ranging from 1% to 5%) underscores the optimal doping concentration of 1% Mo in ZnO. This concentration threshold is shown to engender superior photocatalytic performance, potentially attributed to enhanced charge carrier separation and increased surface area conducive to catalytic reactions. Overall, this study not only advances our understanding of Mo-ZnO@NF nanostructures but also elucidates key insights into optimizing their photocatalytic efficacy for diverse environmental remediation applications.
Highlights
• Hydrothermal synthesis yields Mo-doped ZnO with porous nanoflowers morphology
• XRD, Raman and XPS analyses ensure Mo doping into the ZnO lattice
• High hydrogen evolution rate (2024 mmol/h/g) and rapid dye degradation (97% in 40 mins) showcase superior efficacy
• Optimal doping concentration (1% Mo in ZnO) enhances performance via improved charge carrier separation and increased surface area
• Study offers valuable guidance for environmental remediation and hydrogen generation advancements
1 Introduction
Hydrogen generation and dye degradation are two critical areas in environmental and energy research [1], both holding immense significance for sustainable development and pollution mitigation. Hydrogen, touted as the “fuel of the future,” offers a clean and renewable energy source with the potential to revolutionize various sectors [2], including transportation and power generation. Its production through environmentally benign processes, such as photocatalytic water splitting, holds promise for addressing the escalating energy demands while mitigating carbon emissions. On the other hand, dye degradation plays a pivotal role in environmental remediation, particularly in treating wastewater from textile, pharmaceutical, and chemical industries. The discharge of synthetic dyes into water bodies poses severe ecological hazards, including water contamination and ecosystem disruption [3, 4]. Photocatalytic degradation, employing semiconductor-based materials under light irradiation, emerges as a sustainable and effective approach for mitigating this pollution by breaking down organic pollutants into non-toxic byproducts. Both hydrogen generation and dye degradation hinge on the efficient utilization of photocatalytic materials, wherein zinc oxide (ZnO) emerges as a prominent candidate due to its favorable properties such as wide bandgap, high chemical stability, and photocatalytic activity under solar irradiation Zinc oxide (ZnO) particles have garnered more attention among researchers owing to their UV absorption capabilities [5, 6]. Additionally, zinc oxide’s high photosensitivity, which facilitates the degradation of a wide range of pollutants [7]. ZnO’s wide band gap property further positions it as a promising material for photocatalysis applications [8, 9]. Zinc oxide (ZnO) exhibits characteristics of N-type semiconductor with band gap 3,37 eV, performing superior photocatalytic activity in UV-irradiation. However, efficiency of ZnO standalone material may be limited under certain conditions. In photocatalytic applications, zinc oxide (ZnO) encounters two significant limitations: the generation of electron-hole pairs under UV radiation and the rapid recombination rate of photoexcited charge carriers [10, 11]. To address this challenge, the extension of ZnO’s optical response is necessary, which can be achieved through the doping of metals or non-metals into the ZnO lattice [12, 13]. Among various dopants, molybdenum (Mo) has been identified as particularly suitable, offering benefits when incorporated into the ZnO matrix. Mo can donate four electrons to the free carriers, facilitated by the substantial difference in vacancies between Mo+6 ions and replaced Zn+2 ions. Furthermore, the ionic radius of Mo+6 closely matches that of Zn+2, enabling effective substitution within the ZnO lattice. Consequently, even a minute quantity of Mo doping in ZnO can yield a substantial number of free carriers, thereby mitigating ion scattering effects [6, 14–16].
Currently, significant research efforts have focused on enhancing the photodegradation ability of ZnO through various dopants. For instance, Cu-doped ZnO has been explored for the degradation of Methyl Orange [17], while Aluminum-doped zinc oxide has been investigated for the degradation of indigo carmine and azo carmine G dyes [18]. Additionally, Ta-doped ZnO nanoparticles have been utilized for the photodegradation of methylene blue [19], and Co–ZnO has been evaluated for its photocatalytic activity in the degradation of Methyl Orange [20]. Moreover, silver-doped ZnO has been studied for both the photodegradation of methyl orange and its bactericidal activity [21], while Mg-doped ZnO has been employed for the photodegradation of rhodamine B [22]. These endeavors represent a concerted effort to improve the efficacy of ZnO-based photocatalysis for environmental remediation and other applications.
This research focus to explore the synthesis and characterization of molybdenum-doped zinc oxide nanoflowers (Mo-ZnO@NF) and evaluate their efficacy as photocatalysts for hydrogen generation and dye degradation. Through a organized investigation of the structural, morphological, and optical properties of Mo-ZnO@NF, coupled with comprehensive photocatalytic performance assessments, this research favours to contribute to the advancement of sustainable technologies for energy production and environmental remediation.
2 Experimental methods
2.1 Materials
Zinc acetate (ZnC4H6O4) pure (CDH Laboratory), Hexamine (C6H12N4) Extra Pure (Loba Chemie PVT. LTD.), sodium hydroxide (NaOH)AR grade (Thomas Baker), Cetyltrimethyl Ammonium Bromide (CTAB) LR grade (SDFC Ltd.) and Ammonium Molybdate ((NH4)6Mo7O24) tetrahydrate (Qualigens, Thermo Fisher Scientific India Pvt. Ltd.) distilled water and ethanol were used as received without further purifications.
2.2 Synthesis
Mo-ZnO@NF was synthesized by adding 1-5 wt% ammonium molybdate to a 0.1 M zinc acetate solution prepared in 150 mL distilled water. To this solution, 0.2 M hexamine and 1 g of Cetyltrimethyl Ammonium Bromide (CTAB) were added. The solution was stirred at room temperature, and 1 M NaOH solution was gradually added drop by drop to maintain a pH of 8–9. After stirring for 30 min, the solution was transferred into Teflon-lined sealed stainless-steel autoclaves and placed in an oven at 180 °C for 12 h. The resulting solution was washed with distilled water and ethanol several times, followed by drying in an oven at 70 °C for 24 h. The dried material was then subjected to calcination for 1 h at 300 °C in a muffle furnace. Plain ZnO was prepared using the same method without adding ammonium molybdate. The synthesized substance was subsequently utilized for further analysis and practical applications. Scheme 1 illustrates the synthesis process of Mo-ZnO@NF.
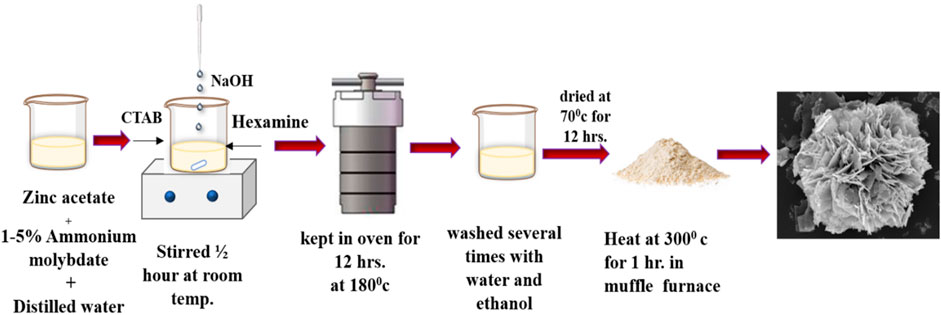
Scheme 1. Synthesis procedure of Mo-ZnO@NF
2.3 Characterization
The crystalline phase identification of the synthesized Mo-ZnO@NF nanomaterials is analysed by X-ray diffractometer using a Bruker D-8 Advance XRD, employing CuKα radiation (λ = 1.54 Å) within a 2θ range of 20°–80°. Uv-Visible spectra recorded using a Jasco V-750 spectrophotometer. Photoluminescence (PL) emission spectra were obtained using a Shimadzu RF-5301pc spectroflurophotometer. Raman spectroscopic analysis was conducted using a Renishaw InVia Raman microscope to differentiate molecular vibrations. Surface morphology was examined via field emission scanning electron microscopy (FE-SEM), utilizing a Hitachi S-4800 instrument at accelerating voltages of 5 kV and 10 kV. For detailed morphological, structural analysis and elemental mapping, high-resolution transmission electron microscopy (HRTEM) was employed, using a JEOL JEM 2100 PLUS instrument. Surface chemistry was analysed using X-ray photoelectron spectroscopy (XPS) with a PHI 5000 Versa Probe III photoelectron spectrometer. The surface area of the material was determined through BET surface area analysis using Autosorbi Quantachrome Inc., United States of America.
2.4 Hydrogen generation
The photocatalytic reaction was conducted in a specialized 70 mL cylindrical quartz reactor, precisely sealed to prevent any exchange of air, and equipped with a cooling jacket for efficient water circulation. The solar irradiation intensity, averaging around 145,000 Lux, was carefully controlled. In each photocatalytic experiment, photocatalyst (15 mg) was dispersed within a 25 mL aqueous solution containing 20% methanol (v/v). To ensure homogenous distribution of the photocatalyst, the remaining 45 mL of the reactor’s volume was sealed with a rubber septum and subjected to ultrasonication for 5 min. Prior to initiating the reaction, the reaction mixture underwent nitrogen gas purging to eliminate any residual gases within the reactor. Gas chromatography (GC) was employed to analyse the composition of gases within the reactor’s free space both before and after exposure to solar irradiation, with analyses performed immediately and at specific time duration.
2.5 Degradation of methylene blue (MB) dye
Mo-ZnO@NF was employed to evaluate its catalysis activity through the degradation of methylene blue (MB)dye. The experiment involves, dispersion of catalyst (25 mg) in a 50 mL solution of MB (10 ppm) dye with continuous stirring under sunlight. Throughout the photocatalytic reaction, 2 mL samples were extracted from the flask at the specified time interval (10 min), followed by centrifugation to eliminate suspended catalyst particles. The absorbance of each sample was then measured using a UV-Vis spectrophotometer to determine measure the absorption intensities of MB.
The photocatalytic degradation efficiency of MB in presence of ZnO and Mo-ZnO@NF were determined by using the following Eq. 1a:
where Co and Ct represent the original and final concentration of MB before and after photo-catalytic degradation, respectively.
3 Results and discussion
3.1 X-ray diffraction
The structural properties of both ZnO and 1%–5% Mo-ZnO@NF samples were analyzed using X-ray diffraction patterns (XRD), as depicted in Figure 1A. The diffraction peaks observed at specific angles, such as 31.74°, 34.41°, 36.25°, 47.49°, 56.65°, 62.89°, 66.43°, 68.02°, and 69.08°, correspond to the crystallographic planes (100), (002), (101), (102), (110), (103), (200), (112), and (201), respectively. These peaks align with the wurtzite structure of ZnO (hexagonal phase) according to the Joint Committee on Powder Diffraction Standards (JCPDS) database reference number 36–1,451. Notably, no distinct Mo-related peaks are obvious, likely attributable to the substitution of Mo6+ ions into the Zn2+ positions within the ZnO lattice. Given the comparable ionic radii of Mo6+ (0.062 nm) and Zn2+ (0.074 nm), the observed shift in the (101) and (100) planes towards lower angles further supports the incorporation of Mo6+ ions into the Zn2+ sites [23]. The shifts in XRD peaks and reduced intensity post-molybdenum (Mo) doping in zinc oxide (ZnO) can be attributed to lattice distortion, phase formation, substitution of Mo ions for Zn, strain induction, and defect generation (Figure 1B). In X-ray diffraction (XRD), peak shifts result from changes in lattice parameters or crystal structure. Initially, small Mo additions cause significant shifts as they disrupt the lattice. However, with increasing Mo percentage, saturation occurs as the lattice accommodates more Mo atoms, leading to diminishing effects on lattice parameters and reduced peak shifts. Beyond a threshold, further Mo additions result in less significant changes in the XRD pattern, despite continued Mo incorporation. The calculated crystallite size of ZnO, 1%Mo-ZnO, 2%Mo-ZnO, 3%Mo-ZnO, 4%Mo-ZnO and 5%Mo-ZnO using Scherrer formula is 18.47 nm, 14.84 nm, 15.33 nm, 13.43 nm, 15.49 nm and 16.39 nm respectively.
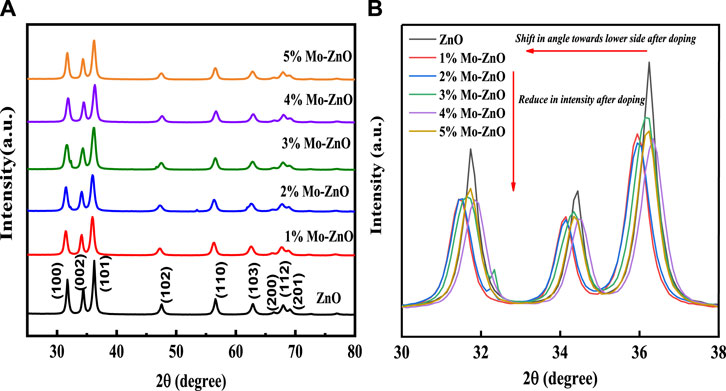
Figure 1. (A) XRD pattern of ZnO and 1%–5% Mo-ZnO@NF (B) XRD showing peak shifting and reduce in intensity after Mo doping in ZnO.
3.2 Raman studies
Raman analysis was conducted to verify the structural phase of ZnO and Mo-ZnO@NF as shown in Figure 2, revealing consistent findings with XRD data, particularly regarding the hexagonal phase of ZnO. The wurtzite-type ZnO demonstrated optical phonon modes characteristic of the C6v space group, including A1, 2B1, E1, and 2E2. Polar A1 and E1 modes exhibited frequencies corresponding to transverse optical (TO) and longitudinal optical (LO) phonon modes, while the B1 modes remained silent. The non-polar E2 mode displayed two frequencies, E2 (high) associated with oxygen atom motion and E2 (low) linked to Zn sub-lattice motion [24]. A dominant peak at 436 cm−1 was observed, matching to the nonpolar phonon mode E2 (high) related with the oxygen sublattice [25], primarily reflecting oxygen atom vibrations. Peaks near 330 cm−1 were assigned to E2 (high)− E2 (low), resulting from multi-phonon processes, while the peak at approximately 380 cm−1 corresponds to A1 (TO). The emergence of the E1 (LO) mode suggested the existence of impurities and structural irregularities [26, 27]. Remarkably, the E2 (high) phonon mode of Mo-doped ZnO samples exhibited minimal positional changes related to ZnO. This stability can be attributed to the fact that the E2 (high) mode primarily involves oxygen atom vibrations, rendering it less sensitive to mass substitution at the cation site. The introduction of Mo doping effectively compensated for changes in mass and stress within the core, thereby mitigating considerable peak shifts in E2 (high) [3].
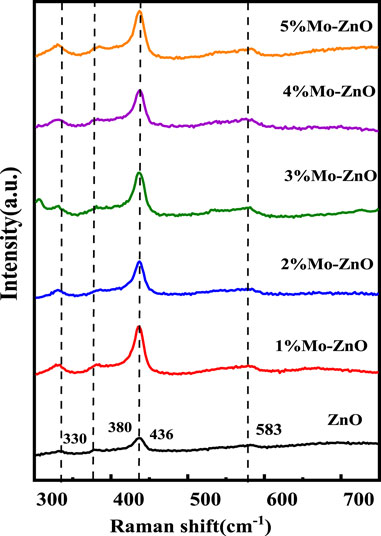
Figure 2. Raman spectra of ZnO and 1%–5% Mo-ZnO@NF
3.3 UV-visible spectroscopy
UV–Visible spectroscopy was employed to investigate the optical properties of the synthesized materials, with Figure 3 illustrating the UV–vis spectra of both ZnO and 1%–5% Mo-ZnO samples. ZnO demonstrated absorption in the UV region, typical of its bandgap structure. However, upon Mo doping, a bathochromic shift was observed, indicative of the formation of transitional energy levels within the ZnO lattice. This shift towards longer wavelengths extended the absorption spectrum into the visible region [28], a phenomenon commonly referred to as a redshift or band narrowing effect. These alterations in optical characteristics due to variations in the electronic structure of ZnO induced by metal doping, reflecting the complex interaction between dopant incorporation and the material’s optical response [29].
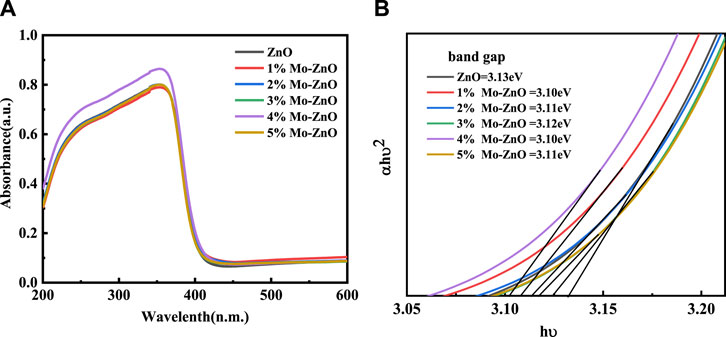
Figure 3. (A) UV-Visible spectra (B) Tauc’s plot for ZnO and 1%–5% Mo-ZnO@NF
3.4 Photoluminescence studies
Photoluminescence spectroscopy is useful method for investing the electronic structure and optical characteristics of semiconductor nanomaterials. By investigating factors like surface oxygen vacancy, defects, surface states and behaviour of photogenerated carriers, it shows key structures insight, which provides progress and enhancement in the performance of nanomaterials. Figure 4 illustrates the photoluminescence (PL) spectra of both pure ZnO and 1%–5% Mo-doped ZnO nanoflowers (Mo-ZnO@NF) excited at a wavelength of 355 nm. Across all samples, two consistent peaks are observed. The UV luminescence peak, cantered at 392 nm, aligns closely with the band edge, indicative of a band gap energy of 3.13 eV, attributed to the free excitonic recombination process within ZnO. Moreover, a secondary peak emerges in the visible range, spanning from 430 to 580 nm, attributed to electron transitions from excited states to the valence band, originating from oxygen defect levels [30]. Despite a gradual decrease in peak intensity and a redshift towards the visible region with Mo doping compared to pure ZnO, the observed redshift in the emission peak is attributed to the presence of Mo/Zn interstitials in Mo-ZnO doping. Furthermore, the reduction in photoluminescence intensity in Mo-ZnO@NF directly correlates with a decrease in the recombination rate of photo-generated electron-hole pairs. This reduction in recombination speed signifies a favorable condition for enhancing the photocatalytic degradation efficiency of Mo-ZnO@NF [31]. The relationship between PL and photocatalytic activity is crucial in understanding the efficiency of photocatalytic processes. High PL intensity often signifies rapid recombination of photoexcited electron-hole pairs, limiting the availability of long-lived charge carriers and subsequently diminishing photocatalytic performance. Conversely, low PL intensity suggests efficient charge carrier separation and reduced recombination rates, indicative of enhanced photocatalytic activity. Changes in PL spectra can offer insights into surface defects, dopant effects, or alterations in the electronic band structure, all of which influence photocatalytic behaviour.

Figure 4. PL spectra of ZnO and 1%–5% Mo-ZnO@NF
3.5 FESEM
The FESEM images depicted in Figure 5 reveal the unique flower-like morphology of both ZnO and Mo-ZnO@NF, offering detailed insights into their structural characteristics. In the images, small circular ZnO particles with dimensions ranging from 17 to 25 nm are observed, arranged in a flake-like manner, owing to highly porosity. These flakes further aggregate to form the distinctive flower-like structures. Notably, the flowers exhibit a porous nature, with visible spaces and voids between the arranged petal-like structures. The width of the flakes varies significantly, spanning from nanometers to micrometers. The observed morphological features, characterized by the intricate arrangement of ZnO particles into highly porous flakes to flower-like structures leading to high surface area which underscore the importance of nanostructure engineering in tailoring the properties of semiconductor materials for various applications. Additionally, the significant enlargement of flakes in Mo-ZnO@NF highlights the potential for optimizing photocatalytic performance through precise control of morphology and surface area.
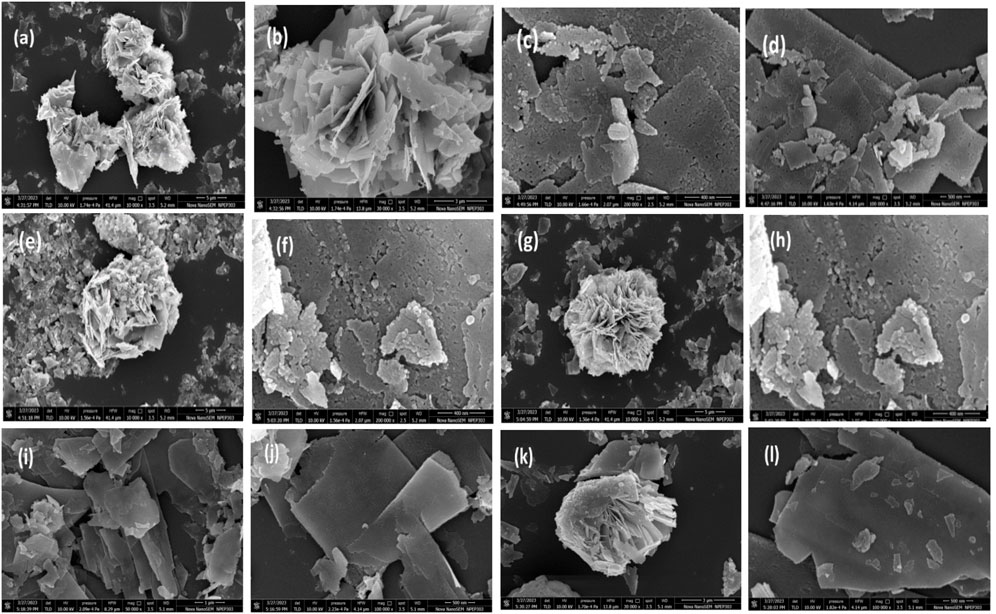
Figure 5. FESEM image of (A, B) ZnO@NF, (C, D) 1% Mo-ZnO@NF, (E, F) 2% Mo-ZnO@NF, (G and H) 3% Mo-ZnO@NF, (I and J) 4% Mo-ZnO@NF, (K, L) 5% Mo-ZnO@NF.
3.6 HR-TEM
HR-TEM is a powerful tool employed to explore the morphology of nanomaterials, giving insights into their structural characteristics at the atomic scale. In Figure 6, Mo-ZnO nanoparticles, with dimensions approximately ranging from 2 to 3 nm, are observed to assemble into distinctive flakes. These flakes further aggregate to construct flower-like structures, showcasing the intricate organization of the nanomaterial. Moreover, elemental mapping conducted within the TEM framework confirms the presence of zinc (Zn), oxygen (O), and molybdenum (Mo) within the nanoparticles. This elemental mapping provides spatial information about the distribution of each constituent element within the nanomaterial, facilitating a comprehensive understanding of its chemical composition and structural arrangement.
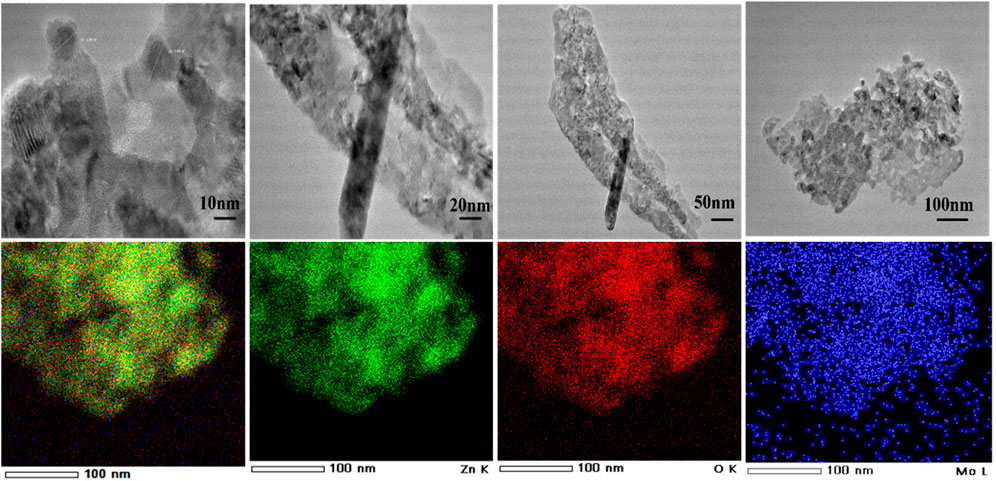
Figure 6. TEM image of 1% Mo-ZnO@NF
3.7 XPS study
X-ray photoelectron spectroscopy (XPS) was conducted to analyse the chemical valance states of various elements and the surface elemental composition in 1% Mo-ZnO@NF. The XPS survey spectrum in Figure 7 revealed the presence of Mo, Zn, O, C in the Mo-ZnO@NF sample. In Figure 7B, Zn 2p spectrum displayed a peak at a binding energy of 1021.45 eV assigned to the Zn 2p 3/2 peak of a Zn2+, and another 1044.25 eV assigned to the Zn 2p 1/2 of a Zn2+. Notably, metallic Zn with a binding energy 1021.45 eV was not detected, confirming the exclusive presence of oxidised Zn. The Mo 3d XPS spectrum (Figure 7C) exhibits two peaks at 225.1 eV and 234.9 eV corresponding to Mo3d5/2 and Mo3d3/2, respectively. Figure 7D presented the O 1s XPS spectrum, where the binding energy at 530.25 eV was assigned to O1s [32–34].
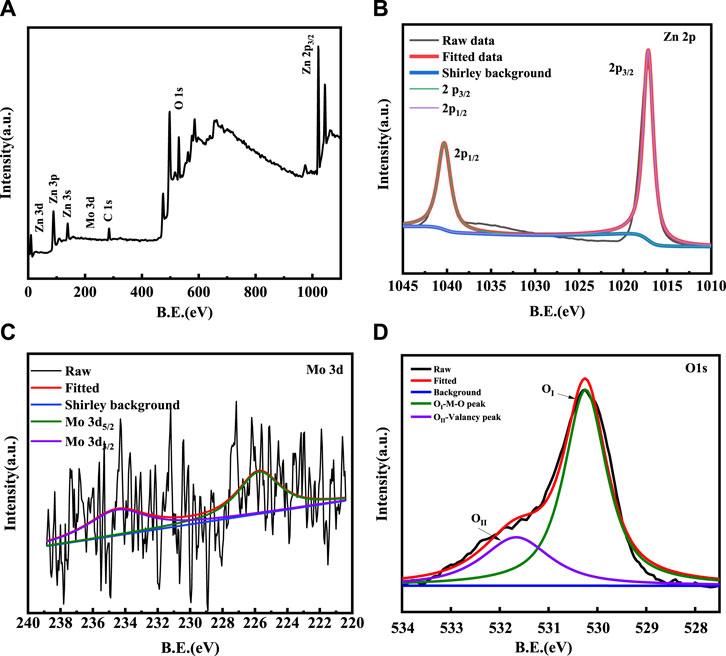
Figure 7. XPS spectra of (A) survey scan, (B) Zn 2p, (C) MO 3d, (D) O 1s, of 1% Mo-ZnO@NF.
3.8 BET surface area
The photocatalytic efficacy of a material is linked to its specific surface area, with a greater surface area typically correlating with enhanced photocatalytic activity. Determination of surface area involves the generation and analysis of N2 absorption-desorption isotherms, employing the Brunauer-Emmett-Teller (BET) method. In this study, the BET surface area of ZnO, as well as Mo-doped ZnO samples at varying doping levels (1%–5% Mo-ZnO), were calculated as 11.32 m2/g, 22.21 m2/g, 19.35 m2/g, 17.15 m2/g, 15.46 m2/g, and 13.14 m2/g, respectively (Figure 8). The elevation in surface area observed in Mo-ZnO samples underscores their potential utility in photocatalytic applications. This increase in surface area, particularly notable in 1% Mo-ZnO, facilitates greater availability of active sites, thereby promoting interaction between the photocatalyst and target molecules, thus generating a favourable environment for catalytic reactions. Consequently, 1% Mo-ZnO exhibits enhanced photocatalytic performance relative to both pristine ZnO and higher doping levels (2%–5% Mo-ZnO). This observation underscores the pivotal role of surface characteristics in governing photocatalytic activity and highlights the potential of Mo-ZnO catalysts in diverse applications.
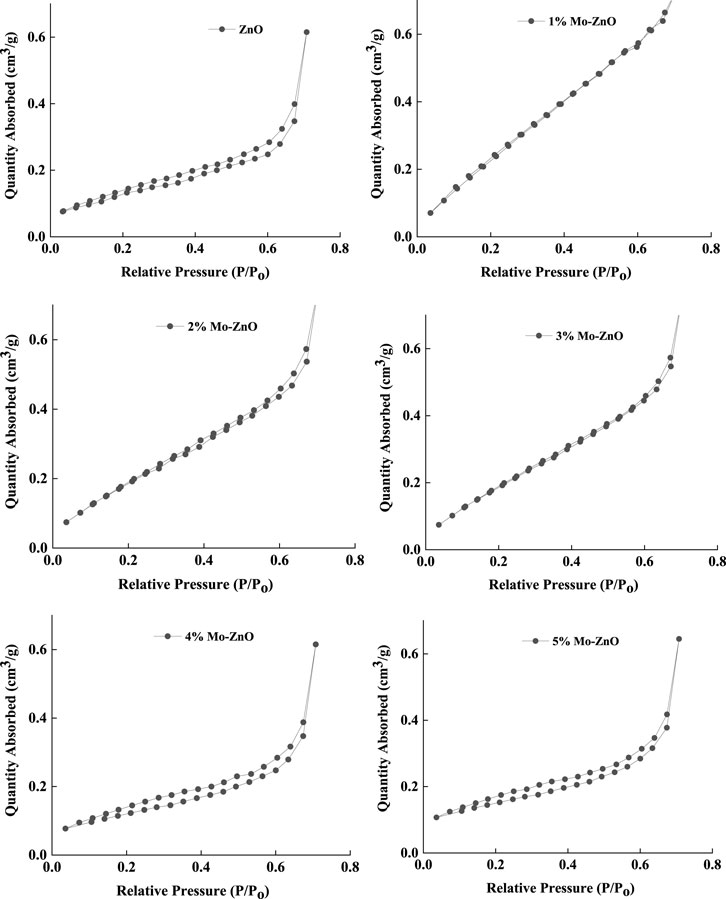
Figure 8. BET surface area plots of ZnO and 1 to 5% Mo-ZnO
3.9 Photocatalytic activity
3.9.1 Hydrogen generation via water splitting using Mo-ZnO@NF
In the photocatalytic hydrogen evolution, an experimental setup involves a solution containing 100 mL of deionized water, where platinum (Pt) is introduced as a co-catalyst at a concentration of 0.5 wt%. This Pt inclusion aims to boost photocatalytic efficiency by its superior electron affinity, thereby accelerating the absorption kinetics of photogenerated charge carriers, consequently enhancing catalytic performance. Experimental observations reveal obvious divergences in hydrogen evolution rates among Mo-ZnO@NF catalysts, with 1% Mo-ZnO exhibiting the most remarkable hydrogen generation rate at 2024 μmol/h/g. The H2 generation rate among the material is 1% Mo-ZnO>2% Mo-ZnO >3% Mo-ZnO >4% Mo-ZnO >5% Mo-ZnO > pristine ZnO, well aligning with degradation efficiency observed in methylene blue (MB) dye degradation. The trend in hydrogen generation activity among different concentrations of Mo-doped ZnO suggested that at lower concentrations like 1% Mo-ZnO, optimal dispersion of molybdenum atoms facilitates the creation of active sites, enhancing catalytic activity. However, higher doping levels may lead to molybdenum agglomeration, diminishing effective surface area and altering electronic properties unfavourably. Structural changes and surface chemistry variations further influence catalytic performance, collectively resulting in the observed trend where 1% Mo-ZnO outperforms higher doping levels and pristine ZnO.This hydrogen evolution trend is graphically depicted in Figure 9. A previous investigation by J. Tang et al. underscored methanol’s role in suppressing oxygen (O2) evolution by generating free radicals and mitigating charge carrier recombination. The mechanism of photocatalytic hydrogen evolution involves the photoactivation of a semiconductor material’s surface via visible light, triggering the generation of electron-hole pairs. Electrons populate the conductance band (CB) while holes occupy the valence band (VB). These holes partake in redox reactions with methanol, yielding radicals and protons (H+), while electrons in the CB reduce H+ ions, yielding molecular hydrogen.
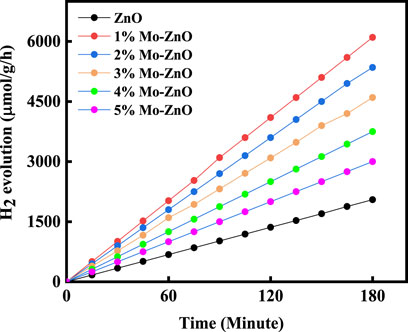
Figure 9. H2 evolution rate via water splitting using 1%–5% Mo-ZnO as photocatalyst.
The reaction process for hydrogen generation are as in Eqs 2a, 3–6:
3.9.2 Methylene blue degradation using Mo-ZnO@NF
The 1%–5% Mo-ZnO@NF were synthesized and assessed for their photocatalytic activity through the degradation of MB dye. A comparative analysis with ZnO was also conducted to evaluate the efficiency of Mo-ZnO@NF. In the photocatalytic degradation experiment, 50 mL. aqueous MB dye solution (10 ppm) containing 25 mg catalyst was equipped. The degradation process was monitered by recording the change in intensities of the characeristics absorption peak of MB dye at 663 nm. Figure 10 represent the experimental results of MB dye degradation using 1%–5% Mo-ZnO@NF and ZnO respectively, showing the variations in dye concentration over time during the photodegradation process. The outcomes offer appreciated understandings into photocatalytic efficiency of Mo-ZnO@NF and ZnO under natural sunlight irradiation. The changes in absorption intensity at 663 nm reflect the extent of dye degradation over time. Especially, 1% Mo-ZnO@NF demonstrated approximately 97% degradation of MB dye within 40 min, better than ZnO, which achieved 77% degradation in same time span. The enhanced photocatalytic activity of Mo-ZnO@NF under sunlight can be revealed through the following mechanisms: i) Doping promotes the formation of new energy levels, facilitating a rapid interfacial electron transfer rate. This enables electron speedily elevated to the conduction band. ii) Additionally, the presence of Mo doping contributes to a slower recombination rate of electron-hole pairs, further enhancing the efficiency of the photo response. The degradation efficiency of methylene blue (MB) by ZnO and 1%–5% Mo-ZnO@NF catalysts reveals an interesting trend. ZnO alone exhibits a degradation efficiency of 77%, while the efficiency increases with the incorporation of molybdenum (Mo) into the ZnO lattice. Specifically, 1% Mo-ZnO@NF shows the highest degradation efficiency at 97%, followed by 2% Mo-ZnO@NF at 93%, 3% Mo-ZnO@NF at 91%, 4% Mo-ZnO@NF at 85%, and 5% Mo-ZnO@NF at 82%. This trend suggests that the introduction of molybdenum enhances the photocatalytic activity of ZnO for MB degradation, up to a certain optimal concentration (1% Mo-ZnO@NF). Figure 11A shows graph between % degradation vs. time. At this concentration, the catalyst exhibits the highest efficiency in breaking down MB molecules under the influence of light. However, beyond this optimal concentration, further doping of Mo leads to a decrease in degradation efficiency. This could be attributed to various factors such as changes in the surface morphology, electronic structure, or the formation of Mo aggregates, which may hinder the catalytic activity of the material. Overall, the data underscores the significance of optimizing doping concentrations in Mo-ZnO@NF catalysts to achieve maximum efficiency in pollutant degradation applications. Photodegradaton kinetics were studied using the Langmuir–Hinshelwood kinetic model Eq. 1b:
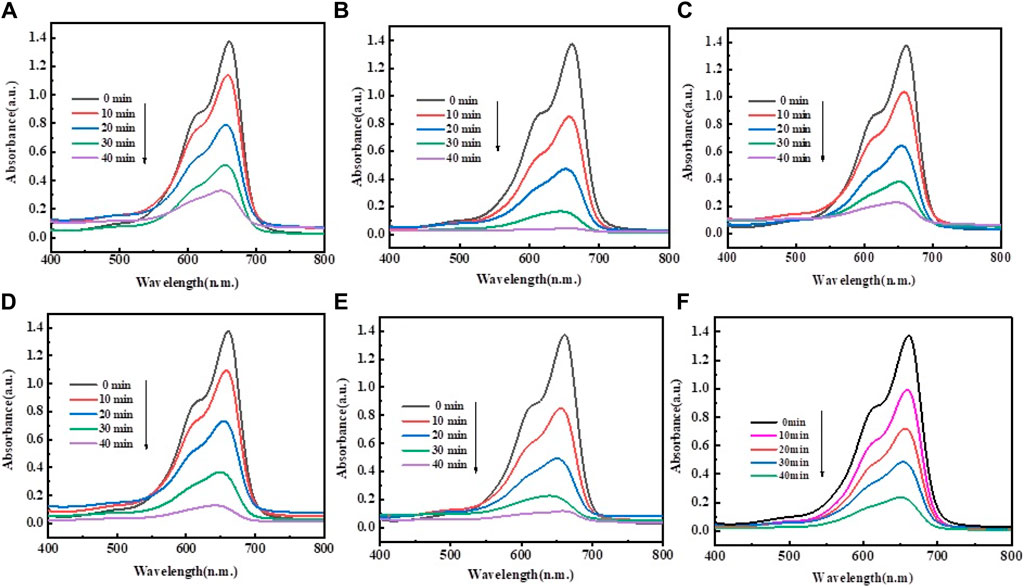
Figure 10. Photodegradation of MB dye in aqueous solution under visible light for (A) ZnO, (B) 1% Mo-ZnO@NF, (C) 2% Mo-ZnO@NF, (D) 3% Mo-ZnO@NF, (E) 4% Mo-ZnO@NF, (F) 5% Mo-ZnO@NF
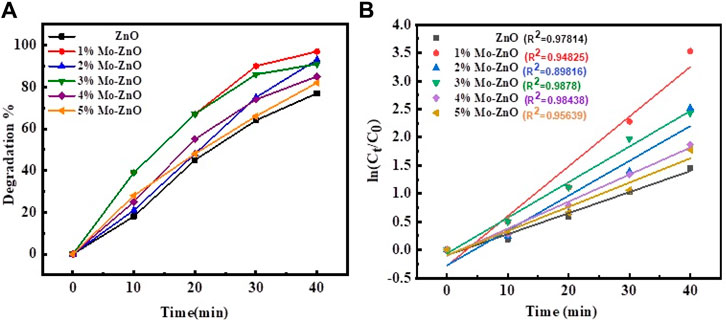
Figure 11. (A) Plot of % degradation of MB vs. time and (B) Plot of ln (Co/Ct) vs. time for ZnO and 1%–5% Mo-ZnO@NF
The pseudo-first-order kinetics model was employed, and ln (Co/Ct) values were plotted against irradiation time (Figure 11B). Table 1 shows the photocatalytic parameters for all samples. The 1% Mo-ZnO@NF demonstrate the highest photodegradation rate (3.54 min-1) and excellent linear regression, indicating a strong correlation between in (Co/Ct) values and irradiation time.
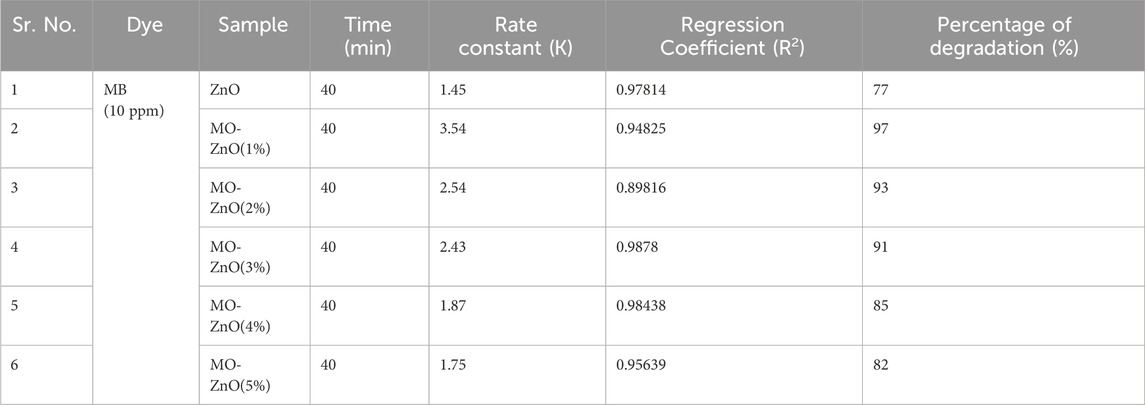
Table 1. Photocatalytic parameters of synthesized ZnO, and 1%–5% Mo-ZnO@NF
3.9.3 Radical trapping experiment
The radical trap test proposes the mechanistic explanation of the reaction pathway for Methylene Blue (MB) degradation, involved the utilization of isopropanol (IPA) and benzoquinone (BQN) as scavengers, targeting hydroxyl (•OH) and peroxy (•O2−) radicals, respectively. The experimental outcomes revealed the dynamics of MB degradation under photocatalytic conditions. Notably, the degradation pattern of MB closely mirrored that of the standard degradation process in the presence of BQN, suggesting a limited contribution of peroxy radicals (•O2−) to the MB photodegradation mechanism. Conversely, upon the introduction of IPA to scavenge hydroxyl radicals (•OH), a notable inhibition of the photocatalytic degradation process was observed. This finding highlights the vital role of hydroxyl radicals (•OH) in driving the photocatalytic degradation of MB, thereby underscoring their crucial contribution in the degradation mechanism. The proposed reaction mechanism of MB dye degradation using Mo-ZnO@NF in terms of Eqs 2 and 7-11 as follows:
Photoexcitation and Electron Transfer:
Formation of Hydroxyl Radicals:
Degradation of MB dye:
During light irradiation, methylene blue (MB) dye molecules undergo photoexcitation, wherein their electrons are excited to higher energy levels and transferred to the conductance band (CB) of the Mo-ZnO@NF catalyst. The excited electrons within the CB subsequently engage in redox reactions with water molecules, facilitating the formation of hydroxyl radicals (•OH) through the reduction of molecular oxygen. These •OH radicals exhibit high reactivity and serve as potent oxidizing agents, initiating the degradation of MB molecules by abstracting hydrogen atoms from their molecular structure. This degradation process leads to the formation of inorganic compounds, carbon dioxide (CO2), and water (H2O), ultimately resulting in the mineralization of the dye molecules. Importantly, the efficiency of this degradation process is intricately linked to the band gap of the Mo-ZnO@NF catalyst (Figure 12). A narrower band gap corresponds to a higher probability of photon absorption, enabling the catalyst to harness a broader spectrum of light for photoexcitation. Consequently, a greater number of electrons are promoted to the CB, increasing the generation of •OH radicals and enhancing the degradation rate of MB.
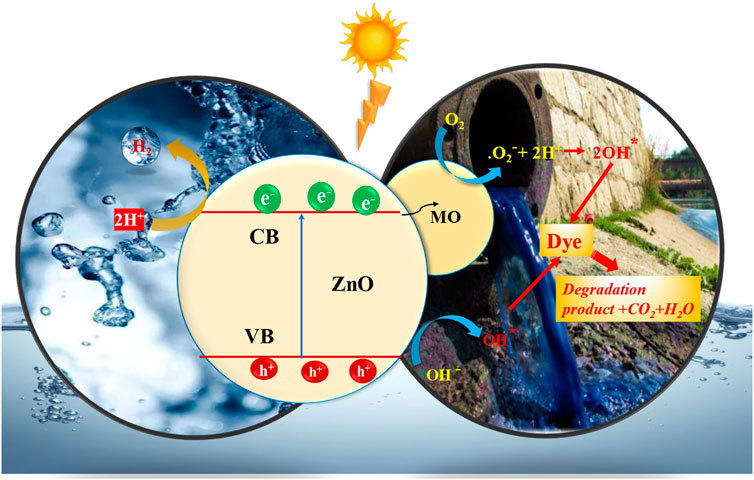
Figure 12. Graphical illustration of mechanism of dye degradation.
3.9.4 Reusability studies for 1% Mo-ZnO@NF
The reusability of the photocatalyst Mo-ZnO@NF was evaluated over five sequential cycles through a standardized procedure. After each cycle, the catalyst was retrieved, subjected to two washing steps, and subsequently dried. The resultant dried powder was utilized again for the MB dye degradation, maintaining a consistent catalyst-to-dye ratio throughout all cycles. Over the course of these experiments, the degradation efficiency of MB exhibited 97%, 92%, 85%, and 76%–70% at the termination of each consecutive cycle (Figure 13A). The X-ray diffraction (XRD) analysis conducted before and after use of the photocatalyst revealed a notable consistency in the diffraction patterns. This absence of obvious alterations suggests the structural integrity and stability of the photocatalyst throughout the experimental duration. Such findings imply the resilience of the photocatalytic material under the applied conditions, thus indicating its potential suitability for sustained catalytic applications (Figure 13B).
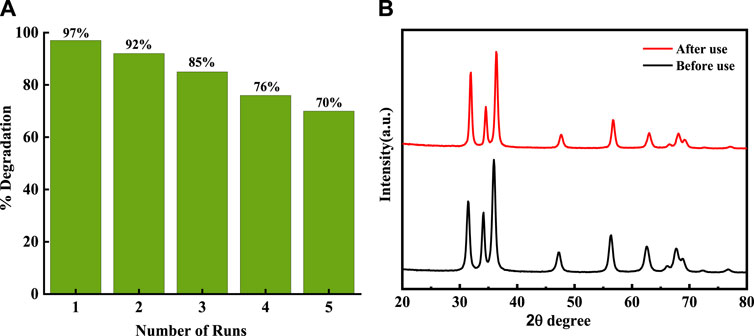
Figure 13. (A) Photocatalysis reusability performance of Mo-ZnO@NF for MB dye degradation (B) XRD of MO-ZnO(1%) before and after use.
4 Conclusion
In conclusion, the synthesis and characterization of molybdenum (Mo) doped zinc oxide (ZnO) nanoflowers (Mo-ZnO@NF) via a hydrothermal method exhibit promising potential for hydrogen generation and dye degradation applications. The successful synthesis results in a hexagonal crystalline phase with unique hierarchical porous flower-like morphology, as confirmed by comprehensive structural, morphological, and optical analyses. Doping of Mo was confirmed by peak shifting in XRD and Raman analysis supported by the XPS study. Photocatalytic assessments demonstrate the excellent efficacy of Mo-ZnO@NF, with high hydrogen evolution rates (2024 mmol/h/g) and efficient Methylene Blue (MB) dye degradation rates (97% in 40 min). Furthermore, comparative investigations reveal an optimal doping concentration of 1% Mo in ZnO, which enhances photocatalytic performance attributed to improved charge carrier separation and increased surface area. The photodegradation mechanism follows pseudo-first-order kinetics, suggesting a reliable and efficient degradation process. The versatile and eco-friendly Mo-ZnO@NF photocatalysts hold significant promise as cost-effective solutions for energy generation and wastewater treatment under natural sunlight, with their advantageous properties positioning them as versatile materials with applications spanning environmental remediation, energy production, healthcare, and materials science.
Data availability statement
The original contributions presented in the study are included in the article/supplementary material, further inquiries can be directed to the corresponding authors.
Author contributions
YP: Formal Analysis, Investigation, Methodology, Writing–original draft. RC: Data curation, Formal Analysis, Investigation, Methodology, Supervision, Validation, Visualization, Writing–original draft, Writing–review and editing. RP: Visualization, Writing–review and editing. HF: Validation, Visualization, Writing–review and editing. SG: Conceptualization, Investigation, Supervision, Validation, Visualization, Writing–original draft, Writing–review and editing.
Funding
The author(s) declare that financial support was received for the research, authorship, and/or publication of this article. This work is funded by Researchers Supporting Project number (RSP2024R117), King Saud University, Riyadh, Saudi Arabia.
Acknowledgments
Author YP acknowledges the Chhatrapati Shahu Maharaj National Research, Training and Human Development Institute (CSMNRF-2021/2021-22/896) for the fellowship award, as well as the Head of the Department of Environmental Science, the Head of the Department of Physics, and the Central Characterization Facility at SPPU for their support in the analysis and characterization.
Conflict of interest
The authors declare that the research was conducted in the absence of any commercial or financial relationships that could be construed as a potential conflict of interest.
Publisher’s note
All claims expressed in this article are solely those of the authors and do not necessarily represent those of their affiliated organizations, or those of the publisher, the editors and the reviewers. Any product that may be evaluated in this article, or claim that may be made by its manufacturer, is not guaranteed or endorsed by the publisher.
References
1. Chauhan R, Shinde M, Kumar A, Gosavi S, Amalnerkar D. Hierarchical zinc oxide pomegranate and hollow sphere structures as efficient photoanodes for dye-sensitized solar cells. Microporous Mesoporous Mater (2016) 226:201–8. doi:10.1016/j.micromeso.2015.11.054
2. Bakranova D, Nagel D. ZnO for photoelectrochemical hydrogen generation. Clean technologies. Clean Technol (2023) 5(4):1248–68. doi:10.3390/cleantechnol5040063
3. Vasiljevic ZZ, Dojcinovic MP, Vujancevic JD, Jankovic-Castvan I, Ognjanovic M, Tadic NB, et al. Photocatalytic degradation of methylene blue under natural sunlight using iron titanate nanoparticles prepared by a modified sol–gel method. R Soc Open Sci (2020) 7:200708. doi:10.1098/rsos.200708
4. Malik R, Ramteke DS, Wate SR. Adsorption of malachite green on groundnut shell waste based powdered activated carbon. Waste Manag (2007) 27(9):1129–38. doi:10.1016/j.wasman.2006.06.009
5. Adaikalam K, Valanarasu S, Ali AM, Sayed MA, Yang W, Kim HS. Photosensing effect of indium-doped ZnO thin films and its heterostructure with silicon. J Asian Ceram Societies (2022) 1(1):108–19. doi:10.1080/21870764.2021.2015847
6. Anwar S, Naeem M, Karamat S, Bhopal MF, Bhatti AS, Oral A Efficient photocatalytic activity of Mo-doped ZnO-In2O3 type-II staggered heterostructure for dye degradation. Int J Environ Sci Technol Int J Environ Sci Tech (2023) 21(7):6093–106. doi:10.1007/s13762-023-05292-y
7. Yue S, Zhang W, Li Q, Liu H, Wang X. Preparations and applications of zinc oxide based photocatalytic materials. Adv Sensor Energ Mater (2023) 2(3):100069. doi:10.1016/j.asems.2023.100069
8. Qutub N, Singh P, Sagadevan S, Oh WC, et al. Enhanced photocatalytic degradation of Acid Blue dye using CdS/TiO2 nanocomposite. Sci Rep (2022) 12:5759. doi:10.1038/s41598-022-09479-0
9. Waghadkar YB, Umarji G, Kekade SS, Rane S, Chauhan R, Ashokkumar M, et al. Synthesis and characterization of indium-doped ZnO nanoparticles by coprecipitation method for highly photo-responsive UV light sensors. Sensors Interna tional (2024) 5:100271. doi:10.1016/j.sintl.2023.100271
10. Kant R Textile dyeing industry an environmental hazard. Nat Sci (2012) 4:22–6. doi:10.4236/ns.2012.41004
11. Mohammad N, Amirhossein R, Saeed S, Hossein A. The enhanced photocatalytic activity of ZnO nanorods/CuO nanourchins composite prepared by chemical bath precipitation. Mater Sci Eng B (2021) 271:115262. doi:10.1016/j.mseb.2021.115262
12. Bharat TC, Mondal SS, Gupta HS, Singh PK, Das AK. Synthesis of doped zinc oxide nanoparticles: a review. Mater Today (2019) 11(2):767–75. doi:10.1016/j.matpr.2019.03.041
13. Mao T, Liu M, Lin L, Cheng Y, Fang C A study on doping and compound of zinc oxide photocatalysts. Polymers (2022) 14:4484. doi:10.3390/polym14214484
14. Kim HK, Huh SH, Park JW, Jeong JW, Lee GH. The cluster size dependence of thermal stabilities of both molybdenum and tungsten nanoclusters. Chem Phys Lett (2002) 354(1–2):165–72. doi:10.1016/S0009-2614(02)00146-X
15. Swapna R, Santhosh Kumar MC. Growth and characterization of molybdenum doped ZnO thin films by spray pyrolysis. J Phys Chem Sol (2013) 74(3):418–25. doi:10.1016/j.jpcs.2012.11.003
16. Bancheva-Koleva P, Zhelev V, Petkov P, Petkova T. Molybdenum-doped ZnO thin films obtained by spray pyrolysis. Materials (2024) 17:2164. doi:10.3390/ma17092164
17. Perillo PM, Atia MN. Solar-assisted photodegradation of Methyl Orange using Cu-doped ZnO nanorods. Mater Today Commun (2018) 17:252–8. doi:10.1016/j.mtcomm.2018.09.010
18. Bhapkar AR, Geetha M, Jaspal D, Gheisari K, Laad M, Cabibihan JJ, et al. Aluminium doped ZnO nanostructures for efficient photodegradation of indigo carmine and azo carmine G in solar irradiation. Appl Nanosci (2023) 13:5777–93. doi:10.1007/s13204-023-02824-3
19. Kong JZ, Li AD, Li XY, Zhai HF, Zhang WQ, Gong YP, et al. Photo-degradation of methylene blue using Ta-doped ZnO nanoparticle. J Solid-State Chem (2010) 183(6):1359–64. doi:10.1016/j.jssc.2010.04.005
20. Adeel M, Saeed M, Khan I, Muneer M, Akram N. Synthesis and characterization of Co–ZnO and evaluation of its photocatalytic activity for photodegradation of methyl orange. ACS Omega (2021) 6(2):1426–35. doi:10.1021/acsomega.0c05092
21. Bhosale A, Kadam J, Gade T, Sonawane K, Garadkar K. Efficient photodegradation of methyl orange and bactericidal activity of Ag doped ZnO nanoparticles. J Indian Chem Soc (2023) 100(2):100920. doi:10.1016/j.jics.2023.100920
22. Moulahi A. Efficient photocatalytic performance of Mg doping ZnO for the photodegradation of the rhodamine B. Inorg Chem Commun (2021) 133:108906. doi:10.1016/j.inoche.2021.108906
23. Ravichandran K, Dhanraj C, Mohamed Ibrahim M, Kavitha P Enhancing the photocatalytic efficiency of ZnO thin films by the addition of Mo and rGO. Mater Today Proc (2020) 48(2):234–44. doi:10.1016/j.matpr.2020.07.075
24. Kuriakose S, Satpati B, Mohapatra S. Enhanced photocatalytic activity of Co doped ZnO nanodisks and nanorods prepared by a facile wet chemical method. Phys Chem Chem Phys (2014) 16(25):12741–9. doi:10.1039/c4cp01315h
25. Pimentel A, Nunes D, Duarte P, Rodrigues J, Costa FM, Monteiro T, et al. FortunatoE. Synthesis of long ZnO nanorods under microwave irradiation or conventional heating. J Phys Chem C (2014) 118:14629–39. doi:10.1021/jp5027509
26. Buryi M, Remeš Z, Babin V, Novotný M, Vaněček V, Aubrechtová Dragounová K, et al. Influence of Mo doping on the luminescence properties and defect states in ZnO nanorods. Comparison with ZnO:Mo thin films. Appl Surf Sci (2021) 555:149679. doi:10.1016/j.apsusc.2021.149679
27. Li C, Lv Y, Guo L, Xu H, Ai X, Zhang J. Raman and excitonic photoluminescence characterizations of ZnO star-shaped nanocrystals. J Lumin (2007) 122–123(1):415–7. doi:10.1016/j.jlumin.2006.01.173
28. Ali H, Alsmadi A, Salameh B, Mathai M, Shatnawi M, Hadia N, et al. Influence of nickel doping on the energy band gap, luminescence, and magnetic order of spray deposited nanostructured ZnO thin films. J Alloys Compd (2019) 816:152538. doi:10.1016/j.jallcom.2019.152538
29. Zyoud SH, Ganesh V, Che Abdullah CA, Yahia IS, Zyoud AH, Abdelkader AFI, et al. Facile synthesis of Ni-doped ZnO nanostructures via laser-assisted chemical bath synthesis with high and durable photocatalytic activity. Crystals (2023) 13:1087. doi:10.3390/cryst13071087
30. Zhang J, Li J. The oxygen vacancy defect of ZnO/NiO nanomaterials improves photocatalytic performance and ammonia sensing performance. Nanomaterials (2022) 12:433. doi:10.3390/nano12030433
31. Sirohi K, Kumar S, Singh V, Chauhan N, Vohra A Facile synthesis of CdO–ZnO nanocomposites for photocatalytic application in visible light. Arab J Sci Eng (2024) 49:273–84. doi:10.1007/s13369-023-08072-5
32. Hu C, Xu H, Liu X, Zou F, Qie L, Huang Y, et al. VO2/TiO2 nanosponges as binder-free electrodes for high-performance supercapacitors. Sci Rep (2015) 5:16012. doi:10.1038/srep16012
33. Ali A, Ammar M, Ali M, Yahya Z, Javaid MY, Hassan S, et al. Mo-doped ZnO nanoflakes on Ni-foam for asymmetric supercapacitor applications. RSC Adv (2019) 9(47):27432–8. doi:10.1039/C9RA05051E
Keywords: Mo-zinc oxide, nanoflowers, photocatalyst, hydrogen generation, dye degradation, methylene blue
Citation: Padwal Y, Chauhan R, Panchang R, Fouad H and Gosavi SW (2024) Exploring Mo-ZnO@NF for hydrogen generation and methylene blue remediation: sunlight-driven catalysis. Front. Phys. 12:1416563. doi: 10.3389/fphy.2024.1416563
Received: 12 April 2024; Accepted: 27 May 2024;
Published: 17 June 2024.
Edited by:
Dattatray Late, National Chemical Laboratory (CSIR), IndiaCopyright © 2024 Padwal, Chauhan, Panchang, Fouad and Gosavi. This is an open-access article distributed under the terms of the Creative Commons Attribution License (CC BY). The use, distribution or reproduction in other forums is permitted, provided the original author(s) and the copyright owner(s) are credited and that the original publication in this journal is cited, in accordance with accepted academic practice. No use, distribution or reproduction is permitted which does not comply with these terms.
*Correspondence: Suresh W. Gosavi, c3dnQHBoeXNpY3MudW5pcHVuZS5hYy5pbg==; Ratna Chauhan, cmF0bmFzaW5naC5iaHVAZ21haWwuY29t