 A. D. Filippov
 P. Sharma1
 J. A. Dijksman
 R. C. Hidalgo
- 1Physical Chemistry and Soft Matter, Wageningen University, Wageningen, Netherlands
- 2Van der Waals-Zeeman Institute, Institute of Physics, University of Amsterdam, Amsterdam, Netherlands
- 3Departamento de Física y Matemática Aplicada, Facultad de Ciencias, Universidad de Navarra, Pamplona, Spain
Adhesives can be made by patterning surfaces with discrete adhesive elements. Nature uses this approach to provide animals with highly adaptive and robust approaches towards gaining an effective grip on surfaces. The mechanism of patterned surface adhesion involve many different attachment principles, adhesive site interactions, and probabilistic effects, the interplay of which is not understood. This limits our ability to design patterned surface adhesives for engineering applications. In this work, we quantify how a mechanically patterned adhesive based on passive mushroom-shaped elements performs. We explore a range of surface design features and model the mechanical adhesion dynamics with an approach based on the fiber bundle model (FBM). We find that the fiber bundle model can be used to rationalize the observations after modifying it to capture the initial non-linear force response of the adhesives. Additionally, we investigate the behavior of the system’s elastic energy and damage energy, as it is stretched under strain-controlled conditions. Our experimental data indicates that the elastic energy has a maximum that appears after the macroscopic strength
1 Introduction
Putting two seemingly flat surfaces together does not make a new solid. This proposition is a potentially perplexing observation from the field of interface mechanics, a study of an everyday phenomenon that is surprisingly poorly understood. Two interfaces can be made to adhere via a number of mechanisms, among which the use of discrete adhesive sites. Such attachment styles often use mechanical interlocking of three-dimensional (3D) protruded features and are prevalent in Nature [1]. Inspired by such attachment systems, smart surfaces consisting of micron-millimetric sized attachment features are being developed for many applications, such as climbing robots [2] and grippers [3]. The invention of Velcro® was originally inspired by burdock seeds [4], and the related “3M dual lock” system [5] has been successfully applied in textile industry and the medical field.
The discrete nature of these adhesive sites and the continuous detachment dynamics that they can generate inspire us to understand the statistical mechanics of attachment and detachment of discrete probabilistic fasteners. Here we analyze a combination of older data [6] and new measurements with precisely such statistical modeling, coming from Fiber Bundle Models (FBM) [7–9].
The surface that we use is described in detail elsewhere [6]. Briefly, we studied a soft surface with soft micrometric mushroom-shaped features, providing mechanical interlocking while leaving no visible damage on attachment features or the surface it attaches to. The pattern of adhesive sites consists of cubic arrays of cylindrical “stems” with hemispherical “caps” which we will refer to as “mushrooms”. We 3D-printed the original “positive” mould and obtain an inverted “negative” version in silicon rubber, which is coated with a perfluorosilane after peeling from the positive mold. A final casting delivers an image, which is peeled from the elastomeric mold. The mushroom arrays deliver robust adhesion to textile, with a significant benefit over high-modulus (MPa-range) Velcro-type attachment systems: the far softer elastomeric system detaches from textile before damage occurs to either part. Thus, the combination of 3D printing and elastomer synthesis offers new approaches to address gaps in the property space of adhesives. However, the difficulty of relating stress to strain inherent to the non-linear mechanics in soft adhesive failure [10] results in a lack of analytical routines to characterize and compare various soft adhesive systems. We, therefore, turn to modeling to understand the adhesive performance of these substrates.
1.1 Fiber bundle models (FBM)
Fiber Bundle Models are fundamental classes of approaches to the fracture problem [7–9]. Despite their simple nature, FBMs exhibit the most essential aspects of material breakdown. In a literal interpretation, they model specimens loaded parallel to the fiber direction and describe the damage evolution after one or several fibers fail. For simplicity, each fiber has the same Young’s modulus
When a collection of
The first term in Eqs 1, 2 denotes the elastic (or potential) energy
Similarly, the constitutive law that relates the stress
The maximum of the constitutive curve
In particular, for a Weibull cumulative distribution
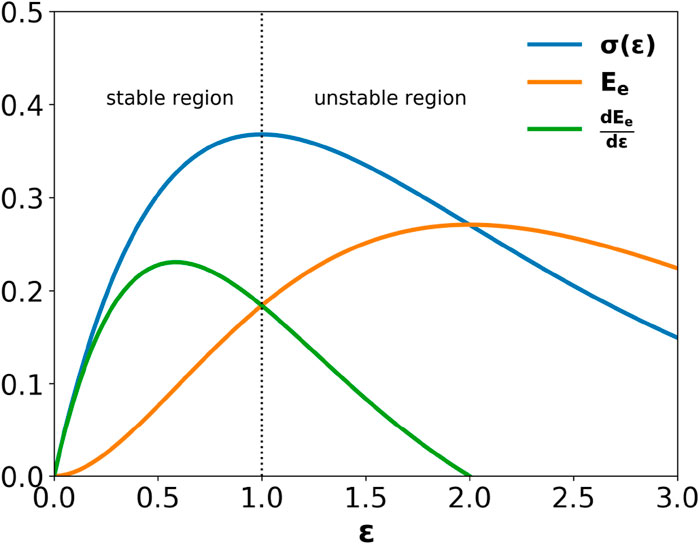
Figure 1. As a bundle of linearly elastic fibers is stretched, the system first accumulates elastic energy
2 Experimental methods
The experiments have been described in detail elsewhere [6]. Briefly, we studied the adhesive interactions of mushroom-studded surfaces made from poly (dimethyl siloxane) (silicone rubber) with a nylon fabric with the help of a rheometer (Figure 2). A schematic of the mushroom-studded surfaces is given in Figure 3, including the relevant dimensions. In particular, we determined the cross-section of the mushrooms by image analysis with ImageJ, which amounted to
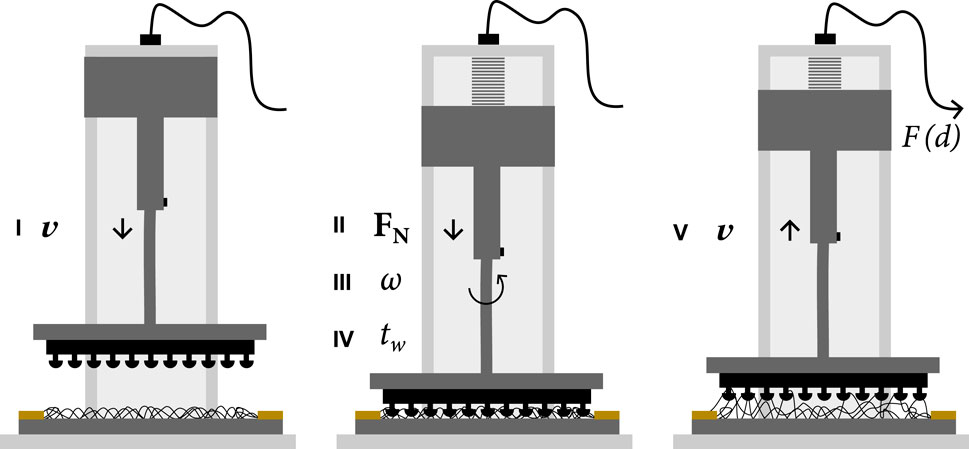
Figure 2. Illustrated rheometry protocol for characterization of the adhesive interaction between nylon fabric and our adhesive devices: i) Approach at constant
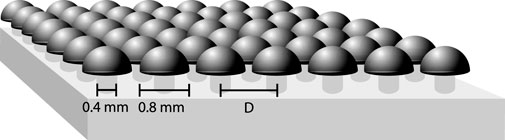
Figure 3. Drawing of a mushroom-covered silicone adhesive surface. The stem and cap diameter are labeled in the figure and identical for all surfaces in the study. We made surfaces with 114, 361 and 441 features by varying the inter-mushroom distance
Fabric samples were obtained from a pantyhose using scissors. First, a fabric sample was attached to the base plate of the rheometer by applying scotch tape over its four sides. The silicone mushroom devices were attached to a glass plate using plasma bonding. For testing, we used a five-step protocol, also illustrated in Figure 2: i) mushroom-studded surfaces were pressed onto a fabric up to a given normal force
3 Results and discussion
3.1 Macroscopic constitutive response: strain hardening
Figure 4 gives the force-strain curves obtained for systems with systematic variations of feature densities and preload intensities
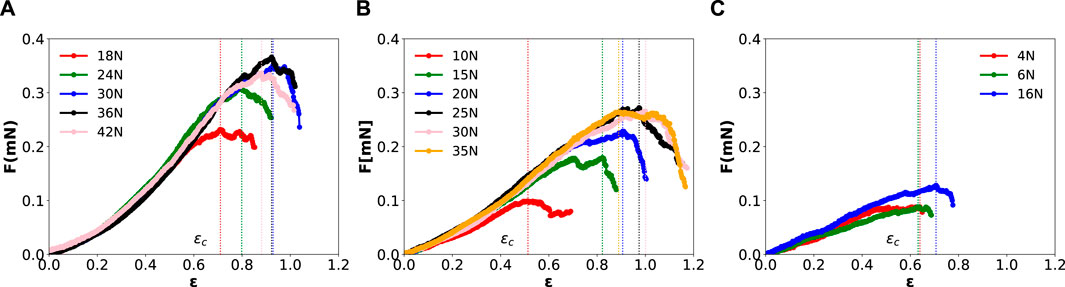
Figure 4. Raw force-distance curves of mushroom-patterned silicone rubber adhesive pads detaching from a textile substrate consisting of nylon fibers. Each of the panels gives data corresponding to devices having (A) 441, (B) 361, and (C) 114 features per 25
All the macroscopic constitutive responses in Figure 4 display the two regimes introduced in Ref. [13]. One stable regime for
Interestingly, for our experimental data, Eq. 3 does not adequately capture the behaviour in the stable regime. Non-linearity in the macroscopic response is apparent in the raw force-strain curves presented in Figure 4. The earlier stage of the curves indicates that the stretching of the textile fibers against our mushroom arrays does not follow a linear force-strain relationship that is characterized by a per mushroom elastic modulus
In all cases, the maximum force indicates the system strength
FBMs have been used to rationalise the random damage evolution of fracturing systems, even beyond disordered solids [14–19]. However, the non-linearity of the initial loading regime represents a fundamental challenge to the validity of fiber bundle models, which attempt to capture the microscopic features of the feature-fabric interaction. In a basic form, such a model would feature a linear loading regime
Interestingly, the fabric-mushroom stretching seems to impose a power law on the force-strain curves. Following the theoretical and experimental results [21–24] on other (crosslinked) fibrous networks as present in the fabric, we propose a stress-distance curve, using a strain-hardening ansatz
with
where
Subsequently, we fit all curves in Figure 4 to equation Eq. 6. Good fits to the data were accomplished with least squares optimization. We used the powers and pre-factors from Figure 5 to initialize the fits, and
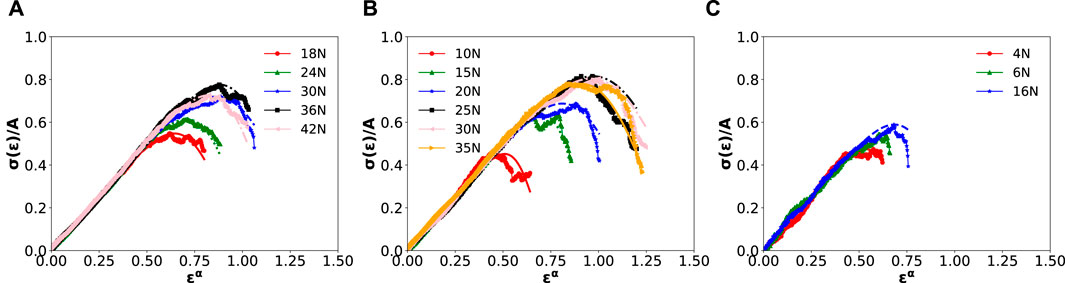
Figure 5. Scaled stress-distance curves
Figure 5 illustrates the validity of the used strain-hardening ansatz, showing good fits for all strain-stress curves for specimens with 441, 361, and 114 features per 25
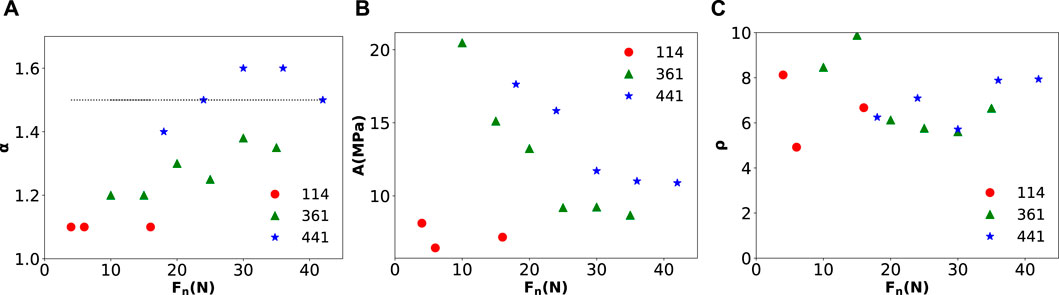
Figure 6. Resulting fitting parameters as a function of the preload intensity
A surprising result of the present analysis is that the power law exponent
For a Weibull distribution of bond breaking thresholds, the strength disorder is set by the parameter
4 Signal of upcoming catastrophic failure
In the past, several authors have proposed a thermodynamic frameworks of the statistical failure of elastic fiber bundles, using a variety of threshold distributions
indicates the upcoming stretching-induced failure [13, 27]. They found that the elastic energy in Eq. 7 has a maximum at a particular value, which we define as
However, the authors obtained analytically that
We used a strain-hardening ansatz (vide supra) to describe the non-linearity of the initial loading regime. Similarly, we interpret our results by introducing a generalized elastic energy:
The average damage energy that is lost when each fiber breaks reads as
where the first term in Eq. 9 accounts for the total average work required to stretch the system.
Figure 7 shows
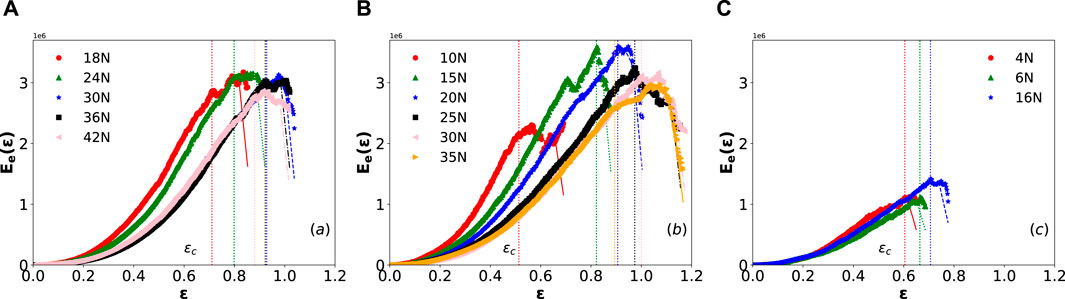
Figure 7. Elastic energy as a function of the system deformation, each of the panels presents data collected with adhesive pads numbering (A) 441, (B) 361, and (C) 114 features per 25
Can the damage energy then be used to forecast failure? We analyze the evolution of the ratio between the damage and the elastic energy
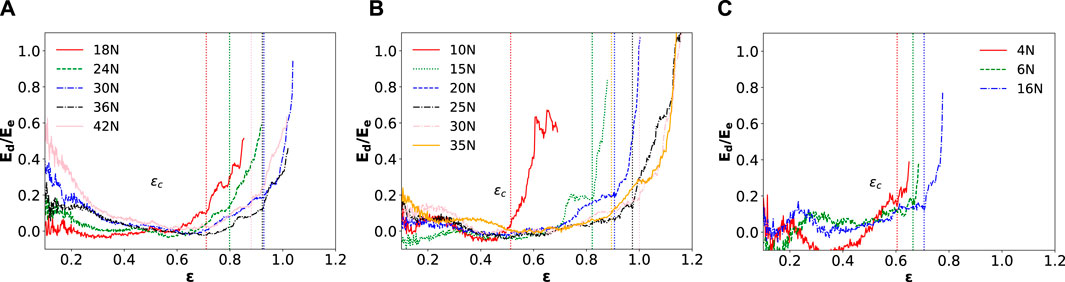
Figure 8. Ratio between the damage and the elastic energy as a function of the system deformation, with systems of (A) 441, (B) 361, and (C) 114 features per 25
Finally, we examine the change in elastic energy
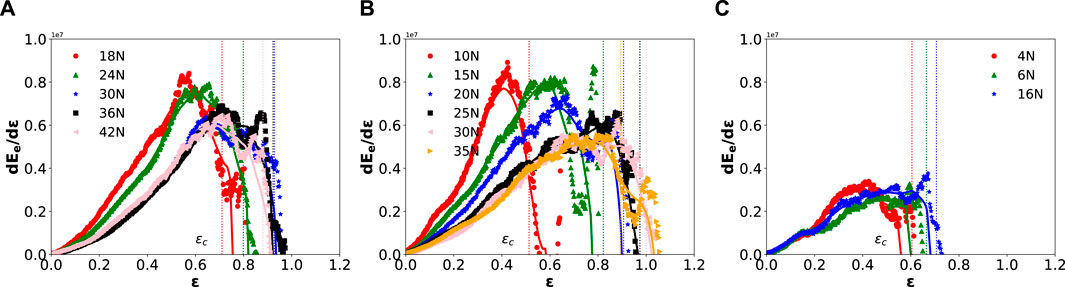
Figure 9. We plotted the numerical derivative of the elastic energy
The previous observations are summarized in Figure 10. On the one hand, Figure 10A shows the stress at elastic energy maximum
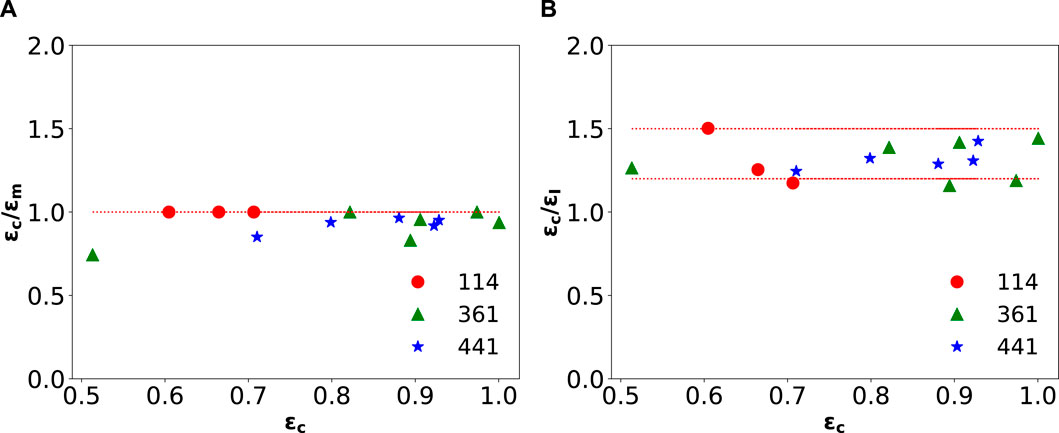
Figure 10. The relative location of the (A) elastic energy maximum
Summarising: we quantified the performance of a mechanical adhesive based on a pattern of passive mushroom-shaped structures. We observed that the stretching of fibers induces tension at the intersection points, leading to a progressive stiffening of the fiber network with the stress a power law in strain. We show that an FBM reproduces the experimental results after incorporating adjustments to capture the initial non-linear force response emergent at higher feature densities,
Our work validates the approach to predicting the catastrophic failure of Pradhan and co-authors, which has so far been supported with numerical work [13, 27]. As per the approach, we quantified the elastic and damage energy as the fiber-adhesive assembly is stretched under strain-controlled conditions. Stress-strain curves revealed that the elastic energy reaches a maximum after
Data availability statement
The raw data supporting the conclusions of this article will be made available by the authors, without undue reservation.
Author contributions
AF: Conceptualization, Data curation, Investigation, Methodology, Software, Visualization, Writing–original draft, Writing–review and editing. PS: Data curation, Investigation, Writing–review and editing. FH: Data curation, Writing–review and editing. JD: Conceptualization, Formal Analysis, Funding acquisition, Investigation, Methodology, Project administration, Resources, Supervision, Writing–review and editing. RH: Conceptualization, Formal Analysis, Funding acquisition, Investigation, Methodology, Project administration, Resources, Software, Validation, Visualization, Writing–original draft, Writing–review and editing.
Funding
The author(s) declare that financial support was received for the research, authorship, and/or publication of this article. Funding from the 4.TU Federation through the program “Soft Robotics” with grant number 4TU-UIT-335 is gratefully acknowledged. RH acknowledges the Ministerio de Ciencia e Innovación (Spanish Government) Grant PID2020-114839GB-I00 funded by MCIN/AEI/10.13039/501100011033.
Conflict of interest
The authors declare that the research was conducted in the absence of any commercial or financial relationships that could be construed as a potential conflict of interest.
Publisher’s note
All claims expressed in this article are solely those of the authors and do not necessarily represent those of their affiliated organizations, or those of the publisher, the editors and the reviewers. Any product that may be evaluated in this article, or claim that may be made by its manufacturer, is not guaranteed or endorsed by the publisher.
References
1. Smith CW, Gorb SN, Popov VL. Probabilistic Fasteners with Parabolic Elements: Biological System, Artificial Model and Theoretical Considerations. Philos Trans R Soc Lond Ser A: Math Phys Eng Sci (2002) 360:211–25. doi:10.1098/rsta.2001.0926
2. Fiorello I, Tricinci O, Naselli GA, Mondini A, Filippeschi C, Tramacere F, et al. Climbing Plant-Inspired Micropatterned Devices for Reversible Attachment. Adv Funct Mater (2020) 30:2003380. doi:10.1002/adfm.202003380
3. Zhang T, Liang T, Yue X, Sameoto D. Integration of Thermoresponsive Velcro-Like Adhesive for Soft Robotic Grasping of Fabrics or Smooth Surfaces. In: 2019 2nd IEEE international Conference on soft Robotics (RoboSoft). Seoul, Republic of Korea: IEEE (2019). p. 120–125. doi:10.1109/ROBOSOFT.2019.8722743
4. Mestral Gd. Velvet Type Fabric and Method of Producing Same (Velcro®). U.S. Patent No. 2,717,437 (1955).
5. Melbye WL, Susan KNE, Wood L, Lindseth MD, Bychinski DA. Mushroom-Type Hook Strip for A Mechanical Fastener. U.S. Patent No. 5,077,870 (2003).
6. Sharma P, Saggiomo V, Van Der Doef V, Kamperman M, A Dijksman J. Hooked on Mushrooms: Preparation and Mechanics of a Bioinspired Soft Probabilistic Fastener. Biointerphases (2021) 16:011002. doi:10.1116/6.0000634
7. Kun F, Raischel F, Hidalgo R, Herrmann H. Extensions of Fibre Bundle Models. Berlin, Heidelberg: Springer Berlin Heidelberg (2006). 57–92.
8. Pradhan S, Hansen A, Chakrabarti BK. Failure Processes in Elastic Fiber Bundles. Rev Mod Phys (2010) 82:499–555. doi:10.1103/RevModPhys.82.499
9. Hansen A, Hemmer PC, Pradhan S eds. The Fiber Bundle Model: Modeling Failure in Materials. John Wiley and Sons (2015).
10. Creton C, Ciccotti M. Fracture and Adhesion of Soft Materials: A Review. Rep Prog Phys (2016) 79:046601. doi:10.1088/0034-4885/79/4/046601
11. Hidalgo RC, Moreno Y, Kun F, Herrmann HJ. Fracture Model with Variable Range of Interaction. Phys Rev E (2002) 65:046148. doi:10.1103/PhysRevE.65.046148
12. Batool A, Pál G, Danku Z, Kun F. Transition from Localized to Mean Field Behaviour of Cascading Failures in the Fiber Bundle Model on Complex Networks. Chaos, Solitons and Fractals (2022) 159:112190. doi:10.1016/j.chaos.2022.112190
13. Arango-Restrepo A, Rubi JM, Pradhan S. A Thermodynamic Framework for Stretching Processes in Fiber Materials. Front Phys (2021) 9. doi:10.3389/fphy.2021.642754
14. Chakrabarti BK. A Fiber Bundle Model of Traffic Jams. Physica A: Stat Mech its Appl (2006) 372:162–6. Common Trends in Traffic Systems. doi:10.1016/j.physa.2006.05.003
15. Long R, Hui C-Y, Kim S, Sitti M. Modeling the Soft Backing Layer Thickness Effect on Adhesion of Elastic Microfiber Arrays. J Appl Phys (2008) 104:044301. doi:10.1063/1.2968249
16. Halász Z, Kun F. Slip Avalanches in a Fiber Bundle Model. Europhysics Lett (2010) 89:26008. doi:10.1209/0295-5075/89/26008
17. Mulla Y, Oliveri G, Overvelde JT, Koenderink GH. Crack Initiation in Viscoelastic Materials. Phys Rev Lett (2018) 120:268002. doi:10.1103/physrevlett.120.268002
18. Capelli A, Reiweger I, Schweizer J. Studying Snow Failure with Fiber Bundle Models. Front Phys (2020) 8. doi:10.3389/fphy.2020.00236
19. Kádár V, Pál G, Kun F. Record Statistics of Bursts Signals the Onset of Acceleration towards Failure. Scientific Rep (2020) 10:2508. doi:10.1038/s41598-020-59333-4
20. Chandreyee R, Manna S. Brittle-to-quasibrittle Transition in Bundles of Nonlinear Elastic Fibers. Phys Rev E (2016) 94:032126. doi:10.1103/PhysRevE.94.032126
21. Kabla A, Mahadevan L. Nonlinear Mechanics of Soft Fibrous Networks. J R Soc Interf (2007) 4:99–106. doi:10.1098/rsif.2006.0151
22. Cranford SW, Tarakanova A, Pugno NM, Buehler MJ. Nonlinear Material Behaviour of Spider Silk Yields Robust Webs. Nature (2012) 482:72–6. doi:10.1038/nature10739
23. Storm C, Pastore JJ, MacKintosh FC, Lubensky TC, Janmey PA. Nonlinear Elasticity in Biological Gels. Nature (2005) 435:191–4. doi:10.1038/nature03521
24. Picu R. Mechanics of Random Fiber Networks—A Review. Soft Matter (2011) 7:6768–85. doi:10.1039/c1sm05022b
25. Hu J, Xin B (2008). “Structure and mechanics of woven fabrics,” in Structure and Mechanics of Textile Fibre Assemblies. 2nd Edn, Editors P. Schwartz (Woodhead Publishing), 27–60. The Textile Institute Book Series. Available at: https://www.sciencedirect.com/science/article/pii/B978008102619900002X. doi:10.1016/B978-0-08-102619-9.00002-X
26. Pride SR, Toussaint R. Thermodynamics of Fiber Bundles. Physica A: Stat Mech its Appl (2002) 312:159–71. doi:10.1016/S0378-4371(02)00816-6
27. Pradhan S, Kjellstadli JT, Hansen A. Variation of Elastic Energy Shows Reliable Signal of Upcoming Catastrophic Failure. Front Phys (2019) 7. doi:10.3389/fphy.2019.00106
28. Soumyaditya D, Soumyajyoti B. Critical Scaling through Gini Index. Phys Rev Lett (2023) 131:157101. doi:10.1103/PhysRevLett.131.157101
Appendix
Figure A1 shows the non-linear fitting with the power-law-modified FBM of Eq. 6 of our experimental stress–strain data. The obtained Weibull parameters are included as insets.
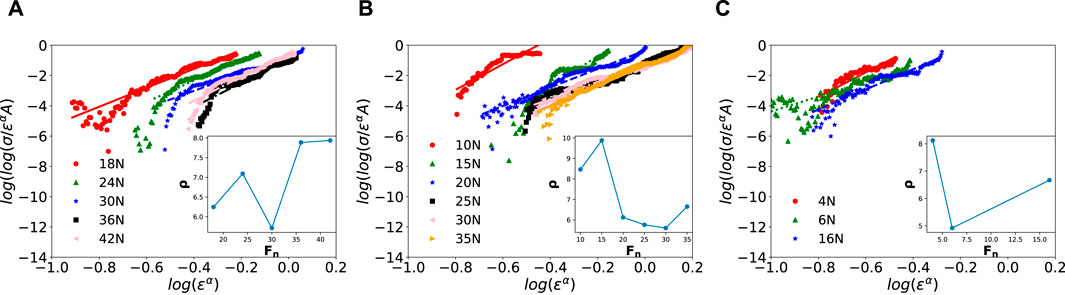
FIGURE A1. Fits of the double-logarithmic stress versus the logarithmic strain to the Weibull distribution given in Eq. 6 with power-law onset. Each panel represents a different feature count: (A) 441, (B) 361, and (C) 114 features per 25
Keywords: FBM, adhesion, soft matter, bio-inspired adhesives, strain hardening, non-linear elasticity
Citation: Filippov AD, Sharma P, Helmendach F, Dijksman JA and Hidalgo RC (2024) Fibre bundle models as a framework for the detachment dynamics of soft probabilistic fasteners. Front. Phys. 12:1412352. doi: 10.3389/fphy.2024.1412352
Received: 04 April 2024; Accepted: 21 June 2024;
Published: 13 August 2024.
Edited by:
Loic Vanel, Université Claude Bernard Lyon 1, FranceReviewed by:
Christophe Poulard, Université Paris-Saclay, FranceSoumyajyoti Biswas, SRM University, India
Sumanta Kundu, International School for Advanced Studies (SISSA), Italy
Copyright © 2024 Filippov, Sharma, Helmendach, Dijksman and Hidalgo. This is an open-access article distributed under the terms of the Creative Commons Attribution License (CC BY). The use, distribution or reproduction in other forums is permitted, provided the original author(s) and the copyright owner(s) are credited and that the original publication in this journal is cited, in accordance with accepted academic practice. No use, distribution or reproduction is permitted which does not comply with these terms.
*Correspondence: R. C. Hidalgo, cmF1bGNydXpAdW5hdi5lcw==; J. A. Dijksman, ai5hLmRpamtzbWFuQHV2YS5ubA==