 Xinyi Wang1
 Yuexia Zhang
 Siyu Zhang
94% of researchers rate our articles as excellent or good
Learn more about the work of our research integrity team to safeguard the quality of each article we publish.
Find out more
ORIGINAL RESEARCH article
Front. Phys., 19 June 2024
Sec. Social Physics
Volume 12 - 2024 | https://doi.org/10.3389/fphy.2024.1410472
This article is part of the Research TopicNetwork Learning and Propagation Dynamics AnalysisView all 14 articles
By caching popular content on edge servers closer to users to respond to users’ content requests in 6G networks, the transmission load of backhaul links can be reduced. However, the time-varying characteristics of content prevalence leads to the issue that the cache content may not match the user’s needs, resulting in a decrease in cache success ratio. To solve these issues, we proposed a cache distribution strategy based on epidemic dynamics (CDSED) for 6G edge network. First, a 6G edge caching content model (6G ECCM) is constructed to establish the process of cache content propagation among users as an infectious disease propagation process, analyze the distribution of users’ interest in cache content and obtain the cache content state probability prediction equation, and use the cache content state probability prediction equation to predict the cache content prevalence. Second, based on the predicted prevalence results, a prevalence predictive genetic-annealing cache content algorithm (PGAC) is proposed with the optimization objective of maximizing the cache success ratio. The algorithm designs the selection function of the traditional genetic algorithm as a simulated annealing selection function based on the cache content success ratio, which avoids the defect of the genetic algorithm that converges to the locally optimum cache strategy too early and enhances the cache success ratio. Finally, the optimum cache content decision is solved by iterative alternation. Simulation results demonstrate that CDSED strategy can enhance cache success ratio than the LRU strategy, the LFU strategy, and the MPC strategy.
6G mobile communication network will support a variety of applications, for instance immersive cloud augmented reality, autonomous driving, holographic communication, smart manufacturing and other new applications [1–3]. These new applications bring convenience to people’s lives, but also inevitably increase mobile data traffic. And when popular services are repeatedly requested in a short period of time, 6G cloud server backhaul is facing tremendous pressure [4–6]. In order to fulfill the application requirements and reduce the pressure on the cloud server, the edge caching technology allows for service content caching on edge servers, enabling users to retrieve content from these edge servers to meet their repetitive requests, so as to cope with the swift expansion of 6G wireless service load and significantly reduce the transmission load of 6G cloud server [7–9]. Therefore, the research of edge caching technology is of paramount importance for 6G.
Compared with the large-scale user request content, the cache resources of the edge network are limited. This means that only a small amount of popular content requested by users can be pre-cached on the edge of the network. However, a plentiful amount of content is generated at every moment in real life. How to find popular content requested by users in a massive content repository is a very challenging problem. At present, most caching strategies adopt rule-based content caching methods, such as Least Recently Used (LRU) [10] and Least Frequently Used (LFU) [11]. Although these strategies achieve real-time updates of cache content at the edge network, they do not fully exploit the content request patterns of users at different time points, leading to an inability to accurately perceive the prevalence patterns of different content at future moments, making it difficult to achieve accurate prediction of content prevalence.
The fundamental purpose of edge caching is to decide what content to cache in edge servers [12,13], and prediction of content prevalence is a major issue in existing caching research. Many researchers have explored the field of content prevalence prediction and proposed various caching strategies. Wu et al.[14] introduced a collaborative caching strategy based on a social-aware graph to minimize content download latency, caching the most popular content based on weighted content prevalence. Sun et al.[15] proposed an intelligent gateway-assisted edge caching strategy, using a predictive algorithm based on heterogeneous information networks to anticipate end-user preferences for new content files. Zhu et al.[16] studied multi-layer collaborative edge caching in integrated space-ground networks, formulating a content placement problem based on content prevalence to minimize users’ average content retrieval delay. Wang et al.[17] proposed a vehicle-to-vehicle collaborative caching strategy based on content request prediction, using historical content request information and a reinforcement learning method to obtain optimum caching decisions. Ayenew et al.[18] proposed a collaborative demand-aware caching strategy based on the separable allocation problem, solving the cache success ratio maximization problem using recursive enumeration. Tang et al.[19] modeled user request behavior and user preferences using MDP and Zipf distribution, and proposed a new reinforcement learning-based algorithm to reveal file prevalence and user preferences. Zhu et al.[20] developed an AoI-based time attention graph neural network to maximize the accuracy of user interest prediction. Liu et al.[21] designed a context-aware prevalence learning algorithm to adapt to the changing trend of content prevalence. However, most of the aforementioned caching strategies assume that content prevalence follows a static distribution. In actual scenarios, content prevalence is time-varying and usually not known in advance, as user interest in a cache content can spread through word-of-mouth in social networks, leading to the time-varying nature of content prevalence in the entire network [22]. Therefore, static prevalence distribution models cannot accurately describe the dynamic characteristics of content prevalence.
Users’ interests are constantly changing, and new content is constantly being generated [23,24]. Thus, some researchers have proposed learning-based caching algorithms to adapt to the changing prevalence of content. Zhang et al.[25] designed a learning-based edge collaborative caching scheme, using a temporal convolutional network to predict the prevalence of future content. Mehrizi et al.[26] developed a Bayesian dynamic model of content requests, which can accurately predict prevalence using spatiotemporal correlation. Nguyen et al.[27] proposed a caching strategy based on a hierarchical deep learning architecture to maximize cache success ratio by predicting networks and user environments. Tao et al.[28] proposed a prevalence prediction strategy based on a content feature-based content request probability model, in which model parameters are learned through Bayesian learning. Li et al.[29] proposed a similarity-based content popularity prediction method to predict the popularity of new content by introducing a dynamic content directory. Jiang et al.[30] proposed a method to guarantee the accuracy of prevalence prediction by predicting user locations and analyzing request data of specific users in the next time period. Gao et al.[31] designed a probability-based content placement and replacement strategy, aiming to increase cache success ratio under changing instantaneous content prevalence and converge to target content cache probability under constant instantaneous content prevalence. Fan et al.[32] proposed an evolving learning-based content caching strategy, which can adaptively learn the changing prevalence of content over time and determine which content should be replaced when the cache is full. A caching scheme based on private federated learning is proposed [33], which uses a federated learning framework and a pseudo-rating matrix to collect statistical features of user groups by predicting the prevalence of content. Although the above-mentioned research considers the time-varying characteristics of content prevalence, they rarely consider the impact of caching strategies on user content propagation. In the edge network with limited caching resources, caching affects the propagation of content among users, thereby affecting the prevalence of content. Moreover, the above-mentioned learning-based prevalence prediction algorithms rely on large amounts of historical data and trained models, resulting in high training complexity and are not suitable for new popular content.
In summary, although many studies have shown that learning-based edge caching algorithms significantly improve cache performance in predicting content popularity, in practical scenarios, user interests are constantly changing and new content continues to emerge. The above-mentioned algorithms rely heavily on a large amount of historical data, which mainly reflects past user behaviors and interests. However, these data may not capture users’ immediate interest changes in new content, making them unsuitable for new popular content. Additionally, the allocation of cache resources can affect the dissemination of content among users, thereby influencing content popularity. Therefore, optimizing cache performance based on popularity prediction in scenarios where content popularity is constantly changing and typically unknown has become a critical issue that needs to be addressed.
In view of the above problems, this paper proposes a cache distribution strategy based on epidemic dynamics for 6G edge network. This strategy studies the influence of cache content propagation process and content prevalence based on the epidemic model in 6G edge network. According to the prevalence prediction results of the content, a genetic simulated annealing cache content algorithm is proposed to provide the optimum cache strategy for the 6G edge caching network to maximize the cache success ratio, thereby improving the cache performance.
The primary contributions of this paper can be outlined as follows:
1) The 6G ECCM is established, and the user’s interest state distribution of the cache content is analyzed and the user’s cache content state probability prediction equation is obtained, and the content prevalence prediction is realized from the perspective of the user individual.
2) Then this study proposed a prevalence predictive genetic-annealing cache content algorithm, which redesigned the selection function based on the traditional genetic algorithm and incorporated simulated annealing selection, using the cache success ratio, into chromosome selection, thereby improving the cache success ratio.
3) In a scenario involving a single edge service base station network, an experiment was designed to compare the CDSED, LFU, LRU, and MPC strategies, validating the cache optimization effect of the CDSED strategy.
The rest of this paper is organized as follows: In Section 2, the System Model is introduced. In Section 3, Section 4, the optimization problem and PGAC algorithm are proposed. In Section 5, the performance of the CDSED strategy is evaluated, and the simulation results and analysis are given. In Section 6, the conclusion of this paper is proposed.
In this paper, we construct a 6G edge caching network, as shown in Figure 1, which is composed of a 6G cloud content repository, M edge service base stations and N users. The 6G cloud content repository consists of cloud servers that store all the cache contents. Assuming that there are K contents to be cached within the edge service base stations, the set of cache contents can be indicated as f = {f1, f2, … , fk, … , fK}, fk is expressed as the kth cache content with size Ck bit. The set of edge service base stations is indicated by set B = {B1, B2, … , Bm, … , BM}. Each edge service base station has a certain storage capacity. However, it can only store content that satisfies the needs of some users because of the limitation of the cache capacity of the base station. The set of cache resources of the edge service base station is represented by set
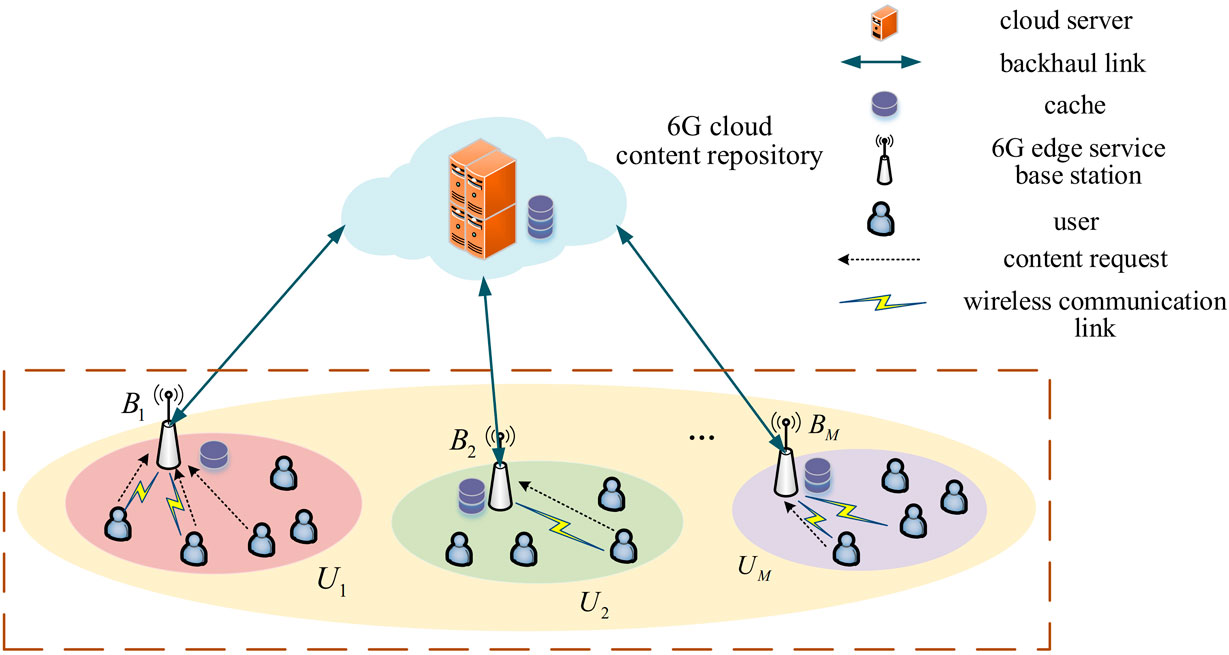
Figure 1. 6G edge caching network.
Since the edge service base station has a certain service range, all users in the 6G edge caching network are divided into M user subsets, denoted as U = {U1, U2, … , Um, … , UM}. This means that all users under the service range of each edge service base station are categorized into one user set, and each user can only communicate with the edge service base station within the user set in which it is located, where Um indicates the set of users who under the service area of the edge service base station BM,
All 6G edge service base stations can serve as edge servers in the 6G edge caching network. These base stations caching content from the cloud server based on prevalence prediction. Users is curious about the cache content, they will first expresses its demand by sending a content request to the 6G edge service base station. If the requested cache content is already cached, it will be transmitted directly to the user through the wireless communication link, completing the download process. If the 6G edge service base station has not cache the requested content, it must communicate with the 6G cloud content repository through the backhaul link and download the requested content from the 6G cloud content repository.
An edge service base station caching a particular piece of content may affect other users in the neighboring area, leading them to download the same content. This content download can spread among the user community, creating a process similar to the spread of an epidemic over time [34,35]. Therefore, the process of spreading cache content among users can be modeled by the process of spreading epidemics.
Considering that users who receive content do not immediately forward it to other users, but rather need some time to contemplate, understand, or decide whether to forward it, which is closer to the actual propagation process among users, this paper uses the SEIRD model to simulate the content propagation process among users and defines the user’s propagation state about the cache content fk as follows:
S: the user does not have access to information about the cache content fk.
E: Users are influenced by cache content commended by other users and may be curious about that cache content fk. At the same time, users send requests to the edge service base station and wait to obtain the cache content. Users may also choose to ignore commendations from other users regarding cache content.
I: users are curious about cache content fk and have successfully obtained content fk from the service base station.
D: the user downloads the cache content fk from the edge service base station BM and commends it to the neighboring users.
R: the user are not curious about cache content fk or users lose interest in cache content fk after acquiring it. They can neither influence nor be influenced by others, and they do not actively commend the cache content fk to other users.
This study supposed that the user is in state S at the initial moment, and they reaches out to the user in state D through the social network, it becomes in state E. State E user does next with the cache content fk is divided into two scenarios: one is that he is not curious about the cache content fk and transitions directly from the E state to the R state, and the other scenario is that it is curious about the cache content fk and stays in the E state. The state is transformed from E to I when the user acquires fk. Considering the selfishness of the user, after acquiring the cache content fk, the user may choose not to commend the content to other users, or it may transform to D state to give the cache content to other users by word-of-mouth. Finally, the user may lose their interest in the cache content after acquiring it, and the user state is transformed from I or D state R state.
By analogizing this state transfer process with the infectious disease process, a 6G ECCM is established, as shown in Figure 2. In this paper, we use
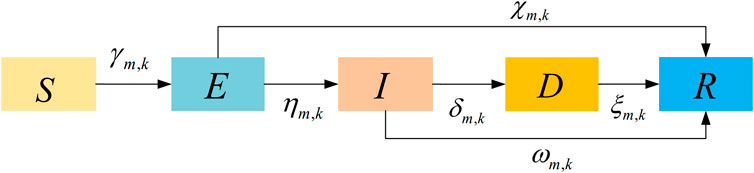
Figure 2. 6G edge caching content model.
γm,k is the influence rate, the probability that user
where ς is the probability of establishing a social relationship between user
ηm,k is the service rate, the probability that a user in state E can successfully acquire the cache content fk from the edge service base station. The channel capacity [36] between edge serving base station Bm and user
where Wm is the channel bandwidth, Pm is the transmission power of the edge service base station Bm, and
The ability of a user to access the cache content from the edge service base station is affected by the backhaul link capacity between the edge service base station and the cloud content repository, the channel capacity between the user and the edge service base station, and the magnitude of the cache content, and the total count of users able to access the content from the edge service base station needs to satisfy a certain requirement, and thus the service rate can be calculated as:
where
Then we substitute Eq. 9 into Eq. 8 can be derived:
The location of the user obeys the Poisson distribution, and according to the probability calculation formula of Poisson distribution, Eq. 10 can be formulated as:
Substituting
δm,k is the commendation rate, the probability that a user will commend the cache content fk to other users.
χm,k is refusal rate, the probability that user is not favor of fk.
ωm,k and ξm,k are loss rate, the probability that user loses interest in fk after acquiring it.
It is difficult to directly solve the specific expressions for
The right side of Eq. 14 represents the probability that
The first part of the right-hand side in Eq. 15 indicates the probability that the user is in the state E at the moment t + 1 after accessing the cache content; The second part signifies the probability of the user remaining in state E from moment t to the moment t + 1.
Similarly, the first part of Eq. 16 denotes the probability that the user
The first part of Eq. 17 is the probability that the user turns into D state with the probability of δm,k and commend the content to the neighboring users; the second term represents that the user keeps the original state unchanged with probability 1 − ξm,k at the moment t + 1.
The first three parts on the right-hand side of Eq. 18 are the probabilities that the user is known at moment t to turn into state R by moment t + 1; and the fourth term represents the probability that the user keeps the state R unchanged from moment t to moment t + 1.
where ϖjn denotes the closeness between user
Eqs 14–19 are organized into matrix form, which leads to the form of the equation expressed as follows:
The propagation state probability transition matrix
In accordance with the state transition matrix in Eq. 21, the user cache content state probability prediction equation of content fk can be obtained as follows:
Therefore, the total count of users in the S, E, I, D, and R states at time t:
In this paper, we concentrate on caching decisions for edge service base stations, without considering the case where the user acquires the cache content directly from the cloud server. The caching strategy needs to maximize the user’s demand, i.e., maximize the cache success ratio. However, with the increasing demand for cache content in the 6G edge caching network, the edge service base station faces the challenge that the limited cache capacity cannot meet all users’ demand, so this paper takes maximizing the cache success ratio as the optimization objective. Define cache success ratio
where
where constraint C1 indicates that it is not possible to cache all the cache content in the 6G cloud content repository on the edge service base station; C2 satisfies the cache capacity limitation of the edge service base station, and the total magnitude of the cache content cached in the edge service base station must not exceed the magnitude of the caching capacity of the edge service base station; C3 represents the caching decision of the cache content by the edge service base station, and sm,k is a Boolean variable taking the value of 0 or 1.
The search space in the cache optimization problem in Eq. 34 contains discrete variables and it is an integer linear programming (ILP) problem. This type of problem is also an NP-hard problem, which is difficult to solve directly in general. Heuristic algorithms such as genetic algorithms and simulated annealing algorithms have convenient properties in solving optimization problems containing discrete variables [37,38]. Therefore, this paper proposes a PGAC algorithm, which combines the genetic algorithm and simulated annealing algorithm to solve the optimum caching scheme.
Chromosome: a chromosome corresponds to an individual object in a solution in an optimization problem, i.e., a possible solution. In this paper, a chromosome is represented as a possible caching solution. Each chromosome is a solution consisting of genes. In this problem, the length of the chromosome is usually M, because there are M edge service base stations in this paper, and each gene represents the caching decision state of the corresponding edge service base station.
Genes: Each gene in the chromosome represents the caching status of the corresponding edge service base station, i.e., whether or not the content is cached. Each gene is encoded in binary. 0 represents that the edge service base station has not cached the content; 1 represents that the edge service base station has cached the content. In the proposed 6G edge cache propagation model, there are a total of K cache contents, and each edge service base station needs to make a decision on these K cache contents. That is each content can choose whether to be cached within the edge service base station or not.
The chromosomes and genes are expressed in a matrix form, where each row represents a chromosome and each column represents a gene. In the problem of cache allocation using genetic algorithm in edge caching network, define a matrix of M × K, where M is the total count of edge service base stations and K is the total count of cache contents as represented below:
Each element of the matrix Eq. 35 may be 0 or 1 indicating whether the corresponding edge service base station caches the corresponding cache content. Through this matrix representation, a chromosome corresponds to a row of the matrix and each gene corresponds to an element of the matrix. A genetic algorithm is used to generate a new chromosome by performing crossover, mutation, and other operations on this matrix.
The optimization problem Eq. 34 is a maximization problem. Therefore, for the chromosome in this paper, a larger fitness value indicates a better solution, suggesting that the solution represented by this chromosome is closer to the optimum solution. The fitness function is represented as follows:
A higher fitness value corresponds to a greater cache success ratio, indicating that the corresponding caching strategy is more optimum.
Crossover: A single point crossover is used to combine two separate chromosomes to generate a new chromosome in this paper, and the new chromosome is generated by exchanging some genes of the selected chromosome based on randomly generated crossover sites, with an adaptive crossover probability pc:
where fitmax, fitmin and fitavg are defined as the maximum fitness value, the minimum fitness value and the average fitness value of all chromosomes in the population, respectively; k1 is a constant in the interval [0,1];
Mutation: The chromosomes in the population are mutated with an adaptive mutation probability pe, where pe can be represented as:
where k2 is a constant in the interval [0,1];
In order to enhance the local search capability of the genetic algorithm, this paper introduces a simulated annealing selection method instead of the roulette algorithm for chromosome selection. The simulated annealing selection algorithm utilizes the Metrospolis criterion [39] to select chromosomes by first randomly selecting chromosome I1 from the initialized chromosome population P1 generated after the chromosome correction step, which has a fitness value of fit (I1). Then chromosome I2 is randomly selected from the newly generated chromosome population P2 generated after the crossover and mutation step, which has a fitness value of fit (I2). Setting the temperature of the simulated annealing method as T, the probability of I2 being selected into the new chromosome result set P3 with probability P:
If the fitness of chromosome I2 in population P2 is greater than that of chromosome I1 in population P1, I2 will definitely be selected to be placed in the new result set P3; However, if the fitness of chromosome I1 is greater than that of chromosome I2, I2 still has a probability
The Chromosome Check method is used to check if all the chromosomes are within the constraints and if there are gene points that are not within the constraints, this check method will correct all the relevant chromosome gene points based on the cached parameters of the service base station. This step will be used after all the steps where new chromosomes need to be generated to ensure that the newly generated chromosomes meet the constraints. Chromosome correction is the core of the chromosome test method.
Chromosome correction: the correction of chromosomes that do not meet the constraints. The content of sm,k = 1 is sorted from largest to smallest according to the cache value
Figure 3 shows the general flowchart of the genetic simulated annealing algorithm. First the entire population is generated based on the total count of chromosomes in the population. Then new chromosomes are generated using single-point crossover and mutation, and the chromosome fitness in the population is calculated separately, and finally the simulated annealing selection method is used to select chromosomes for the new population based on the ordering of fitness. In this case, genetic adjustment of all chromosomes is required after the initialization of the population and crossover mutation steps to ensure that they do not fall outside the constraints.
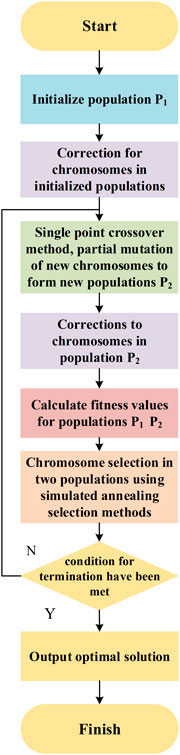
Figure 3. Flowchart of the genetic simulated annealing algorithm.
The PGAC algorithm comprises two parts: first, the prevalence of cache content is predicted based on the probabilistic prediction equation of cache content state in Eqs 22–26. Then, the genetic simulated annealing algorithm is used to acquire the optimum caching scheme based on the predicted prevalence results. In summary, the specific flow of the genetic simulated annealing cache content algorithm is shown in Algorithm 1 below.
Algorithm 1.PGAC.
Input: At initial moment t = 0, calculate the influence rate, service rate, initialize the population size, the total count of genetic algorithm iterations, initial temperature of simulated annealing, Cooling coefficient, adaptive crossover probabilityand adaptive mutation probability.
Calculate the proportion of users in each state according to Eqs 20–26, predict the number of users in each state using Eqs 27–31, and obtain the content popularity from Eq. 32.
Use the chromosome correction method to correct the chromosomes in the initial population;
for i = 1 to nGA do:
Mutate and cross all chromosomes in population P1 according to Eqs 37, 38, generating a new population P2
Use the chromosome correction method to correct the chromosomes in population P2
Calculate the fitness of each chromosome in the initial population P1 and the newly generated population P2 according to Eq. 36.
Calculate the probability of chromosomes being selected according to Eq. 39 and place the selected chromosomes into population P3;
Until the total count of chromosomes in P3 is equal to num;
P3 = P1, T = θT;
end for;
Calculate the fitness for each chromosome in population P1;
I* = the chromosome with the highest fitness;
return I*
t = t + 1
end
content cache finished.
Output: optimum caching scheme
In this paper, the CDSED strategy is simulated and verified based on Matlab platform. To simplify the processing, the whole 6G edge caching network consists of a single edge service base station with several users, the service area of the edge service base station is a circular area with a radius of 50 m, the users obey a Poisson distribution with a density of 0.2. The generation and propagation of all contents are randomized for easy comparison, with ξk, ωk and χk between 0.01 ∼ 0.05 for each cache content [40], and γk uniformly distributed between 0.1 ∼ 0.5 [41]. The primary simulation parameters are displayed in Table 1:
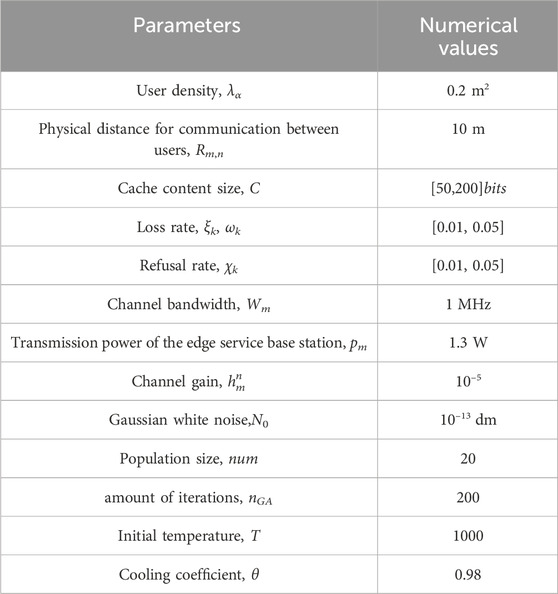
Table 1. Simulation parameters
In the simulation process, the caching performance of CDSED strategy is compared with LRU strategy [10], LFU strategy [11] and MPC strategy [42] respectively.
1. Least Recently Used (LRU) caching strategy: if cache content has been requested in the recent period, then there is a high chance that the cache content will be requested in the future period. When the cache space of the base station is full, the content that has not been requested for the longest time in the recent period is deleted.
2. Least Frequently Used (LFU): The edge service base station records the total count of requests for each cache content. When the total count of requests for an edge service base station’s uncache content is greater than the total count of requests for the least cache content, the edge service base station removes the least requested content and caches it.
3. Most Popular Caching (MPC): The edge service base station caches the most popular content within the service area until the cache capacity limit of the edge service base station is reached.
This paper describes the change in the total count of users in each interest propagation state during content dissemination when the sum total of users is 200. The black solid line, pink dotted line, red dashed line, cyan dotted line and blue dotted line shown in Figure 4 represent the changes in the total count of S, E, I, D, and R state users, respectively. From the figure, it can be seen that there are a large amount of S state users in the 6G edge caching network at the initial moment, and they are easily influenced by the commendations of other users to change their state and become E state users. With the passage of time, the total count of E state users increases rapidly, and they become I state users after acquiring the cache content, and the corresponding amount of E state users decreases. I state users commend the interest of cache content on their own terms. However, with the increase of time and the propagation of the cache content, the interest of the user may gradually weaken, resulting in the user changing from the I state and the D state to the R state. The total count of the I state and the D state users are decreasing, and the state of the user remaining unchanged in the R state. Therefore, the trends of S, E, I, D, and R curves are consistent with the results in the theoretical analysis.
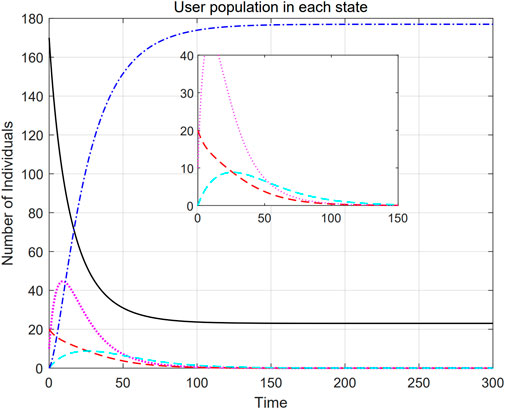
Figure 4. Amount of users in each state during content distribution.
Figure 5 illustrates the results of content prevalence for different amount of users. In the figure, the horizontal coordinate is time and the vertical coordinate is the content prevalence. In addition, the curves with blue crosses, red triangles and yellow circles in the figure represent the change in content prevalence for user numbers of 100, 200 and 300, respectively. From the figure, it can be seen that the trend of the curves for all three cases of amount of users is increasing and then decreasing to zero, which is in line with the pattern of cache content in 6G edge caching networks. This is because newly released cache content quickly arouses the interest of neighboring users, leading to a rapid increase in the total count of users curious about the cache content across the 6G edge caching network, and accordingly triggering a significant rise in requests for that cache content as well as an increase in the prevalence of the content. After a period of time, the user interest in the cache content in the 6G edge caching network gradually becomes saturated and users are no longer curious about the cache content. This ultimately leads to a gradual decrease in user interest in the cache content and a corresponding decrease in the prevalence of the content. As a result, the total count of new interested users tends to decrease in the next time period and eventually stabilizes until it reaches zero.
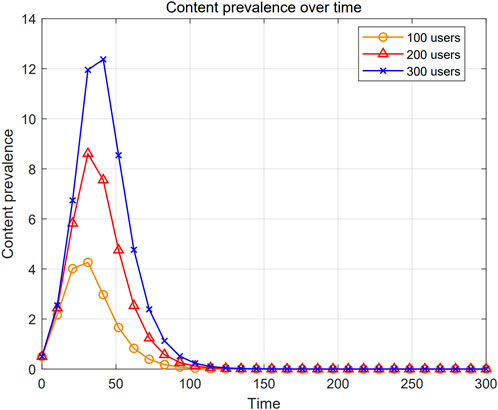
Figure 5. Content prevalence prediction results.
The variation of cache success ratio at different times when simulating different caching strategies is shown in Figure 6. In the figure, the horizontal axis represents the time and the vertical axis represents the cache success ratio. In addition, the graph with circle, triangle, rectangle and diamond curves represent CDSED strategy, MPC strategy, LFU strategy and LRU strategy respectively. From the figure, it is evident that average cache success ratio of CDSED strategy is 0.645, while the average cache success ratios of LFU, MPC, and LRU strategies are 0.579, 0.517, and 0.482, indicating that the cache hit rate of the CDSED strategy is higher than the other three strategies. This is because, the LFU, MPC and LRU strategies mainly rely on the user’s previous content requests, which consequently leads to the challenge of capturing real-time content prevalence. Specifically, the LFU, MPC and LRU strategies’ responses to content requests are limited by the total count of users’ previous access history, making it difficult to adapt to dynamically changing content prevalence. In contrast, the CDSED strategy is more flexible in meeting new user interests and needs through a real-time content update mechanism by comprehensively considering the real-time nature of user interests and needs. In addition, the MPC strategy is prone to fall into local optimum solutions, and the introduction of the simulated annealing selection algorithm provides the CDSED strategy with a more global search capability, which enables it to make caching decisions more flexibly in the face of complex dynamic environments, thus improving the overall caching success ratio. Therefore, compared with the other three caching strategies, the CDSED strategy achieves a higher cache success ratio.
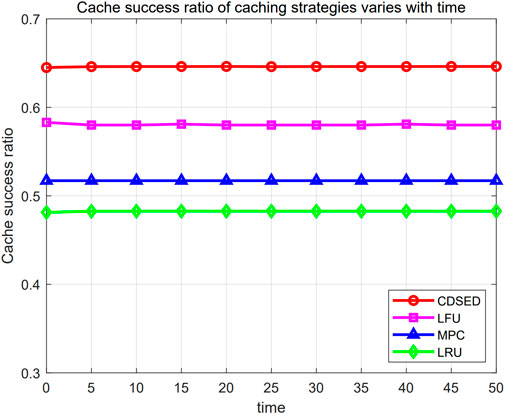
Figure 6. Cache success ratio changes over time.
The simulation compares the variation of cache success ratio in different caching strategies with different cache capacity sizes, as shown in Figure 7. In the figure, the horizontal coordinate represents the cache capacity magnitude of the edge service base station and the vertical coordinate represents the cache success ratio. In addition, the bar chart shows the CDSED strategy, MPC strategy, LFU strategy, and LRU strategy from left to right, respectively. From the figure, it is observable that when cache capacity increases from 1000 to 3000, the cache success ratio of CDSED strategy, MPC strategy, LFU strategy and LRU strategy increased from [0.636, 0.505, 0.562, 0.482] to [0.673, 0.563, 0.602, 0.535]. This is because the larger cache capacity provides more cache resources for the 6G edge caching network, enabling the edge service base station to accommodate more cache content to better satisfy the increasing content requests from users in the edge caching network. Meanwhile, the CDSED strategy can design the caching strategy according to the cache capacity of the serving base station. Therefore, the cache success ratio of CDSED is higher than that of LFU, MPC and LFU with the same cache capacity.
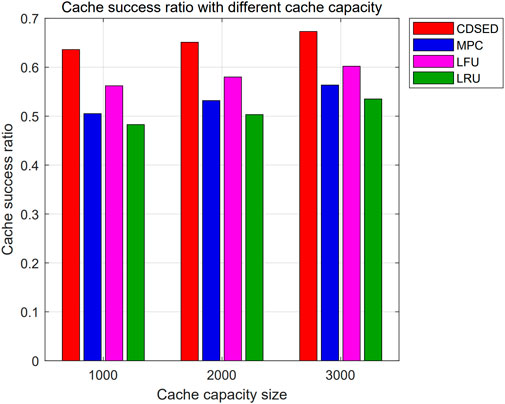
Figure 7. Variation of cache success ratio with cache capacities.
Figure 8 shows the change of cache success ratio in different cache strategies when the cache capacity of the base station is constant and the total count of content is increasing. In the figure, the abscissa represents the total count of content, and the ordinate indicates the cache success ratio. The circles, triangles, rectangles are represented by CDSED strategy, MPC strategy, LRU strategy and LFU strategy respectively. It is clear from the figure that as the total count of content increases, the cache success ratio decreases accordingly. This is because when the cache content is increasing, the types of content requested by the user will also increase, while the cache space of the edge service base station is unchanged. The edge service base station cannot cache all the requested cache content, so it is necessary for the remote cloud server to respond to the user’s content demand, resulting in a decrease in success ratio. In addition, the average cache success ratio of CDSED strategy is 0.629, while the average cache success ratios of MPC strategy, LRU strategy and LFU strategy are 0.491, 0.454 and 0.551, respectively. When the amount of content is 100, the cache success ratios of CDSED, MPC, LRU, and LFU strategies are 0.656, 0.507, 0.483, and 0.575. This is because LRU and LFU strategies mainly make decisions based on historical behavior or simple frequency information, which cannot effectively adapt to the large and diverse cache content set. Although the MPC strategy considers the prevalence of cache content, when the total count of cache content increases, it may not be able to accurately select the content suitable for a specific user group due to only focusing on the global prevalence, which affects the cache success ratio. By simulating the propagation process of content between users, the CDSED strategy can more comprehensively understand the formation and propagation of user interests, and more flexibly and selectively cache content with potential propagation trends, thereby improving the success ratio. Therefore, when the total content number is the same, the CDSED strategy can increase success ratio than LRU, LFU and MPC strategies.
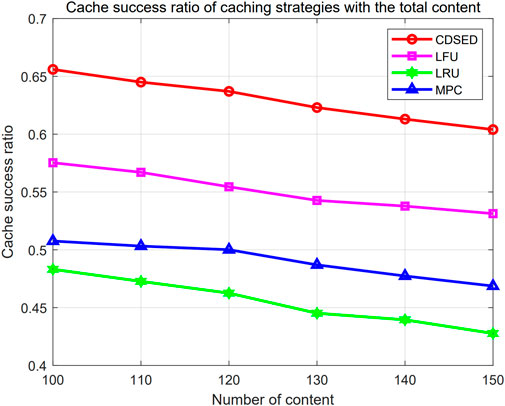
Figure 8. Cache success ratio under different content number.
The simulation compares cache success ratio changes of different caching strategies with different total count of users, as displayed in Figure 9. In the figure, the horizontal axis is the total count of users, and the vertical axis is the cache success ratio. In addition, the graphs with red circles, pink rectangles, blue hexagons and green triangular curves represent CDSED strategy, LFU strategy, MPC strategy and LRU strategy, respectively. From the figure, it is evident that as the total count of users increases, the cache success ratio will increase accordingly. This is because LRU and LFU strategies selectively replace inactive or low-frequency cache content by monitoring user behavior, thereby effectively satisfying user interests. The MPC strategy is based on prevalence information to better retain popular cache content. The CDSED strategy considers the content propagation process, makes full use of the interest propagation relationship between users, and improves the caching effect for popular content. In addition, the average cache success ratios of the CDSED strategy, MPC strategy, LRU strategy, and LFU strategy are 0.632, 0.512, 0.451, and 0.573. When the amount of users is 500, the cache success ratios of the CDSED strategy, MPC strategy, LRU strategy, and LFU strategy are 0.552, 0.474, 0.405, and 0.527 respectively. This is because the increase in the total count of users means that the information propagation path becomes more complex. The CDSED strategy captures the heat evolution of content more accurately by simulating the propagation process of information, and can predict future hot content more accurately according to the influence relationship between users. Therefore, the CDSED strategy can enhance success ratio under the same amount of users.
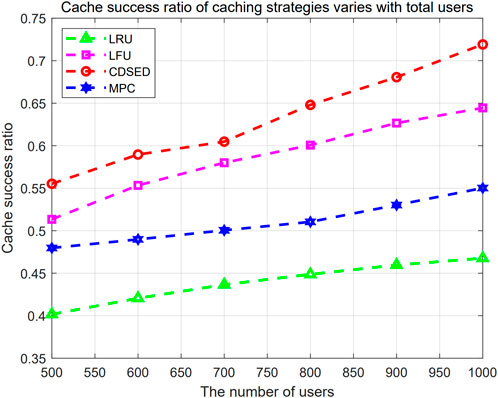
Figure 9. Cache success ratio changes under different amount of users.
This study proposed a cache distribution strategy based on epidemic dynamics for 6G edge network. First, the strategy constructs a 6G ECCM, which investigates the time-varying content prevalence in edge caching networks. The user propagation process of cache content is modeled as an infectious disease propagation process, and the distribution of user interest in cache content is obtained from the content propagation state prediction matrix. In addition, the CDSED strategy includes PGAC algorithm, which introduces a simulated annealing selection algorithm derived from GA to improve the local search capability and maximize the cache success ratio. Simulation results show that the CDSED can significantly increase the cache success ratio compared with LFU, LRU and MPC. In our future work, we will further optimize the propagation dynamics model based on this work, and consider more factors such as user behaviors, social relationships, etc., to improve the accuracy of popularity prediction. We will also research edge caching strategies based on technologies such as 6G space-air-integrated network (6G SAGIN) and integrated sensing and computation (ISAC).
The original contributions presented in the study are included in the article/supplementary material, further inquiries can be directed to the corresponding author.
XW: Methodology, Software, Writing–original draft. YZ: Methodology, Software, Writing–original draft. SZ: Methodology, Writing–original draft.
The author(s) declare that financial support was received for the research, authorship, and/or publication of this article. The work was supported in part by Sub Project of National Key Research and Development plan in 2020. NO. 2020YFC1511704, Beijing Science and Technology Project (Grant No. Z211100004421009), Beijing Information Science and Technology University. NO. 2020KYNH212, NO. 2021CGZH302 and in part by the National Natural Science Younth Foundation of China (Grant No. 62301058).
We are grateful for the contributions to this article made by Frontiers editorial staff members. We also thank the reviewers who provided valuable input for this manuscript.
The authors declare that the research was conducted in the absence of any commercial or financial relationships that could be construed as a potential conflict of interest.
All claims expressed in this article are solely those of the authors and do not necessarily represent those of their affiliated organizations, or those of the publisher, the editors and the reviewers. Any product that may be evaluated in this article, or claim that may be made by its manufacturer, is not guaranteed or endorsed by the publisher.
1. Bagaa M, Dutra DLC, Taleb T, Flinck H Toward enabling network slice mobility to support 6g system. IEEE Trans Wireless Commun (2022). 21:10130–44. doi:10.1109/TWC.2022.3182591
2. Mao B, Liu J, Wu Y, Kato N Security and privacy on 6g network edge: a survey. IEEE Commun Surv Tutorials (2023). 25:1095–127. doi:10.1109/COMST.2023.3244674
3. Chukhno N, Chukhno O, Pizzi S, Molinaro A, Iera A, Araniti G Approaching 6g use case requirements with multicasting. IEEE Commun Mag (2023). 61:144–50. doi:10.1109/MCOM.001.2200659
4. Yang L, Hu H, Li M A distributed caching approach for minimizing average transmission delay in ultra-dense networks. IEEE Trans Vehicular Technol (2023). 72:11041–6. doi:10.1109/TVT.2023.3261896
5. Zhao L, Li H, Lin N, Lin M, Fan C, Shi J Intelligent content caching strategy in autonomous driving toward 6g. IEEE Trans Intell Transportation Syst (2022). 23:9786–96. doi:10.1109/TITS.2021.3114199
6. Lin Z, Fang Y, Chen P, Chen F, Zhang G Modeling and analysis of edge caching for 6g mmwave vehicular networks. IEEE Trans Intell Transportation Syst (2023). 24:7422–34. doi:10.1109/TITS.2022.3147696
7. Yu P, Zhang J, Fang H, Li W, Feng L, Zhou F, et al. Digital twin driven service self-healing with graph neural networks in 6g edge networks. IEEE J Selected Areas Commun (2023). 41:3607–23. doi:10.1109/JSAC.2023.3310063
8. Li D, Zhang H, Li T, Ding H, Yuan D Community detection and attention-weighted federated learning based proactive edge caching for d2d-assisted wireless networks. IEEE Trans Wireless Commun (2023). 22:7287–303. doi:10.1109/TWC.2023.3249756
9. Li H, Sun M, Xia F, Xu X, Bilal M A survey of edge caching: Key issues and challenges. Tsinghua Sci Technol (2024) 29:818–42. doi:10.26599/TST.2023.9010051
10. Ma G, Wang Z, Zhang M, Ye J, Chen M, Zhu W Understanding performance of edge content caching for mobile video streaming. IEEE J Selected Areas Commun (2017). 35:1076–89. doi:10.1109/JSAC.2017.2680958
11. Wang X, Chen M, Taleb T, Ksentini A, Leung VC Cache in the air: exploiting content caching and delivery techniques for 5g systems. IEEE Commun Mag (2014). 52:131–9. doi:10.1109/MCOM.2014.6736753
12. Zhang X, Ren Y, Lv T, Hanzo L Caching scalable videos in the edge of wireless cellular networks. IEEE Netw (2023). 37:34–42. doi:10.1109/MNET.107.2100461
13. Feng H, Guo S, Yang L, Yang Y Collaborative data caching and computation offloading for multi-service mobile edge computing. IEEE Trans Vehicular Technol (2021). 70:9408–22. doi:10.1109/TVT.2021.3099303
14. Wu D, Li J, He P, Cui Y, Wang R Social-aware graph-based collaborative caching in edge-user networks. IEEE Trans Vehicular Technol (2023). 72:7926–41. doi:10.1109/TVT.2023.3241959
15. Sun H, Chen Y, Sha K, Huang S, Wang X, Shi W A proactive on-demand content placement strategy in edge intelligent gateways. IEEE Trans Parallel Distributed Syst (2023). 34:2072–90. doi:10.1109/tpds.2023.3249797
16. Zhu X, Jiang C, Kuang L, Zhao Z Cooperative multilayer edge caching in integrated satellite-terrestrial networks. IEEE Trans Wireless Commun (2022). 21:2924–37. doi:10.1109/TWC.2021.3117026
17. Wang R, Kan Z, Cui Y, Wu D, Zhen Y Cooperative caching strategy with content request prediction in internet of vehicles. IEEE Internet Things J (2021). 8:8964–75. doi:10.1109/JIOT.2021.3056084
18. Ayenew TM, Xenakis D, Alonso L, Passas N, Merakos L Demand-aware cooperative content caching in 5g/6g networks with mec-enabled edges. IEEE Networking Lett (2022). 4:118–22. doi:10.1109/LNET.2022.3192173
19. Tang J, Tang H, Zhang X, Cumanan K, Chen G, Wong K-K, et al. Energy minimization in d2d-assisted cache-enabled internet of things: a deep reinforcement learning approach. IEEE Trans Ind Inform (2020). 16:5412–23. doi:10.1109/TII.2019.2954127
20. Zhu J, Li R, Ding G, Wang C, Wu J, Zhao Z, et al. Aoi-based temporal attention graph neural network for popularity prediction and content caching. IEEE Trans Cogn Commun Networking (2022). 9:345–58. doi:10.1109/TCCN.2022.3227920
21. Liu X, Derakhshani M, Lambotharan S Contextual learning for content caching with unknown time-varying popularity profiles via incremental clustering. IEEE Trans Commun 69 (2021):3011–24. doi:10.1109/tcomm.2021.3059305
22. Zhang W, Wu D, Yang W, Cai Y Caching on the move: a user interest-driven caching strategy for d2d content sharing. IEEE Trans Vehicular Technol (2019). 68:2958–71. doi:10.1109/TVT.2019.2895682
23. Li Z, Gao X, Li Q, Guo J, Yang B Edge caching enhancement for industrial internet: a recommendation-aided approach. IEEE Internet Things J (2022). 9:16941–52. doi:10.1109/JIOT.2022.3143506
24. Li C, Chen W Content pushing over idle timeslots: performance analysis and caching gains. IEEE Trans Wireless Commun (2021). 20:5586–98. doi:10.1109/TWC.2021.3068528
25. Zhang X, Qi Z, Min G, Miao W, Fan Q, Ma Z Cooperative edge caching based on temporal convolutional networks. IEEE Trans Parallel Distributed Syst (2022). 33:2093–105. doi:10.1109/TPDS.2021.3135257
26. Mehrizi S, Chatterjee S, Chatzinotas S, Ottersten B Online spatiotemporal popularity learning via variational bayes for cooperative caching. IEEE Trans Commun (2020). 68:7068–82. doi:10.1109/TCOMM.2020.3015478
27. Nguyen T-V, Dao N-N, Noh W, Cho S, et al. User-aware and flexible proactive caching using lstm and ensemble learning in iot-mec networks. IEEE Internet Things J (2022). 9:3251–69. doi:10.1109/JIOT.2021.3097768
28. Tao Y, Jiang Y, Zheng F-C, Wang Z, Zhu P, Tao M, et al. Content popularity prediction based on quantized federated bayesian learning in fog radio access networks. IEEE Trans Commun (2023). 71:893–907. doi:10.1109/TCOMM.2022.3229679
29. Li D, Zhang H, Yuan D, Zhang M Learning-based hierarchical edge caching for cloud-aided heterogeneous networks. IEEE Trans Wireless Commun (2023) 22:1648–63. doi:10.1109/TWC.2022.3206236
30. Jiang Y, Feng H, Zheng F-C, Niyato D, You X Deep learning-based edge caching in fog radio access networks. IEEE Trans Wireless Commun (2020). 19:8442–54. doi:10.1109/TWC.2020.3022907
31. Gao J, Zhang S, Zhao L, Shen X The design of dynamic probabilistic caching with time-varying content popularity. IEEE Trans Mobile Comput (2021). 20:1672–84. doi:10.1109/TMC.2020.2967038
32. Fan Q, Li X, Li J, He Q, Wang K, Wen J Pa-cache: evolving learning-based popularity-aware content caching in edge networks. IEEE Trans Netw Serv Manage (2021). 18:1746–57. doi:10.1109/tnsm.2021.3053645
33. Wang K, Deng N A privacy-protected popularity prediction scheme for content caching based on federated learning. IEEE Trans Vehicular Technol (2022). 71:10191–6. doi:10.1109/TVT.2022.3179413
34. Wang J, Cai S, Wang W, Zhou T Link cooperation effect of cooperative epidemics on complex networks. Appl Maths Comput (2023). 437:127537. doi:10.1016/j.amc.2022.127537
35. Zhang H, Cao L, Fu C, Cai S, Gao Y Epidemic spreading on multi-layer networks with active nodes. Chaos: Interdiscip J Nonlinear Sci (2023). 33:073128. doi:10.1063/5.0151777
36. Zhao J, He L, Zhang D, Gao X A tp-ddpg algorithm based on cache assistance for task offloading in urban rail transit. IEEE Trans Vehicular Technol (2023). 72:10671–81. doi:10.1109/TVT.2023.3253508
37. Lin P, Song Q, Jamalipour A Multidimensional cooperative caching in comp-integrated ultra-dense cellular networks. IEEE Trans Wireless Commun (2020). 19:1977–89. doi:10.1109/TWC.2019.2960329
38. Wang Y, Friderikos V Energy-efficient proactive caching with multipath routing. Comput Netw (2022). 216:109272. doi:10.1016/j.comnet.2022.109272
39. Feng H, Deng Y, Zhou Y, Min G Towards heat-recirculation-aware virtual machine placement in data centers. IEEE Trans Netw Serv Manage (2022). 19:256–70. doi:10.1109/TNSM.2021.3120295
40. Zhang L, Jin A, He Q, Chen M Two delayed seirs epidemic model in networks. In: 2012 International Symposium on Instrumentation and Measurement, Sensor Network and Automation (IMSNA); 25-28 August 2012; Sanya, China, 29 (2012). p. 592–5doi. doi:10.3760/cma.j.issn.1003-9406.2012.05.020
41. Jin W Research on material allocation method based on seir and multi-objective programming. In: 2023 IEEE International Conference on Image Processing and Computer Applications (ICIPCA); 11-13 August 2023; Changchun, China (2023). p. 1006–10. doi:10.1109/icipca59209.2023.10257749
Keywords: 6G edge caching, epidemic dynamics, content caching, content prevalence, genetic simulated annealing algorithm
Citation: Wang X, Zhang Y and Zhang S (2024) Epidemic dynamics edge caching strategy for 6G networks. Front. Phys. 12:1410472. doi: 10.3389/fphy.2024.1410472
Received: 01 April 2024; Accepted: 29 May 2024;
Published: 19 June 2024.
Edited by:
Xuzhen Zhu, Beijing University of Posts and Telecommunications (BUPT), ChinaReviewed by:
Xin Liu, Google, United StatesCopyright © 2024 Wang, Zhang and Zhang. This is an open-access article distributed under the terms of the Creative Commons Attribution License (CC BY). The use, distribution or reproduction in other forums is permitted, provided the original author(s) and the copyright owner(s) are credited and that the original publication in this journal is cited, in accordance with accepted academic practice. No use, distribution or reproduction is permitted which does not comply with these terms.
*Correspondence: Yuexia Zhang, emhhbmd5dWV4aWFAYmlzdHUuZWR1LmNu
Disclaimer: All claims expressed in this article are solely those of the authors and do not necessarily represent those of their affiliated organizations, or those of the publisher, the editors and the reviewers. Any product that may be evaluated in this article or claim that may be made by its manufacturer is not guaranteed or endorsed by the publisher.
Research integrity at Frontiers
Learn more about the work of our research integrity team to safeguard the quality of each article we publish.