 Pavel Dvořák
 Martina Mrkvičková
 Jan Kratzer
95% of researchers rate our articles as excellent or good
Learn more about the work of our research integrity team to safeguard the quality of each article we publish.
Find out more
BRIEF RESEARCH REPORT article
Front. Phys. , 10 July 2024
Sec. Low-Temperature Plasma Physics
Volume 12 - 2024 | https://doi.org/10.3389/fphy.2024.1408078
This article is part of the Research Topic Plasma and Related Sciences: Experimental and Theoretical Approaches View all 10 articles
The problems of laser-induced fluorescence (LIF) measurements in a partially saturated regime with spatially dependent laser intensity in the sample (caused by absorption) are analyzed. The obtained equations are tested by means of LIF of free tellurium atoms in a plasma of an atmospheric pressure dielectric barrier discharge (DBD) by comparing fluorescence and absorption measurements. The results show a high reliability of LIF measurements.
Fluorescence, frequently realized as laser-induced fluorescence (LIF), is one of the most important methods for detection of various species in numerous scientific fields [1-3]. It offers in situ measurements with high sensitivity (going to single-molecule detection [4]), versatility, and spatial resolution. Due to these advantages, it is a key method for detection of reactive species in plasmas [5-9], including free atoms, molecular radicals, complete molecules, and ions.
Unfortunately, the phenomena occurring during the fluorescence process can be relatively complicated due to collisions of the excited state [10], laser induced photodissociation [11, 12], invasivity of the method [13, 14], or necessity of calibration of the detection system [5-7]. As a result, the absolute concentrations obtained by LIF sometimes exhibit high uncertainty [15]. Therefore, any validation of the results of the LIF method is valuable. Moreover, the fluorescence process can be complicated by partial saturation, i.e., by deviation of the fluorescence signal from its linear dependence on the energy of laser pulses, which is caused by evident depletion of the investigated ground state, stimulated emission, and eventually by photoionization of the excited state. Therefore, LIF saturation was studied by several works [16-18]. Another complication is that the laser beam may be fully or partially absorbed in the studied sample, which leads to spatially variable energy of laser pulses. In addition, the absorption can be partially saturated from the same reasons which cause the saturation of the fluorescence.
The abovementioned complications were the motivation to derive equations that can be used for evaluation of LIF and that take into account the absorption of the laser beam in the sample (in this case in plasma) and the saturation of both LIF and absorption. This study also aimed to validate the concentration values gained from LIF measurements by absorption. These intentions were realized in atmospheric pressure plasma of a dielectric barrier discharge (DBD) ignited in a so-called atomizer, i.e., in a device that is used for dissociation (atomization) of volatile species in the field of trace element analysis to determine metal concentrations by atomic spectrometry. Particularly, the presented measurement was realized on LIF of free tellurium atoms that were supplied to the plasma in the form of tellurium hydride (TeH2), which was atomized in the plasma to produce the free Te atoms.
A volume DBD was ignited inside a DBD atomizer consisting of two parts—an optical and an inlet arm. The DBD was ignited in the optical arm—a 75-mm-long silica vessel with 7 mm × 3 mm internal rectangular cross-section. Two planar copper electrodes (50 mm long, 5 mm wide) were placed on the outer surfaces of the upper and lower bases of the vessel and supplied with a sinusoidal voltage of 26 kHz frequency and 9 kV amplitude. An inlet arm—a silica tube with internal diameter 2 mm—was sealed to the centre of the optical arm and served as the inlet for the working gas mixture from the hydride generator unit. This compartment served for almost quantitative (93% ± 5%) conversion of the Te standard solution (50 ng/mL Te) by chemical reaction, reduction by NaBH4 to TeH2. Ar (75 sccm) served as the carrier gas, while 50 sccm H2 is produced as a by-product of the chemical reaction. After passing through the atomizer, the gases escaped freely through its open ends into the surrounding atmosphere.
The scheme of the whole laser-induced fluorescence setup is shown in Figure 1. Figure 1C shows the energy scheme for the detection of the tellurium atoms. The ground state 5p43P2 atoms were excited to the 5p3 6s 5S2 state by absorbing laser photons of wavelength 225.903 nm. The resulting fluorescence photons of wavelength 253.074 nm were emitted while the atoms were depopulated to the 5p43P1 state. The excitation laser beam was generated by a system consisting of a Q-switched pump laser (Spectra-Physics, Quanta-Ray PRO-270-30), a dye laser (Sirah, PrecisionScan PRSC-D-24-EG with Rhodamine 101/B), and a frequency conversion unit. The output beam with a wavelength of 225.903 nm, spectral width of 0.4 pm, single-pulse duration of 8 ns, and repetition frequency of 30 Hz was divided into two branches by a silica window acting as a beam splitter, which decreased the energy of the laser beam entering the DBD in order to reduce the strong fluorescence saturation. The laser beam was circular with a diameter of approx. 3 mm. Before entering the DBD, a part of its spatial wings was cut by a rectangular (5 × 2 mm) diaphragm so that it could pass through the center of the optical arm of the atomizer without touching the silica walls. The beam was localized at the axis of the optical arm. The energy of both beams was monitored by pyroelectric power meters (Ophir, Vega PE9), providing the information on the laser energy before entering the discharge and after the absorption on tellurium atoms (the ratio between the energy measured by the first power meter and the real energy at the DBD input was obtained from measurements realized when there was no plasma and no absorption in the atomizer). The fluorescence signal was detected perpendicular to the laser beam by using an ICCD camera (Princeton Instruments, PI-MAX). The spatial resolution of the measurements was 0.08 mm. An interference filter (AHF 257/12 BrightLine HC) was mounted on the camera lens to separate the fluorescence signal from the ambient radiation. The signal was temporally integrated over 100 ns, covering the entire laser pulse and the fluorescence decay (only for measurements of the fluorescence decay rate, discussed in Section 4, the signal was integrated only over 0.64 ns, and the delay between the laser pulse and the signal detection was gradually increased by a step 0.5 ns). In order to increase the signal-to-noise ratio, the fluorescence image was accumulated on the ICCD camera chip from typically 300 of laser shots.
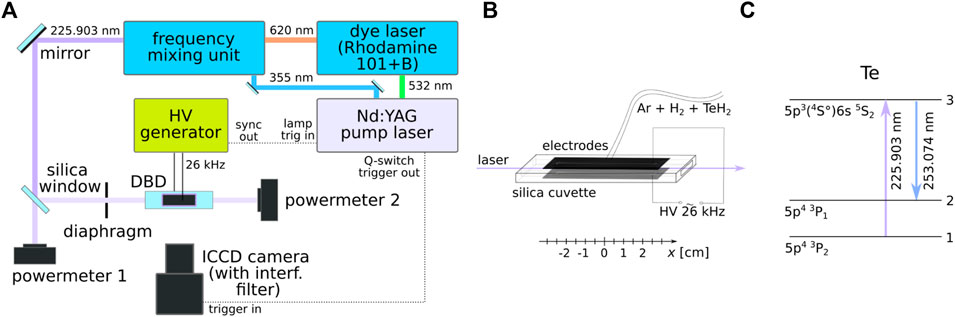
Figure 1. Experimental setup. (A) the whole laser-induced fluorescence setup; (B) the DBD cell; (C) the energy scheme for the detection of the tellurium atoms.
For calculating the LIF signal, we will use the simple three-level model, where atoms or molecules are excited by a laser photon from their ground state (denoted as the level 1) to a higher excited state (level 3). The excitation is followed by a spontaneous radiative decay to a lower excited state (level 2), which is accompanied by emission of a fluorescence photon–this fluorescence radiation is detected, and its intensity is used for determination of the concentration of studied atoms or molecules. Alternatively, the excited atom in the third level can undergo radiative transition to another lower lying state, or its excitation can be non-radiatively quenched by a number of collisional processes. The rate of the desired fluorescence transition to level 2 is described by the Einstein coefficient of spontaneous emission (A32), whereas the total depopulation rate of level 3 can be described by the reciprocal value of the lifetime of the excited level 3 (1/τ). The product A32 τ gives the quantum efficiency of the fluorescence.
In the standard LIF measurement in the linear regime, where the fluorescence signal is directly proportional to the energy of laser pulses, the measured fluorescence signal can be calculated according to [10].
where n is the concentration of studied atoms, Ef is the mean energy of laser pulses, B13 is the Einstein coefficient for excitation from the ground level to the excited level 3, and κ describes the overlap between the spectral profiles of the laser line and the absorption line [19] (for the narrow laser line, κ is simply equal to the ratio between the maximum and integral intensities of the absorption line. Mf in Eq. 1 is the fluorescence signal integrated temporally over the whole fluorescence duration and spectrally over the whole fluorescence transition; it is not spectrally integrated over the excitation line—if it was spectrally integrated also over the excitation line, the factor κ should be left out from the equation). c is the speed of light, and af is the number of accumulations used during the collection of the fluorescence signal. Df is the detector sensitivity for the fluorescence wavelength—this constant includes the quantum efficiency of the ICCD camera (ηf) and the transmission of the used interference filter (T). Ω is the solid angle for detection of fluorescence photons covered by the detector. Finally, s describes the spatial distribution of laser beam energy normalized to 1 (i.e., the surface integral of s over the plane perpendicular to the beam axis is equal to 1). In practice, it is problematic to predict the value of the integral
where dσr/dΩ is the differential cross-section for Rayleigh scattering on the gas used for calibration; pr and Tr are the pressure and temperature of the calibration gas, respectively (the gas concentration is equal to nr = pr/kTr); and k is the Boltzmann constant. Er is the mean energy of laser pulses used for Rayleigh scattering, νr is the frequency of laser light, and h is the Planck constant. Dr is the detector sensitivity for Rayleigh wavelength, and this quantity is proportional to the ICCD quantum efficiency ηr. The combination of Eqs 1, 2 enables to calculate the concentration of studied atoms by
When the partially saturated LIF regime is used, the ratio Mf/Ef in Eq. 3 must be replaced by the term
This equation must be supplemented by another equation that describes the spatial variation of the laser pulse energy along the direction of the laser beam propagation (x). With no saturation, the variation would be described by
where n1 and n3 are the concentrations of the ground and directly excited states, respectively; B31 is the Einstein coefficient for stimulated emission; and I is the laser intensity. The first term describes excitation, and the second term is the creation of new laser photons by stimulated emission (when laser intensity is small, i.e., in the linear regime, n3 ≪ n1 and n1 ≈ const., which simplifies the integral to
The term
In our study, we applied the equations obtained in Section 3 on the LIF of free Te atoms generated by a DBD. First, let us assess the non-linearity or saturation of the LIF process. Saturation can be revealed when a straight line is fitted to the dependence lnMf on lnEf because the slope of the fitted line is equal to 1 for linear LIF and smaller than 1 for saturated LIF, whereas slope higher than 1 indicates some photodissociation ignited by the laser [12]. In our measurement, the slope had the value
derived in [17] for Gaussian beams, where β is the above mentioned saturation constant and αEf gives the hypothetical signal that would be measured if no saturation occurred. Both the data and the fit (with
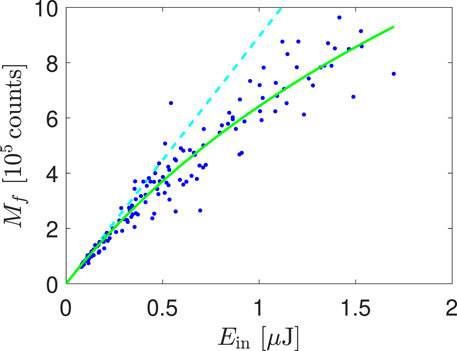
Figure 2. Saturation of the LIF process. The green line shows the fitted curve (Eq. 7), and the cyan broken line shows the hypothetical non-saturated dependence.
Not only fluorescence but also absorption can be affected by saturation processes. Therefore, Eq. 6 should be used instead of the traditional equation
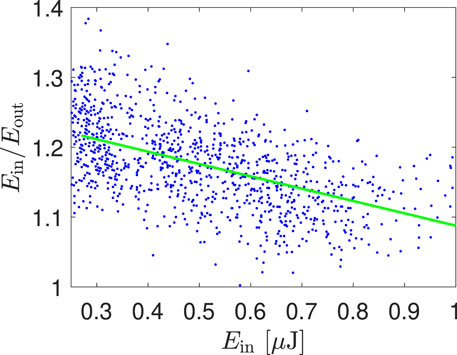
Figure 3. Ratio of the laser pulse energy behind (Eout) and in front of (Ein) the DBD as a function of the energy Ein. The green line is the linear fit of measured points characterized by the slope
In order to characterize the fluorescence process, it is necessary to measure the fluorescence decay time (i.e., the lifetime of the excited state) and the spectral profile of the excitation line. The decay time was measured by variation of the delay between the laser pulse and the interval when the ICCD camera collects the fluorescence radiation. In our case, the decay time was significantly shorter than the laser pulse duration, and a weak tail of the laser pulse disturbed the decay process. Consequently, it would not be correct to fit a single exponential through the measured data, and the fluorescence decay was fitted by the convolution
Finally, we can proceed to the calculation of the concentration of free Te atoms realized by Eqs 4, 6. At the beginning of the solution, Eq. 4 is used for the calculation of the Te concentration in one of the discharge edges. When the concentration is known, Eq. 6 is used for the calculation of laser pulse energy in the neighboring point and the alternating use of both these equations continues until the Te concentration and the laser pulse energy are known along the whole beam path in the plasma. The obtained concentration profile for the measurement, where TeH2 was generated from a solution with Te concentration 50 μg/L, is shown by the black curve in Figure 4 (it should be noted that the wavy structures in the right half of the DBD reactor were caused by an uneven surface of the front silica wall of the atomizer, which deflected part of the fluorescence radiation). The consequences of the concentration profile for the understanding of the TeH2 atomization are described elsewhere [22]; here, we will only summarize that the presence of free Te atoms in the whole discharge region and the high Te concentration demonstrate a good performance of the DBD in atomization of the hydride. The mean concentration in the left part (not affected by the uneven surface) of the atomizer 3.5 ⋅ 1018 m−3 is in good agreement with the expected value between 3.45 ⋅ 1018 m−3 and 3.83 ⋅ 1018 m−3 (calculated from the TeH2 supply rate from the hydride generator to the DBD assuming full hydride atomization), indicating reliability of the used measurement and evaluation procedure.
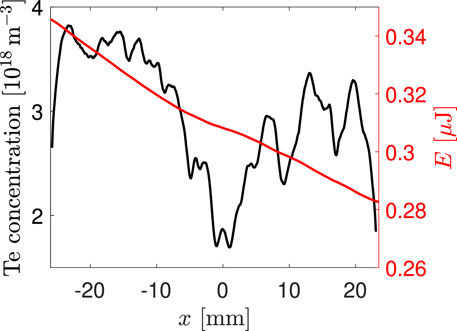
Figure 4. Spatial distributions of Te concentration (black, left axis) and laser pulse energy (red, right axes) in the DBD.
There are several sources of uncertainty of the concentration values: the first is the variability of the measured intensities, which was, in our case, approximately 8%. The second was the uncertainty of LIF parameters, namely, of τ, κ, and β. In our case, the uncertainty of κ and β was only few percent, but the uncertainty of the decay time τ was approximately 10%. All the above listed sources together led in our measurements to an uncertainty below 20%. The third source can be the uncertainty of the Einstein coefficients A32 and B13. Our values were taken from [23]. Unfortunately, we did not find the uncertainty of the used Einstein coefficient in the cited work and in the references therein.
At last, when solving the pair of Eqs 4, 6, one of the results is the spatial development of laser pulse energy. One example of this curve is shown in Figure 4 by the red curve. From such a curve, it is possible to obtain the ratio of the energy of laser pulses at the input and at the output of the DBD reactor, which can be simply compared with the measured value of this ratio. In other words, our experiment enabled comparing the results of fluorescence and absorption measurements. In our experiment, the ratio of laser pulse energies predicted from the intensity of the fluorescence signal by means of Eqs 4, 6 had the value 1.34, whereas the directly measured value was 1.25. The results of the fluorescence and absorption measurements differed only by 7%, which could be attributed to losses caused by the reflection of the fluorescence radiation on the front atomizer wall, which shows a very good agreement.
The equations for the evaluation of Rayleigh-calibrated LIF measurements in a partially saturated regime when a detectable part of laser photons is absorbed in the sample, in other words of partially saturated fluorescence measurement with spatially dependent intensity of the excitation radiation, were summarized. LIF measurement evaluated by these equations was tested on free tellurium atoms present in an atmospheric pressure DBD. The results were in a good agreement with both the expected Te concentration and with the measured absorption of laser in the DBD, demonstrating a high reliability of absolute LIF measurements.
The original contributions presented in the study are included in the article/Supplementary material, further inquiries can be directed to the corresponding author.
PD: writing–review and editing and writing–original draft. MM: writing–review and editing and writing–original draft. JK: writing–review and editing and writing–original draft.
The author(s) declare that financial support was received for the research, authorship, and/or publication of this article. This research has been supported by the Czech Science Foundation (Contract 23-05974K), Institute of Analytical Chemistry of the Czech Academy of Sciences (RVO: 68081715), and by the Project LM2023039 funded by the Ministry of Education, Youth and Sports of the Czech Republic.
The authors declare that the research was conducted in the absence of any commercial or financial relationships that could be construed as a potential conflict of interest.
All claims expressed in this article are solely those of the authors and do not necessarily represent those of their affiliated organizations, or those of the publisher, the editors, and the reviewers. Any product that may be evaluated in this article, or claim that may be made by its manufacturer, is not guaranteed or endorsed by the publisher.
2. Birch DJS, Chen Y, Rolinski OJ. Photonics: biomedical photonics, spectroscopy, and microscopy. John Wiley and Sons (2015). p. 1–58. chap. fluorescence.
3. Stchur P, Yang KX, Hou X, Sun T, G MR. Laser excited atomic fluorescence spectrometry — a review. Spectrochimica Acta B (2001) 56:1565–92. doi:10.1016/s0584-8547(01)00265-8
4. Shashkova S, Leak MC. Single-molecule fluorescence microscopy review: shedding new light on old problems. Biosci Rep (2017) 37:BSR20170031. doi:10.1042/bsr20170031
5. Amorim J, Baravian G, Jolly J. Laser-induced resonance fluorescence as a diagnostic technique in non-thermal equilibrium plasmas. J Phys D: Appl Phys (2000) 33:R51–65. doi:10.1088/0022-3727/33/9/201
6. Niemi K, von der Gathen VS, Döbele H. Absolute calibration of atomic density measurements by laser-induced fluorescence spectroscopy with two-photon excitation. J Phys D: Appl Phys (2001) 34:2330–5. doi:10.1088/0022-3727/34/15/312
7. Döbele HF, Mosbach T, Niemi K, Schulz-von der Gathen V. Laser-induced fluorescence measurements of absolute atomic densities: concepts and limitations. Plasma Sourc Sci. Technol. (2005) 14:S31–41. doi:10.1088/0963-0252/14/2/s05
8. Freegarde TGM, Hancock G. 23RD international conference on phenomena in ionized J Phys IV France (1997) 7:C4. doi:10.1051/jp4:1997403
9. Dilecce G, Martini L, Tosi S, Scotoni M, De Benedictis S. Laser induced fluorescence in atmospheric pressure discharges. Plasma Sourc Sci. Technol. (2015) 18:034007. doi:10.1088/0963-0252/24/3/034007
10. Voráč J, Dvořák P, Mrkvičková M. Laser induced fluorescence of hydroxyl (OH) radical in cold atmospheric discharges. In: N. Britun, and A. Nikiforov, editors Photon counting. Rijeka, Croatia. IntechOpen (2017).
11. Kulatilaka WD, Frank JH, Patterson BD, Settersten TB. Analysis of 205-nm photolytic production of atomic hydrogen in methane flames. Appl Phys B (2009) 97:227–42. doi:10.1007/s00340-009-3474-3
12. Dvořák P, Procházka V, Krumpolec R, Zemánek M. Solution to the perturbation of LIF measurements via photodissociation, OH measurement in atmospheric-pressure multihollow DBD. Plasma Process Polym (2020) 17:202000020. doi:10.1002/ppap.202000020
13. Ambrico PF, Ambrico M, Šimek M, Colaianni A, Dilecce G, De Benedictis S. Laser triggered single streamer in a pin-to-pin coplanar dielectric barrier discharge. Appl Phys Lett (2009) 94:231501. doi:10.1063/1.3152284
14. Mrkvičková M, Ráheľ J, Dvořák P, Trunec D, Morávek T. Fluorescence (TALIF) measurement of atomic hydrogen concentration in a coplanar surface dielectric barrier discharge. Plasma Sourc Sci. Technol. (2016) 25:055015. doi:10.1088/0963-0252/25/5/055015
15. Verreycken T, Mensink R, van der Horst R, Sadeghi N, Bruggeman PJ. Absolute OH density measurements in the effluent of a cold atmospheric-pressure Ar–H2O RF plasma jet in air. Plasma Sourc Sci. Technol. (2013) 22:055014. doi:10.1088/0963-0252/22/5/055014
16. Daily JW. Laser induced fluorescence spectroscopy in flames. Prog Energ Combust. Sci. (1997) 23:133–99. doi:10.1016/s0360-1285(97)00008-7
17. Mrkvičková M, Dvořák P, Svoboda M, Kratzer J, Voráč J, Dědina J. Dealing with saturation of the laser-induced fluorescence signal: an application to lead atoms. Combustion and Flame (2022) 241:112100. doi:10.1016/j.combustflame.2022.112100
18. Voráč J, Dvořák P, Procházka V, Morávek T, Ráhel J. Dependence of laser-induced fluorescence on exciting-laser power: partial saturation and laser – plasma interaction. Eur Phys J Appl Phys (2015) 71:20812. doi:10.1051/epjap/2015150022
19. Voráč J, Dvořák P, Procházka V, Ehlbeck J, Reuter S. Measurement of hydroxyl radical (OH) concentration in an argon RF plasma jet by laser-induced fluorescence. Plasma Sourc Sci. Technol. (2013) 22:025016. doi:10.1088/0963-0252/22/2/025016
20. Dvořák P, Talába M, Obrusník A, Kratzer J, Dědina J. Concentration of atomic hydrogen in a dielectric barrier discharge measured by two-photon absorption fluorescence. Plasma Sourc Sci. Technol. (2017) 26:085002. doi:10.1088/1361-6595/aa76f7
21. Konjević N. Plasma broadening and shifting of non-hydrogenic spectral lines: present status and applications Phys Rep (1999) 316:339. doi:10.1016/S0370-1573(98)00132-X
22. Bufková K, Musil S, Kratzer J, Dvořák P, Mrkvičková M, Voráč J, et al. Generation of tellurium hydride and its atomization in a dielectric barrier discharge for atomic absorption spectrometry. Spectrochimica Acta Part B (2020) 171:105947. doi:10.1016/j.sab.2020.105947
23. Kramida A, Ralchenko Y, Reader JNIST ASD Team. NIST atomic spectra database (ver. 5.11). Gaithersburg, MD: National Institute of Standards and Technology (2023). Available from: https://physics.nist.gov/asd (Accessed May 22, 2024).
Keywords: fluorescence, laser-induced fluorescence, absorption, dielectric barrier discharge, plasma
Citation: Dvořák P, Mrkvičková M and Kratzer J (2024) LIF measurement in a partially saturated and partially absorbed regime. Front. Phys. 12:1408078. doi: 10.3389/fphy.2024.1408078
Received: 27 March 2024; Accepted: 03 June 2024;
Published: 10 July 2024.
Edited by:
Paolo Francesco Ambrico, Istituto per la Scienza e Tecnologia dei Plasmi—CNR, ItalyReviewed by:
Luca Matteo Martini, University of Trento, ItalyCopyright © 2024 Dvořák, Mrkvičková and Kratzer. This is an open-access article distributed under the terms of the Creative Commons Attribution License (CC BY). The use, distribution or reproduction in other forums is permitted, provided the original author(s) and the copyright owner(s) are credited and that the original publication in this journal is cited, in accordance with accepted academic practice. No use, distribution or reproduction is permitted which does not comply with these terms.
*Correspondence: Pavel Dvořák, cGR2b3Jha0BwaHlzaWNzLm11bmkuY3o=
Disclaimer: All claims expressed in this article are solely those of the authors and do not necessarily represent those of their affiliated organizations, or those of the publisher, the editors and the reviewers. Any product that may be evaluated in this article or claim that may be made by its manufacturer is not guaranteed or endorsed by the publisher.
Research integrity at Frontiers
Learn more about the work of our research integrity team to safeguard the quality of each article we publish.