
95% of researchers rate our articles as excellent or good
Learn more about the work of our research integrity team to safeguard the quality of each article we publish.
Find out more
ORIGINAL RESEARCH article
Front. Phys. , 23 July 2024
Sec. Interdisciplinary Physics
Volume 12 - 2024 | https://doi.org/10.3389/fphy.2024.1407517
 Eugene S. Statnik1*
 Semen D. Ignatyev1
 Alexey I. Salimon1Andrey A. Stepashkin1Alexander M. Korsunsky1,2
In this study, composites obtained through low-temperature carbonization of elastomeric matrix highly filled with graphite, carbon black and short carbon fibers were studied for the purpose of determining residual stresses at different scales using a combination of several complementary methods. The state-of-the-art techniques included X-ray stress analysis using the
1. First results of residual stress determination in a C-C composite are reported.
2. A hierarchical model of residual stress distributions for the C-C composite is proposed.
3. A low level of macroscopic residual stresses was revealed by strain gauge and DLSPI methods.
4. Residual stresses of 150 MPa were detected by FIB-DIC and XRD methods at the microscale level.
Vanadium redox flow batteries (VRFBs) have emerged as a promising solution for large-scale energy storage due to their scalability, long cycle life, and decoupled energy and power capacity [1–7]. A critical component of the VRFB system is the bipolar plate, which facilitates electron transport and separates individual cells in a stack. The ideal bipolar plate material should combine appropriate electrical conductivity as well as mechanical durability, chemical resistance, and cost-effectiveness [8–10]. The harsh service conditions of bipolar plates, such as temperature gradients, cycles of oxidation and reduction, volume changes, and chemical attack, impose strict requirements for service life and crack tolerance to ensure prolonged and reliable function. In various materials and systems, tensile residual stresses tend to promote the initiation and growth of cracks. Therefore, it is essential to conduct through studies into the experimental estimations of residual stresses. Additionally, it is necessary to identify methods suitable for adjusting technological processes to reduce harmful residual stresses.
Moreover, bipolar plates also play a crucial role in reducing the overall cost of VRFBs. The cost of bipolar plates can account for up to 30% of the total cost of the battery. Therefore, developing low-cost, high-performance bipolar plates is crucial for making VRFBs more economically viable for large-scale energy storage applications.
Graphite is one of the most widely-used materials for bipolar plates in VRFBs due to its excellent electrical conductivity and chemical stability [11]. However, there are several limitations associated with the use of this material. For instance, pure graphite is characterized by brittleness, low strength and high cost which makes the use, manufacturing, handling, and assembling graphite bipolar plates challenging [12].
On the other hand, certain metals such as titanium have been studied as potential material for bipolar plates due to their exceptional electrical conductivity and mechanical durability [13]. Nevertheless, metals are susceptible to corrosion within VRFB’s environment and therefore require protective coatings or treatments to enhance their chemical resistance [14].
In order to overcome the drawbacks listed above, the technology has been proposed recently that is based on low temperature carbonization of elastomers filled with various carbon-based fillers such as graphite, carbon black and chopped carbon fibers [15, 16]. This combination may allow achieving a balance between electrical conductivity and mechanical strength. Moreover, these composites may be customized according to specific requirements by adjusting the type and amount of the filler and elastomer matrix as well as technological process parameters such as temperature and pressure during vulcanization and carbonization, respectively [17, 18].
From the technological point of view, it is feasible to obtain almost any shape of the final product with micron resolution at the vulcanization stage by using template with desired bipolar plate channels pattern. The proposed manufacturing process is significantly cheaper than the graphite alternative since it does not require a post-processing stage, such as machining (e.g., channels milling), which causes problems due to material brittleness [19].
However, this approach also has several limitations, namely:
a) Incomplete carbonization. At lower temperatures, the carbonization process may not be complete. This can lead to a composite containing a mixture of carbonized and uncarbonized regions (so-called “carbonization gradient”), potentially impacting the mechanical, thermal, and electrical properties of the composite [20].
b) Lower electrical conductivity. The electrical conductivity of the carbonized composite may not be as high as that achieved through higher temperature carbonization processes [21].
c) Residual volatile compounds. Low-temperature carbonization can result in the retention of more volatile compounds within the carbonized material, which can affect material purity and performance [22].
d) Porosity and surface area. The porosity and surface area characteristics of the low-temperature carbonized composites might not be optimal for certain applications, especially those requiring high surface areas [22].
e) Decreased dimensional stability. Low-temperature carbonization can result in significant shrinkage of the composite, which can affect the dimensional stability of the final product [23].
It has been established in our previous studies [15–18] that the carbonization process leads to the evolution of gases and volatile matter. The differential expansion and contraction of the matrix and fillers can result in thermal stresses and could initiate cracks. In addition, elastomers and their fillers might undergo different degrees of shrinkage. This mismatch can lead to internal residual stresses promoting crack initiation and propagation.
In this paper, we present a comprehensive investigation of the residual stress within carbonized samples that includes measurements in moldable low-temperature carbonized elastomer-based composites filled with carbon black, graphite and chopped carbon fibers. We applied numerous experimental methods such as X-ray stress analysis using the
The studied elastomer-based composite filled with carbon-based materials was produced from polymer matrix based on BNKS-18 AMN TU 38.30313-2006 nitrile butadiene rubber (NBR) (JSC Krasnoyarsk Synthetic Rubber Plant, Krasnoyarsk, Russia) with a 17-20 wt.% of the acrylonitrile and 0.4 wt.% of the ash content and discrete carbon-based fillers such as chopped fibers (CF, with an average fiber length of 2 cm and diameter of 6–7 µm) FibARm Fiber C (HC Composite, Moscow, Russia), fine granular graphite (FGG, with an average particle size of 40 µm) GMZ (LC Moscow Electrode Plant, Moscow, Russia), and dispersed carbon black (DCB, with an average particle size of 25–30 nm that agglomerates into 1–2 µm) CB N-399 (LC Moscow Electrode Plant, Moscow, Russia). The composite was comprised of 225 mass parts of FGG, 50 mass parts of DCB and 25 mass parts per 100 mass parts of NBR.
The detailed manufacturing process for composites was previously described in our studies [15–18]. It involves mixing components, followed by vulcanization (170°C, 10 min, 5 MPa) and multi-step carbonization processes under an inert atmosphere (I: heating up to 240°C for 2 h; II: heating up to 320°C for 4 h; III: holding for 2 h), respectively.
The samples with respective shape and size were intentionally cut from 145 × 145 × 8 (length × width × thickness) mm plate on the stage after vulcanization prior to carbonization process and adopted for each individual method.
The microstructure of produced specimens was investigated by the FIB-SEM TESCAN AMBER (TESCAN GROUP, Brno, Czech Republic) using 5 kV of electron beam acceleration voltage and 300 pA of electron beam current at the working distance of 6 mm. Prior to examination, a thin gold layer was sputtered onto the sample surface to eliminate charging.
X-ray stress analysis is a non-destructive technique used to determine the residual and applied stresses in crystalline materials by measuring the interplanar spacings using X-ray diffraction (XRD). The
where
In this study, a portable goniometer was manufactured using additive techniques, as described in [25], in order to execute specimen tilt. Bruker D8 Advance (Bruker AXS Inc., Madison, WI, United States) diffractometer was employed to analyze the 20 × 10 × 8 mm composite bar top surface (20 × 10 mm area). A collimated copper source (
The Focused Ion Beam-Digital Image Correlation (FIB-DIC) technique was developed for the evaluation of the residual stresses within materials at the microscale. In this approach, FIB is used to mill a ring-shaped trench in the material surface sequentially, resulting in a small, localized strain change in the material due to stress relaxation. To capture the resulting deformation around the core, the surface of the specimen is prepared with a distinct speckle pattern. This pattern serves as a reference map. After the FIB process, the speckled surface exhibits subtle changes due to the stress relief. The changes are then evaluated using DIC. By comparing the initial and altered speckle patterns, DIC allows determining the displacements on the surface. These deformations are directly indicative of the residual stresses in the material [27–29]. Through computational analysis of the captured deformations, one can evaluate the residual stress within the analyzed region [30].
In this study, FIB-SEM TESCAN AMBER (TESCAN GROUP, Brno, Czech Republic) equipped with a focused beam of gallium ions was used to mill micro-rings of the following dimensions and conditions: inner diameter 10
Hole-drilling combined with Digital Laser Speckle Pattern Interferometry (DLSPI) offers a cutting-edge approach to residual stress measurement, combining the classical stress-relief method with advanced optical interferometry.
The hole-drilling technique is a well-established semi-destructive method used to measure residual stresses. The principle is straightforward: by drilling a small hole into a material, the surface is allowed to deform slightly in response to the local relaxation of residual stresses. The magnitude of these stresses can then be inferred from the amount and distribution of the deformation.
DLSPI is an optical method used to measure small deformations in a sample’s surface. When a surface is illuminated by laser light, it creates a speckle pattern due to the interference of the scattered light. When the surface deforms, this speckle pattern shifts. By comparing the initial and shifted speckle patterns, one can determine the surface deformation with high precision.
In this study, two symmetrical digital cameras were used to record the detected interferograms at the surface of 100 × 10 × 8 mm composite plate. The interferograms were collected with a pixel size of 0.0175 mm. The surface, which contained a drilled hole, was exposed to a diode laser of 532 nm wavelength. The coherence length of the 532 nm diode laser exceeded 50 m. The holographic plates maintained a spatial resolution of no less than 5,000 lines/mm. Additional phase shift was employed during exposure to differentiate physical displacement signs. The detailed information about used setup was described in the following paper [31]. The phase shift between the two surface states before and after drilling forms alternating dark and light interference patterns called as fringes. The number of fringes has a linear relationship with the diameter increment or decrement. These quantities are related by the multiplication factor
The contour method is a recently developed technique for measuring residual stress in materials. It is especially valuable because it provides a full 2D map (or contour) of the residual stress across a plane of the sample. The method consists of the following procedures. A specimen with unknown residual stresses is precisely cut along a plane, typically using methods like wire EDM (electrical discharge machining) to minimize additional stresses during the cutting process. As the material is cut, it relaxes, and the surfaces are deformed from the release of residual stresses. Next, the surface deplanation of the cut plane is measured by using various high-precision techniques such as contact or non-contact profilometers and is transformed into a map of the original residual stresses that were present before the cut solving the inverse problem by finite element methods (FEM) [32].
In this study, a casing made of stainless steel was specially machined to enable a tight fixation of the 100 × 10 × 8 mm composite bar during EDM cutting using a Mitsubishi MV-1200R machine (Mitsubishi Electric Europe B. V., Ratingen, Germany), which was executed at the slowest cutting speed. This casing is shown in Figure 1.
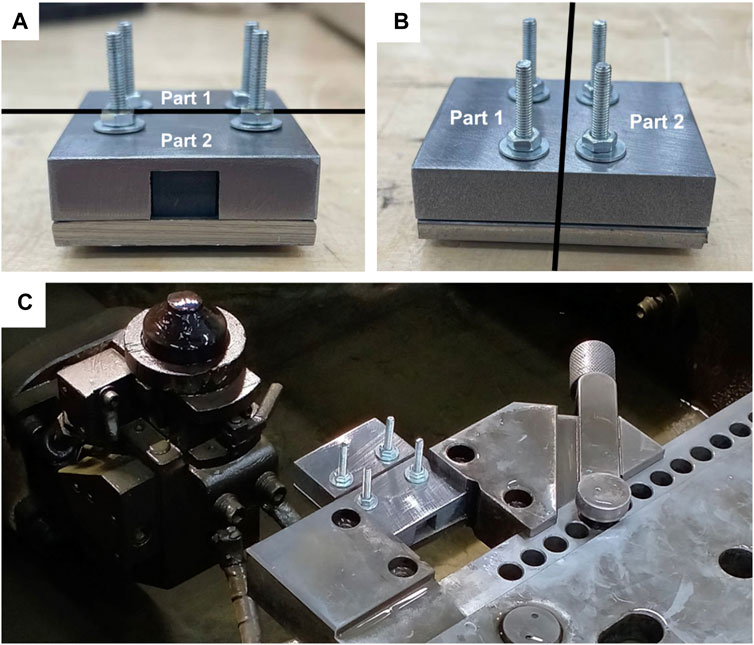
Figure 1. (A, B) Appearance of the stainless steel casing prepared for the tight fixation of a 100 × 10 × 8 mm composite bar during EDM cutting at different perspectives, (C) casing with composite sample fixed inside EDM machine before cutting.
The strain gauge method is one of the most widely used techniques for residual stress measurement due to its relative simplicity, cost-effectiveness, and direct approach.
In this study, strain gauges were glued onto the surface of 145 × 145 × 8 mm composite plate using cyanoacrylate adhesive. To ensure proper adhesion of the strain gauge with specimen surface, the surface was gently grinded with fine sandpaper, pre-degreased and pressed slightly by hand for about 3 min during the gluing process. Ultimately, 36 strain gauges (18 on the horizontal (x) axis and 18 on the vertical (y) axis, perpendicular to each other) formed a 3 × 3 grid, as shown in Figure 2.
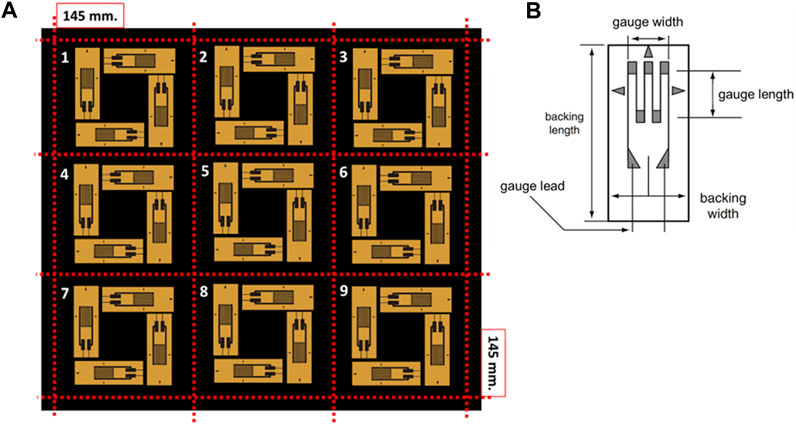
Figure 2. The schematic illustration of (A) strain gauges arrangement on the specimen surface, (B) strain gauge. Red dashed lines indicate lines along which sectors were cut Strain gauges 5P1-10-100-B-12 (TU 25-06.2002-80, Experimental Plant of Portioning Machines named after F.E. Dzerzhinsky, USSR) were used with the following characteristics: gauge width of 2 mm, gauge length of 10 mm, backing width of 6 mm, backing length of 19 mm, electrical resistance of 100.05 ± 0.10 Ω, and the sensitivity coefficient of 2.18. The sensitivity remained constant for each strain gauge because they were part of the same production batch.
In order to determine residual stress, a constant-voltage quarter-bridge circuit was used as depicted in Figure 3. The soldering points between wires and strain gauge were insulated with a quick-drying special mounting adhesive to enhance output signal accuracy. Identical measuring bridge was applied to each strain gauge.

Figure 3. The constant-voltage quarter-bridge circuit.
The equation for calculating strain based on the measured output voltage in this circuit is
where
To measure the voltage induced by stress relief during cutting, the HX711 chip was connected to the Arduino Uno microcontroller and operated with Arduino software. The bridge was powered by a 5 V power supply. The received signal was the output voltage value on the “BD” bridge section, as presented in Figure 3.
The residual stresses were measured using the release principle. This method involves measuring the strain both before and after material cutting. Subsequently, the difference in these values is recalculated to determine the released deformation and residual stress, using plane stress Hooke’s law:
where
The composite plate was cut using a band saw. The elastic modulus of the material was determined to be 16.5 GPa through mechanical tensile test. Poisson’s ratio of 0.27 was assumed and is consistent with the value of natural graphite. These values were used for each method.
Despite the fact that the strain gauge method provides a simple way to determine residual stresses, it is essential to recognize its limitations and the potential sources of error to ensure the reliability and relevance of the results [33]:
1) Semi-destructive nature. To measure residual stresses, the method necessitates material removal, typically by drilling a hole. This causes localized damage, potentially limiting the reuse of the specimen for subsequent tests or applications.
2) Depth limitation. The depth of measurement is constrained by the hole or cut’s size. Consequently, the method might not capture the full stress profile, especially if the stresses vary significantly with depth.
3) Assumption of uniformity. The technique presumes that the stress state remains consistent over the depth of the hole or cut. If this assumption does not hold, the stress determination can be skewed.
4) Surface preparation sensitivity. Accurate measurements rely on meticulous surface preparation. Inadequate cleaning, grinding, or polishing might affect strain gauge adhesion and readings.
5) Gauge sensitivity and drift. Strain gauges can be susceptible to temperature fluctuations, leading to potential drift in readings. Moreover, they might not capture very high-frequency stress variations due to their inherent bandwidth limitations.
Sample after vulcanization is an elastomer, i.e. is in a very mildly cross-linked state with low modulus and hence low level of residual stresses. During subsequent carbonization the sample acquires much higher stiffness and strength, which also gives rise to more significant residual stresses. It is these stresses that play the principal role in determining the sample distortion and durability. As the samples were deliberately cut before the carbonization process, it is assumed that any resulting residual stress state will remain unchanged. This is because the fabrication process is not yet complete, and extrinsic residual stresses will be generated.
It should assume that a series of samples were fabricated to ensure the repeatability of their shape. Subsequently, residual stress evaluation was performed on a representative sample at selected locations, with at least two tests per location.
The obtained 1D profile of the XRD data is shown in Figure 4. It was taken without tilting and used as a reference. The refinement analysis identified the peak positions and matched them with pure graphite crystal structure. X-ray stress analysis is a common method for evaluating internal stresses in crystalline materials, however, its use poses certain challenges and requires an understanding of the system under study.
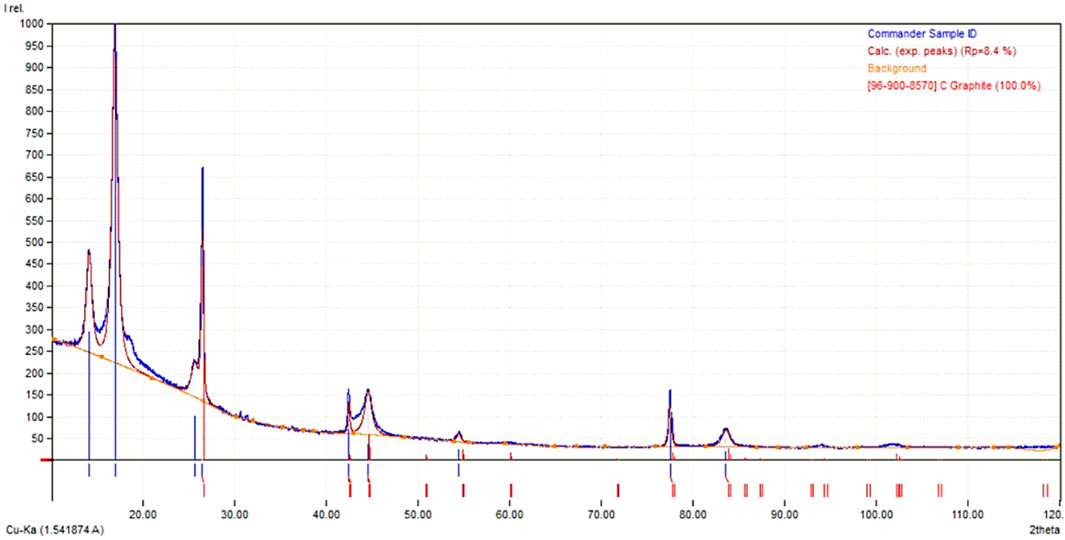
Figure 4. The XRD profile obtained for the composite without tilting.
Elastomers are generally amorphous with little to no long-range order, which means that traditional XRD techniques cannot be directly applied to evaluate stresses in the elastomer matrix. For this reason, any stress evaluation in the elastomer would typically rely on mechanical testing or other methods rather than X-ray techniques. However, carbon-based materials, such as graphite, carbon black, etc., have specific crystalline structures. For instance, graphite has a hexagonal lattice, while carbon nanotubes may have both hexagonal and chiral structures. The presence of these carbon-based materials can introduce internal stresses into the composite due to differences in thermal expansion coefficients, mechanical loading, or manufacturing processes. Thus, X-ray stress analysis can evaluate the combined effect of both the matrix and the filler (i.e., stressed state at the matrix-filler interface or within the filler, which depends on the filler size) if the resolution of the XRD instrument is sufficient to detect peak shifts.
In order to determine residual stresses with the highest possible accuracy, peaks with the largest diffraction angles were selected for processing according to Bragg’s law as shown in Figure 5A). The X-ray scattering was lost for tilt angles above 30° as illustrated in Figure 5B). This can be attributed to both factors, i.e. no crystal planes satisfying Bragg’s law or the displacement of the filler from under the X-ray beam due to tilting. The example of the initial peak shape is demonstrated in Figure 5C). This peak was slightly split, as we can see a small shoulder from the right side. To eliminate the splitting effect and ensure the best match, we fitted not the center of a peak position but the center mass of a peak by Gaussian function. The dependence of
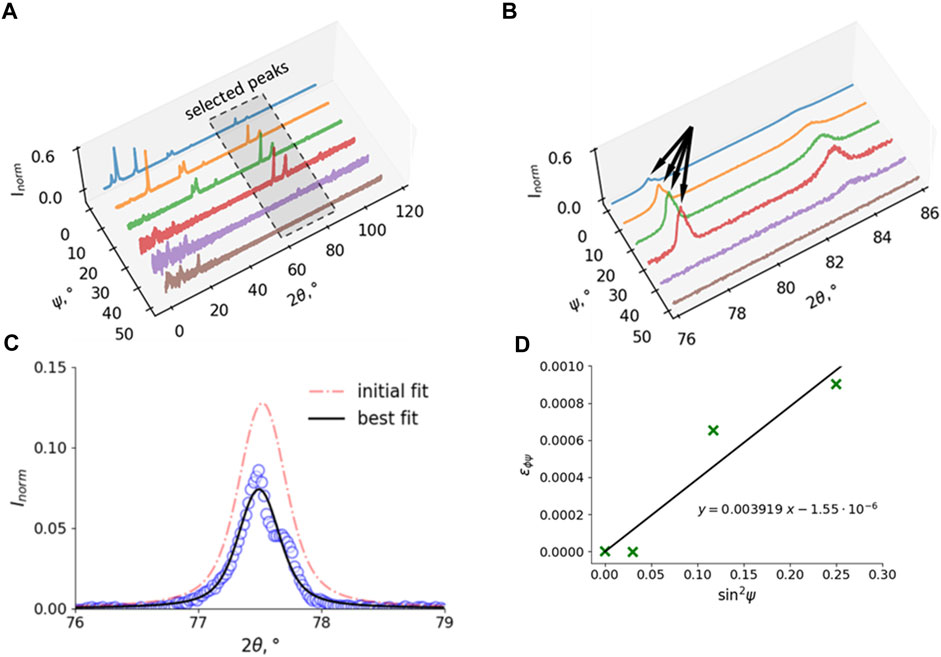
Figure 5. The procedure of the
The stress resolution of this method refers to its ability to accurately quantify residual stresses. Factors that can affect it include the quality of the X-ray equipment, sample preparation, data analysis methods, and calibration procedures. To achieve reliable and precise measurements of residual stresses using XRD, it is essential to use high-quality equipment, prepare samples carefully to minimize surface roughness and other artifacts, and employ accurate data analysis techniques. It is well-known that surface-sensitive methods can be affected by mechanical polishing with diamond slurry (with an average diameter ranging from 1 to 6 µm) or silica suspension (with an average diameter of less than 1 µm). For example, Joris Everaerts et al. [34] estimated the contributions of various surface finishing methods experimentally. They found that modification of the superficial layer on a depth of up to 4 µm can result in residual stress changes ranging from a few tens to several hundred MPa.
The FIB-DIC ring-core milling technique is a multi-scale method. In this case Ga+ FIB was used, making it possible to measure residual stresses locally at the scale of several microns to investigate the behavior within matrix, filler, and matrix-filler interface. The average size of the fillers is about 100
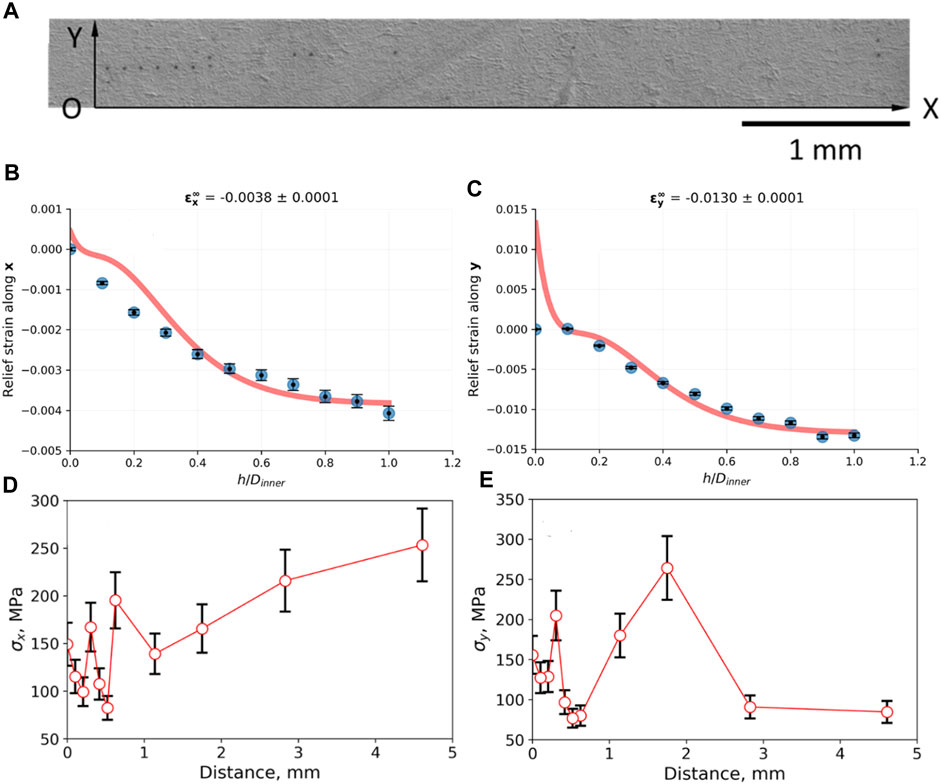
Figure 6. The procedure of the FIB-DIC residual stress analysis: (A) the locations of the milled rings, (B, C) relief strain behavior in the x and y directions, (D, E) the residual stress profiles along x and y-axis, respectively.
The displacement resolution was 0.01 pixels within the resolution of 1024 × 1024, corresponding to the nominal strain accuracy of 10−5. However, further sources of error must be taken into account [35], so that the effective strain accuracy can be estimated as about 10−4. Given the modulus of the carbonized materials of ∼16 GPa, this corresponds to the stress evaluation accuracy better than 2 MPa.
It is important to note that although the ion beam slightly modifies the material on the outer parts of the ring, this effect is excluded during DIC calculation, as shown in previous analyses [36]. The principle of the FIB-DIC method consists in measuring the displacements (in fact, average strain) inside the core (island) formed during the gradual ring milling of the material.
Typical relief strain behavior in the x and y directions is illustrated in Figures 6B, C, respectively. In both cases, the material had negative dynamics. This means that the material was under tension. The resulting residual stress profiles are shown in Figure 6D) and 6e), respectively. According to the profile along the x-axis, the residual stress distribution showed an increasing trend, ranging from approximately 50–300 MPa with an average value of 150 MPa, considering the error bars shown in black. A similar range and average value were obtained for another direction, but without any discernible trend.
The hole drilling method synchronized with the digital laser speckle interferometry technique did not reveal any fringes as shown in Figure 7. This can be associated with small stress magnitudes below the method accuracy. Although residual stresses in the material cannot be assessed using this method, it was decided to report the attempt in the manuscript for the information of other journal readers.
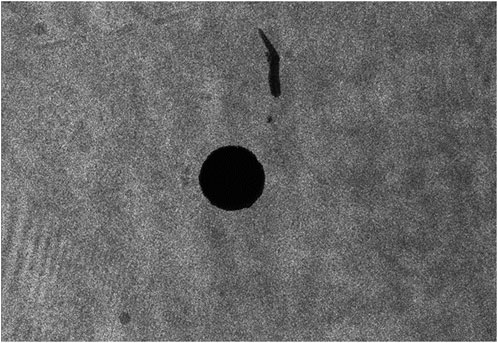
Figure 7. The example of the interreference fringe pattern obtained for carbonized sample.
The wire EDM is a gentle and almost exclusive cutting method suitable for the contour method, but its effectiveness depends on the material’s electrical conductivity. Attempts to use this technique to cut the investigated composite were unsuccessful as indicated in Figure 8; the wire broke each time due to the low conductivity of the material. More details on the small wire penetration and cut profile are shown in Figures 8C, D. The cut displayed a significant variations in height as well as noticeable levels of porosity and roughness on both the sides and at depth. The authors did make an attempt to apply the EDM method but did not find it possible to perform the cutting due to the material’s insufficient conductivity. However, it was decided to report the attempt in the manuscript for the information of other journal readers.
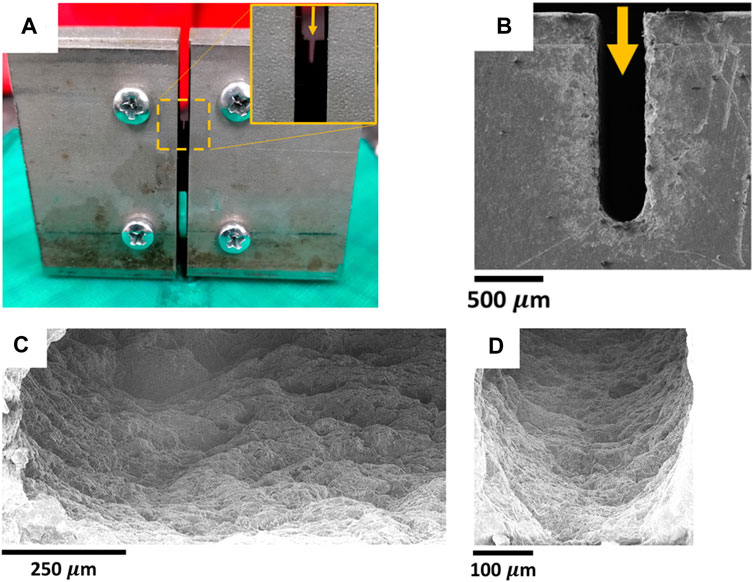
Figure 8. The implementation of the contour method to the investigated composite: (A) macro and (B) micro observations of the specimen cut, specimen morphology on (C) the side and (D) at depth of the cut.
To estimate the porosity of the composite, two cross sections were prepared and studied. The first one was examined after diamond cutting while the second one was carefully polished with different abrasives and colloidal silica solutions. The obtained microstructure is shown in Figure 9. The findings indicate that slow diamond cutting results in smearing of the fillers on the surface. In contrast, polishing enables the observation of pores, which are the combination of both true material porosity and fillers that fall out during the polishing process. The surface porosity value is equal to ∼15% relating to the estimation by segmentation approach of SEM images.
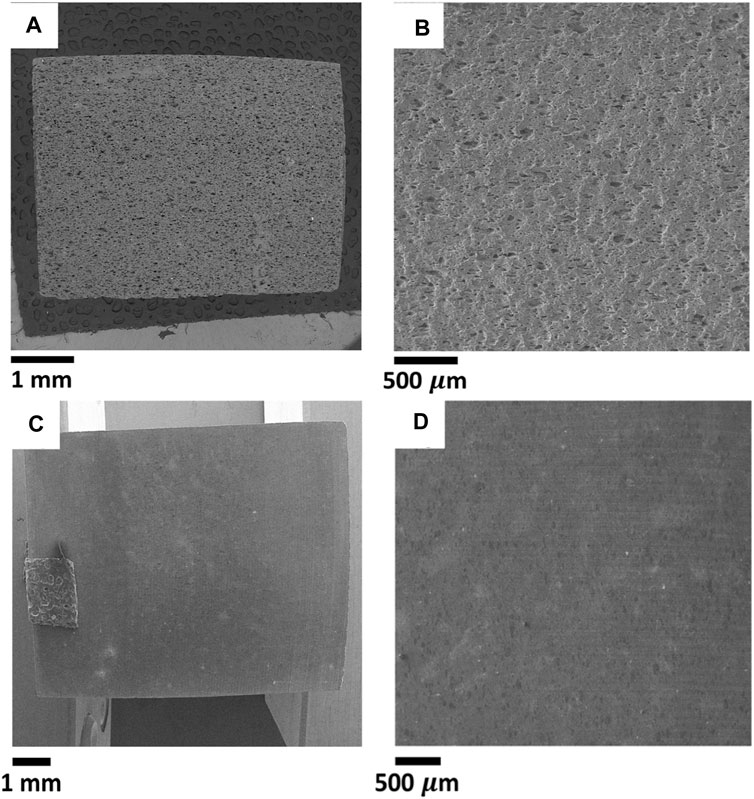
Figure 9. The microstructure characterization after (A, B) polishing and (C, D) diamond cutting.
The strain gauge method, estimated according to the Eqs 2, 3, revealed the residual stress distributions along the horizontal and vertical directions, as illustrated in Figure 10. On the one hand, the magnitudes of values are reasonable compared with the ultimate tensile strength, which can reach up to 30 MPa, i.e. ∼33%. However, they are relatively small, and could likely explain the lack of distinct fringes detected by the DLSPI hole drilling method due to a low sensitivity. The residual stress map along x-axis resembles a saddle shape which can be attributed to material shrinkage, release of volatiles, thermal degradation, etc. Similar changes were observed in the shape of the composite plate after carbonization process.
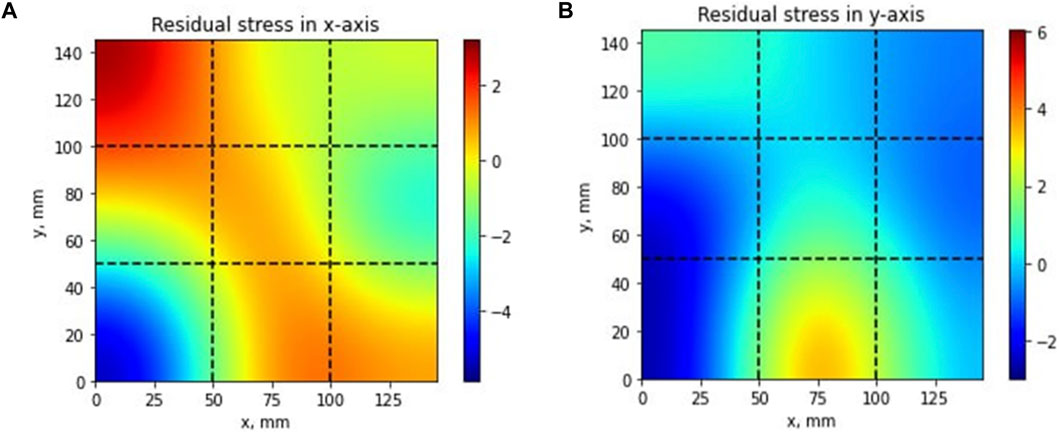
Figure 10. The residual stress distribution obtained with strain gauge method along (A) x-axis, (B) y-axis. Color bars unit is MPa.
In this article, the residual stresses induced during multi-stage manufacturing process of the low temperature carbonized elastomer-based composites filled with carbon black, graphite and short carbon fibers were studied by X-ray stress analysis using the
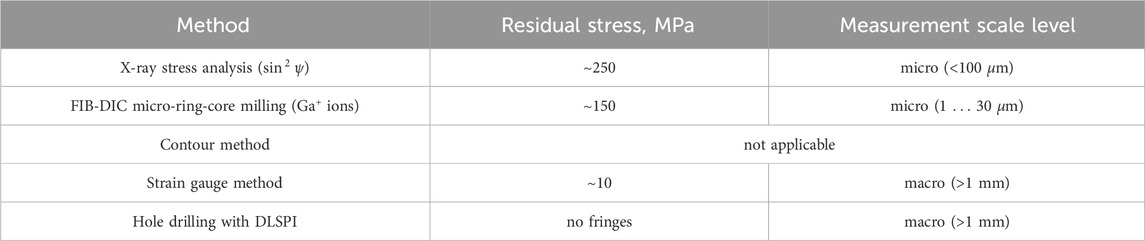
Table 1. The summary of the applied methods.
In order to draw conclusions from obtained results, it is necessary to recall the classification of the residual stresses. According to the N.N. Davidenkov’s classification system, the residual stresses can be divided into three main types:
1) Type I (macroscopic or self-balanced stresses): they are equilibrated over the entire volume of the body. These stresses are present due to non-uniform plastic deformations or temperature distributions within the body.
2) Type II (microscopic stresses): they are equilibrated over a small local volume and are typically due to heterogeneity in the material microstructure. These stresses might arise due to different phases within a material or from the presence of inclusions or precipitates.
3) Type III (nanoscale stresses): they are very localized stresses often at the atomic or molecular scale. These stresses occur around point defects, such as vacancies, interstitials, or dislocations. They can influence processes like diffusion and can play a role in the early stages of deformation.
It was found that X-ray stress analysis (for Type I + II + III) can measure internal residual stresses at the microscale level, but the detected response is the combined effect of both the matrix and the filler due to the crystalline structure of the latter. The residual stressed determined with the
a) use high-resolution XRD instruments to improve peak detection in the presence of a scattering elastomer matrix;
b) couple XRD with other techniques like Raman spectroscopy, especially for materials like graphene, which provides characteristic Raman peaks (Raman can also offer insights into stress states in certain carbon materials);
c) employ analytical modeling and simulations to aid in interpreting the XRD results, accounting for the complex interactions between the elastomer matrix and carbon fillers.
In contrast, the FIB-DIC technique (for Type I + II) can determine residual stress within matrix/filler/matrix-filler interface/filler-filler interface at microscale level but this method is limited by the Ga ion beam capability to etch volume not exceeding 30 × 30 × 30
It was not possible to obtain results from the contour method (for Type I) for this composite due to its low electrical conductivity. The EDM wire was repeatedly broken during cutting process.
The DLSPI hole drilling method (for Type I) could not be used for composites that underwent carbonization due to the low level of macroscopic residual stresses.
The strain gauge method (for Type I) showed the most reasonable result, namely, the residual stresses distribution resembled the same saddle shape usually observed for composite plates after carbonization. This behavior was associated with different processing and material phenomena such as material shrinkage, release of volatiles, thermal degradation, etc.
To conclude, the X-ray stress analysis and the FIB-DIC ring-core milling technique can be used for such composites to evaluate residual stress at the microscale level of Type I + II. They revealed the residual stresses with magnitude of tens to hundreds MPa that are related to the stress concentrations arising due to the mismatch of the thermal expansion coefficient between matrix and fillers, interfacial interactions, volume changes due to pores, etc. On the other hand, to measure internal residual stresses within carbonized elastomeric matrix filled with carbon-based materials at the macroscopic scale of Type I, the strain gauge method can be chosen as a simplest and reliable method.
It is also worth to note that both X-ray and FIB-DIC methods probe a relatively thin superficial layer of the composite article. This layer is relatively dense and less porous as shown in Figure 11, implying that residual stress relief due to pore formation during low-temperature carbonization was less pronounced. The evacuation of volatiles formed as a result of thermal destruction of elastomer matrix was, perhaps, very limited through the large faces connected to metal plates and it took place mainly through the free edges. Therefore, only the thin surface layer of the large faces retained its solidity, and the residual stress determined by the X-ray and FIB-DIC methods. This observation hints that technological measures for the control over residual stress may be developed for this class of carbon materials.
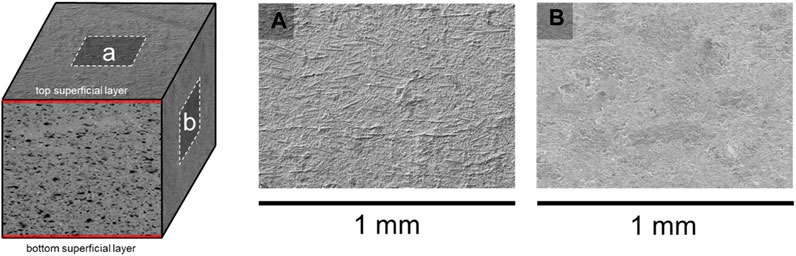
Figure 11. The pseudo 3D structure of the composite under investigation with the thin top and bottom surface layers indicated by red transparent lines. Two insets illustrate the detailed (A) top and (B) side views of the structure.
The data supporting the findings of this study are available on request from the corresponding author.
ESS: Data curation, Formal Analysis, Investigation, Resources, Software, Validation, Visualization, Writing–original draft. SDI: Conceptualization, Data curation, Formal Analysis, Investigation, Methodology, Software, Validation, Writing–review and editing. AIS: Funding acquisition, Project administration, Supervision, Writing–review and editing. AAS: Supervision, Writing–review and editing. AMK: Funding acquisition, Project administration, Supervision, Writing–review and editing.
The author(s) declare that financial support was received for the research, authorship, and/or publication of this article. This work was supported by the Federal Academic Leadership program “Priority 2030” under the “Increase Competitiveness” program of the National University of Science and Technology MISIS (grant number K1-2022-032).
The authors thank the National University of Science and Technology MISIS for the support under the grant K1-2022-032.
The authors declare that the research was conducted in the absence of any commercial or financial relationships that could be construed as a potential conflict of interest.
All claims expressed in this article are solely those of the authors and do not necessarily represent those of their affiliated organizations, or those of the publisher, the editors and the reviewers. Any product that may be evaluated in this article, or claim that may be made by its manufacturer, is not guaranteed or endorsed by the publisher.
1. Weber AZ, Mench MM, Meyers JP, Ross PN, Gostick JT, Liu Q. Redox flow batteries: a review. J Appl Electrochemistry (2011) 41(10):1137–64. doi:10.1007/s10800-011-0348-2
2. Skyllas-Kazacos M, Chakrabarti MH, Hajimolana SA, Mjalli FS, Saleem M. Progress in flow battery research and development. J Electrochem Soc (2011) 158(8):R55–R79. doi:10.1149/1.3599565
3. Kear G, Shah AA, Walsh FC. Development of the all-vanadium redox flow battery for energy storage: a review of technological, financial and policy aspects. Int J Energ Res (2011) 36(11):1105–20. doi:10.1002/er.1863
4. Olabi AG, Allam MA, Abdelkareem MA, Deepa TD, Alami AH, Abbas Q, et al. Redox flow batteries: recent development in main components, emerging technologies, diagnostic techniques, large-scale applications, and challenges and barriers. Batteries (2023) 9(8):409. doi:10.3390/batteries9080409
5. Park S-K, Shim J, Yang JH, Jin CS, Lee BS, Lee YS, et al. The influence of compressed carbon felt electrodes on the performance of a vanadium redox flow battery. Electrochimica Acta (2014) 116:447–52. doi:10.1016/j.electacta.2013.11.073
6. Aluko A, Knight A. A review on vanadium redox flow battery storage systems for large-scale power systems application. IEEE Access (2023) 11:13773–93. doi:10.1109/ACCESS.2023.3243800
7. Huggins RA. Advanced batteries: materials science aspects. New York, NY: Springer (2008). doi:10.1007/978-0-387-76424-5
8. Satola B. Review – bipolar plates for the vanadium redox flow battery. J Electrochem Soc (2021) 168(6):060503. doi:10.1149/1945-7111/ac0177
9. Karimi S, Fraser N, Roberts B, Foulkes FR. A review of metallic bipolar plates for proton exchange membrane fuel cells: materials and fabrication methods. Adv Mater Sci Eng (2012) 2012:1–22. doi:10.1155/2012/828070
10. Ulaganathan M, Aravindan V, Yan Q, Madhavi S, Skyllas-Kazacos M, Lim TM. Recent advancements in all-vanadium redox flow batteries. Adv Mater Inter (2015) 3(1):1500309. doi:10.1002/admi.201500309
11. Kim S, Yoon Y, Narejo GM, Jung M, Kim KJ, Kim Y. Flexible graphite bipolar plates for vanadium redox flow batteries. Int J Energ Res (2021) 45(7):11098–108. doi:10.1002/er.6592
12. Skyllas-Kazacos M, Rychcik M, Robins RG, Fane AG, Green MA. New all-vanadium redox flow cell. J Electrochem Soc (1986) 133:1057–8. doi:10.1149/1.2108706
13. Sum E, Skyllas-Kazacos M. A study of the V(II)/V(III) redox couple for redox flow cell applications. J Power Sourc (1985) 15(2-3):179–90. doi:10.1016/0378-7753(85)80071-9
14. Wang W, Luo Q, Li B, Wei X, Li L, Yang Z. Recent progress in redox flow battery research and development. Adv Funct Mater (2012) 23(8):970–86. doi:10.1002/adfm.201200694
15. Stepashkin AA, Ignatyev SD, Chukov DI, Tcherdyntsev VV, Kaloshkin SD, Medvedeva EV. Low-temperature carbonized elastomer-based composites filled with silicon carbide. Polymers (2020) 12:2669. doi:10.3390/polym12112669
16. Chukov DI, Stepashkin AA, Salimon AI, Kaloshkin S. Highly filled elastomeric matrix composites: structure and property evolution at low temperature carbonization. Mater Des (2018) 156:22–31. doi:10.1016/j.matdes.2018.06.034
17. Ignatyev SD, Statnik ES, Ozherelkov DY, Zherebtsov DD, Salimon AI, Chukov DI, et al. Fracture toughness of moldable low-temperature carbonized elastomer-based composites filled with shungite and short carbon fibers. Polymers (2022) 14:1793. doi:10.3390/polym14091793
18. Statnik ES, Ignatyev SD, Stepashkin AA, Salimon AI, Chukov D, Kaloshkin SD, et al. The analysis of micro-scale deformation and fracture of carbonized elastomer-based composites by in situ SEM. Molecules (2021) 26:587. doi:10.3390/molecules26030587
19. Hermann A, Chaudhuri T, Spagnol P. Bipolar plates for PEM fuel cells: a review. Int J Hydrogen Energ (2005) 30(12):1297–302. doi:10.1016/j.ijhydene.2005.04.016
20. Karacan I, Erzurumluoğlu L. The effect of carbonization temperature on the structure and properties of carbon fibers prepared from poly(m-phenylene isophthalamide) precursor. Fibers Polym (2015) 16:1629–45. doi:10.1007/s12221-015-5030-6
21. Duan X, Srinivasakannan C, Wang X, Wang F, Liu X. Synthesis of activated carbon fibers from cotton by microwave induced H3PO4 activation. J Taiwan Inst Chem Eng (2017) 70:374–81. doi:10.1016/j.jtice.2016.10.036
22. Frąckowiak E. Carbon materials for supercapacitor application. Phys Chem Chem Phys (2007) 9(15):1774. doi:10.1039/b618139m
23. Kim JD, Roh JS, Kim MS. Effect of carbonization temperature on crystalline structure and properties of isotropic pitch-based carbon fiber. Carbon Lett (2017) 21:51–60. doi:10.5714/cl.2017.21.051
24. Korsunsky AM. A critical discussion of the sin2ψStress measurement technique. Mater Sci Forum (2008) 571-572:219–24. doi:10.4028/www.scientific.net/msf.571-572.219
25. Statnik ES, Uzun F, Lipovskikh SA, Kan YV, Eleonsky SI, Pisarev VS, et al. Comparative multi-modal, multi-scale residual stress evaluation in SLM 3D-printed Al-Si-Mg alloy (RS-300) parts. Metals (2021) 11:2064. doi:10.3390/met11122064
26. Match! - Phase Analysis using Powder Diffraction. Match! - phase analysis using powder diffraction, version 3.x, crystal impact - dr. H. Putz & dr. K. Brandenburg GbR, kreuzherrenstr. 102, 53227 bonn, Germany (2023). Available from: https://www.crystalimpact.de/match (Accessed on October 24, 2023).
27. Korsunsky AM, Sebastiani M, Bemporad E. Focused ion beam ring drilling for residual stress evaluation. Mater Lett (2009) 63(22):1961–3. doi:10.1016/j.matlet.2009.06.020
28. Sebastiani M, Sui T, Korsunsky AM. Residual stress evaluation at the micro- and nano-scale: recent advancements of measurement techniques, validation through modelling, and future challenges. Mater Des (2017) 118:204–6. doi:10.1016/j.matdes.2017.01.025
29. Everaerts J, Salvati E, Uzun F, Brandt LR, Zhang H, Korsunsky AM. Separating macro- (Type I) and micro- (Type II+III) residual stresses by ring-core FIB-DIC milling and eigenstrain modelling of a plastically bent titanium alloy bar. Acta Materialia (2018) 156:43–51. doi:10.1016/j.actamat.2018.06.035
30. Senn M. Digital image correlation and tracking. In: MATLAB central file exchange (2023). Available from: https://www.mathworks.com/matlabcentral/fileexchange/50994-digital-image-correlation-and-tracking (Accessed on October 24, 2023).
31. Pisarev VS, Odintsev IN, Eleonsky SI, Apalkov AA. Residual stress determination by optical interferometric measurements of hole diameter increments. Opt Lasers Eng (2018) 110:437–56. doi:10.1016/j.optlaseng.2018.06.022
32. Prime MB. Cross-Sectional mapping of residual stresses by measuring the surface contour after a cut. J Eng Mater Technology-transactions Asme (2000) 123(2):162–8. doi:10.1115/1.1345526
34. Everaerts J, Salvati E, Korsunsky AM. Nanoscale depth profiling of residual stresses due to fine surface finishing. Adv Mater Inter (2019) 6:1900947. doi:10.1002/admi.201900947
35. Salvati E, Sui T, Korsunsky AM. Uncertainty quantification of residual stress evaluation by the FIB–DIC ring-core method due to elastic anisotropy effects. Int J Sol Structures (2016) 87:61–9. doi:10.1016/j.ijsolstr.2016.02.031
Keywords: C-C composite, elastomer matrix, carbon-based fillers, vulcanization, carbonization, residual stress
Citation: Statnik ES, Ignatyev SD, Salimon AI, Stepashkin AA and Korsunsky AM (2024) Residual stress determination in a C-C composite consisting of a carbonized elastomer matrix filled with graphite, carbon black and short carbon fibers. Front. Phys. 12:1407517. doi: 10.3389/fphy.2024.1407517
Received: 26 March 2024; Accepted: 18 June 2024;
Published: 23 July 2024.
Edited by:
Anoop Mukhopadhyay, Sharda University, IndiaReviewed by:
Zhenyuan Xia, Chalmers University of Technology, SwedenCopyright © 2024 Statnik, Ignatyev, Salimon, Stepashkin and Korsunsky. This is an open-access article distributed under the terms of the Creative Commons Attribution License (CC BY). The use, distribution or reproduction in other forums is permitted, provided the original author(s) and the copyright owner(s) are credited and that the original publication in this journal is cited, in accordance with accepted academic practice. No use, distribution or reproduction is permitted which does not comply with these terms.
*Correspondence: Eugene S. Statnik, ZXVnZW5lLnN0YW5pa0Bza29sdGVjaC5ydQ==
Disclaimer: All claims expressed in this article are solely those of the authors and do not necessarily represent those of their affiliated organizations, or those of the publisher, the editors and the reviewers. Any product that may be evaluated in this article or claim that may be made by its manufacturer is not guaranteed or endorsed by the publisher.
Research integrity at Frontiers
Learn more about the work of our research integrity team to safeguard the quality of each article we publish.