 Yuru Cheng1,2†
 Yu Shen1,3*†Yuxia Gao2Ya Wen1*Ze Lv1,4Ning Wen1,4Erpeng Wang5Guanghe Li5Yong Bo1,3Qinjun Peng1,3
- 1Key Lab of Solid-State Laser, Technical Institute of Physics and Chemistry, Chinese Academy of Sciences, Beijing, China
- 2School of Science, Yanshan University, Qinhuangdao, China
- 3Key Lab of Functional Crystal and Laser Technology, Technical Institute of Physics and Chemistry, Chinese Academy of Sciences, Beijing, China
- 4University of Chinese Academy of Sciences, Beijing, China
- 5Institute of Optical Physics and Engineering Technology, Jinan, China
Three methods are used for a numerical solution, the Monte Carlo method, diffusion approximation equation model, and beam broaden model based on Beer–Lambert’s law equation. The comparison between the first two methods is reported theoretically, and the latter is a better choice in the high-density tissue. However, the comparison between the third method and the first or the second method is rarely reported. Two classical theoretical models describing the interaction between the laser and the bio-tissue are analyzed and compared to determine which is more suitable for analyzing the interaction, the beam broaden model or diffusion approximation equation model. Intensity distribution is simulated and compared for the two models. Temperature distribution and thermal damage are investigated theoretically and experimentally for both models. The differences and the reasons are analyzed. The diffusion approximation equation model is more suitable for analyzing the mechanism between the laser and the bio-tissue based on the degree of fitting between the simulated and experimental data. Theoretical analyses for the two models are carried out in detail. The comparison between the two models is rarely reported, and it is reported in this article for the first time, theoretically and experimentally. This report provides a better choice for quickly analyzing the interaction mechanism between the laser and the bio-tissue.
1 Introduction
Laser ablation has a great application in surgery with the advantage of high accuracy control, good hemostatic effects, no metastasis of excised tissue cells, and minimal need for local treatment. The interaction mechanism between the laser and the tissue is a hot research direction for laser ablation. The laser interaction with tissue can be categorized into several mechanisms, which include the photochemical interaction, photoablation, photodisruption, plasma-induced ablation, and thermal interaction [1]. Thermal interaction is an important part of the laser ablation process. Photon distribution in the tissue during the interaction induces the temperature rise and laser ablation. Therefore, the photon distribution is a key factor for thermal generation and then laser ablation.
Research status on photon distribution reported is analyzed in this article. The transient radiative transport equation is the basic law to analyze photon distribution, but it is hard to obtain the analytical solution [2]. Then, three methods are used for a numerical solution, the Monte Carlo (MC) method, diffusion approximation equation (DAE) model, and beam broaden (BB) model based on Beer–Lambert’s law equation. For the Monte Carlo method, it is regarded as the ‘gold standard’ in terms of photon distribution in simulated biological tissues [3, 4], but it also has a significant computational burden, often requiring hours or days for one accurate calculation usually. Alireza according to Monte Carlo calculated the photon distribution and simulated the thermal damage in different layers of the skin [5]. Regarding the DAE model, its calculation error is within 10% compared to the Monte Carlo method in high-density tissue. As the tissue density increases, the error decreases to less than 5%. However, to achieve a sufficiently low error level (<1%), its calculation speed is at least one order of magnitude faster than the Monte Carlo method when using a standard single-processor computer [6]. So, it is a better choice to calculate photon distribution in tissue quickly. The laser irradiation based on the solution of the diffusion equation is taken into account in the study of Jasinski [7]; Cavagnaro considering the water vaporization in the numerical models, which has a good agreement with the experiment [8]; for the BB model, it is also used to analyze the photon distribution and the temperature distribution. For example, Li concluded the theory of the thermal effects of laser irradiation on tissue, amending the BB model based on Beer–Lambert’s law to incorporate heat source Q, analyzing the temperature distribution by using different wavelengths [9, 10]; Wang simulated the temperature of tissue under different phase lag times and other parameters influencing the tissue by using Beer’s law to calculate the light distribution [11].
The three methods are analyzed theoretically in other reports [3–7, 10]. The comparison between the first two methods is reported theoretically, and the latter is a better choice in the high-density tissue. However, the comparison between the third method and the first or the second method is rarely reported. This paper reports the comparison between the second method and the third method, the DAE model and BB model, theoretically and experimentally. The comparison includes two parts: the first one is the comparison on photon distribution theoretically, and the second part is the comparison on temperature distribution and thermal damage distribution theoretically and experimentally. The DAE model is more suitable than the BB model for analyzing the interaction mechanism between the laser and the bio-tissue, based on the fitting degree between the simulated and experimental data.
2 Mathematical models
2.1 Photon distribution model
2.1.1 Beam broaden model
Based on Beer–Lambert’s law, the distribution energy of laser when the laser irradiates in the highly absorbed tissue can be expressed as follows [12]:
where R0 and I0 are the light reflection coefficient and the initial irradiance intensity at the surface, respectively;
2.1.2 Diffusion approximation equation model
The solution to the transient radiative transport equation is very difficult and only exists in some special cases. Therefore, the DAE model is often used to solve the intensity distribution in the biological tissues instead of the former [4].
According to the DAE model [1, 16], the total light intensity
The collimated intensity Ic of the CW laser is given by
where μ’t is the effective attenuation coefficient defined as
where
Based on the radiative transfer equation, the redistribution of intensity due to absorption and scattering inside the tissue medium can be obtained by solving the diffusion equation [17]:
where Id is the diffuse intensity, v is the velocity of light in the medium, and
The initial conditions are as follows:
The boundary condition is
where n is the unit normal vector.
2.2 Bio-heat transfer model
As the classic bio-heat transfer model, Pennes’ theoretical model is widely used in biological tissue laser ablation and is expressed as follows [18]:
where ρ is the density, c is the specific heat of tissue, k is the thermal conductivity, and T is the tissue temperature.
Qext is the source function associated with the external heating of tissue, and Qbio is the sum of the blood heat source and metabolic heat source. The heat source function Qbio is 0 because the liver tissue is isolated. Pennes’ bio-heat equation is based on the classical Fourier’s law of heat conduction, which is the most frequently used model to determine the temperature distribution on the biological tissue.
The heat source function Qext connected with laser heating is defined as follows [9, 10]:
For the long-time continuous irradiation condition, the part of time is defined as the truncation function φ(t):
The heat source function QH expressed the energy changes associated with the laser-induced evaporation of water within the tissue:
where Ha is the latent heat of water and P (%) is the percentage of necrotic tissue to characterize the damage, which is related to the degree of thermal damage Ω, which will be explained in the description in detail in Section 2.3. It is available in the bio-heat transfer model in COMSOL Multiphysics software.
The initial conditions and the boundary conditions in bio-heat transfer of the liver are shown in Figure 1.
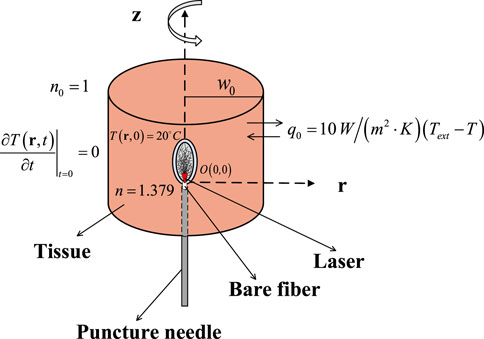
Figure 1. Initial and boundary conditions in the bio-heat transfer of the liver.
The initial temperature is 20°C, the initial conduction is
and the convective heat transfer coefficient q0 is
where Text is the ambient temperature of 20°C and T represents the temperature of the tissue.
2.3 Thermal damage model
The Arrhenius rate process model is widely recognized to calculate the thermal damage in the tissue [19]:
The damage probability P (%) is also used to indicate the degree of the thermal damage:
where A is the frequency factor, Ea is the activation energy of the denaturation reaction, R is the universal gas constant, and T(t) is the temperature, which varies with time when the laser irradiates the biological tissue. It is commonly used to represent 63% of cell death if Ω = 1. In this present study, a threshold of Ω = 4.6, which means a 99% probability of cell death that was used to quantify thermal damage [20].
3 Simulation parameter
Table 1 contains the parameter value of thermophysical and optical properties for simulating laser irradiation of the tissue. Table 2 lists the parameters for predicting thermal damage, and Table 3 details the parameters for the laser irradiation experiment setup.
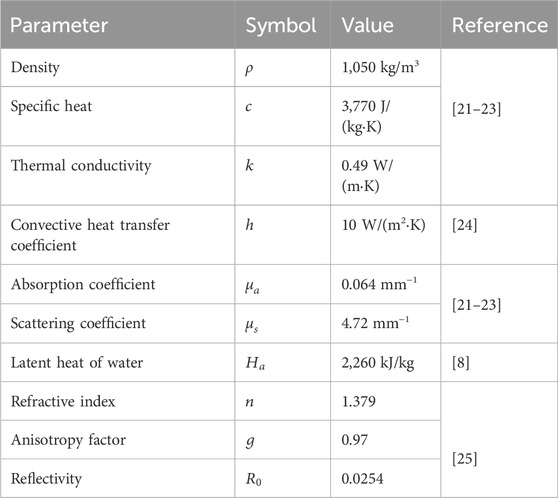
Table 1. Thermophysical and optical properties of the liver tissue.
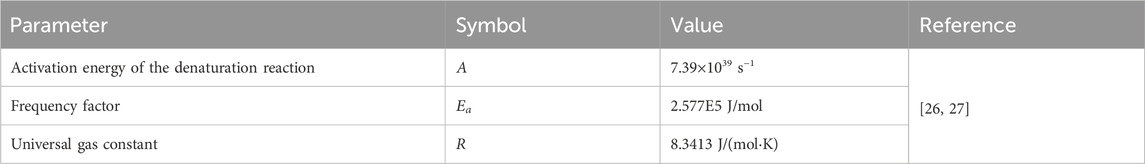
Table 2. Parameter for the thermal damage prediction.
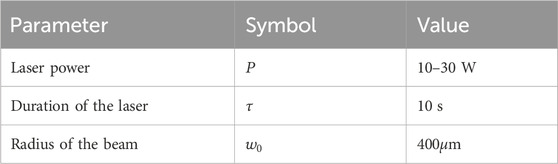
Table 3. Parameter for the irradiative laser.
4 Results and discussion
In these two different models, triangular elements are all chosen with a super-fine size for the mesh, with a total thickness of 30 mm and a radius of 15 mm, where the maximum cell size is 0.6 mm and the minimum cell size is 2.25 μm. The maximum unit growth rate is 1.2, and the curvature factor is 0.25, as shown in Figure 2.
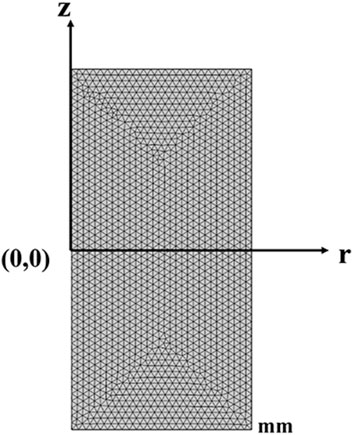
Figure 2. Mesh schematic representation of the liver in the 2D axisymmetric model.
4.1 Photon distribution in the liver
The two-dimensional (2D) sections of intensity distribution parallel to the axial direction based on different theoretical models are shown in Figure 3. In each small part of Figures 3A–C, the laser power represents as 14 W, 22 W, and 30 W from left to right, respectively. Photon distribution is different for the two models, the BB model shown in Figure 3A and the DAE model shown in Figure 3B. The differences in the intensity distribution between two models along the radial and axial directions are compared. In radial direction, the BB model exhibits an emanative distribution, which is about 1.9 times greater than that of the DAE model when the photon intensity drops to 80%. In the axial direction, the penetration depth is deeper for the DAE model compared to the BB model, which is nearly 24 times.
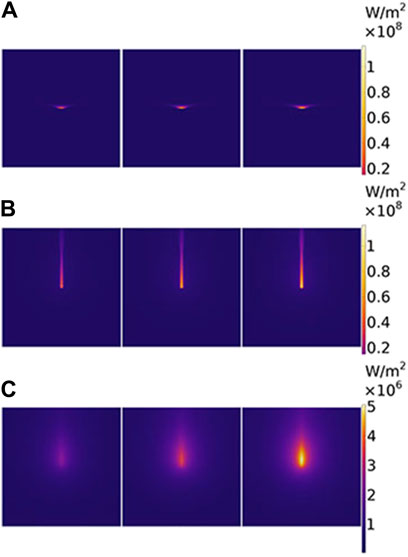
Figure 3. Two-dimensional section of intensity distribution parallel to the axial direction based on different theoretical models. (A) For the BB model, (B) for the DAE model, and (C) for the diffuse part of the intensity distribution in the DAE model. The laser power is 14 W, 22 W, and 30 W from the left to the right for each picture, respectively.
The reason for the differences is analyzed in detail. Intensity distribution along the radial and axial directions with different irradiated laser powers based on the two models is shown in Figure 4. On one hand, the photon intensity increases with the increasing laser power. The maximum of intensity distribution is 116 W/mm2 with a laser power of P = 30 W, and the minimum is 55 W/mm2 with a laser power of P = 14 W in both models, respectively. On the other hand, the intensity decreases along the radial direction, following a Gaussian distribution for the both models as the distance increases, reaching e−1 at r = 0.61 mm and 0.3 mm, respectively. The photon intensity decreases along the axial direction reaching e−1 at z = 0.26 mm for the first model and z = 5.4 mm for the second model. The decay rate is faster for the second model than the first model along the radial direction and slower than that along the axial direction, respectively. So, the effective penetration depth is deeper for the second model than the first model with values of 5.4 mm for the first model and 0.26 mm for the second model. The DAE model adds the influence of absorption in the axial direction and also considers the loss of scattering and the forward probability factor, explaining the reason for the distribution difference between the two models.
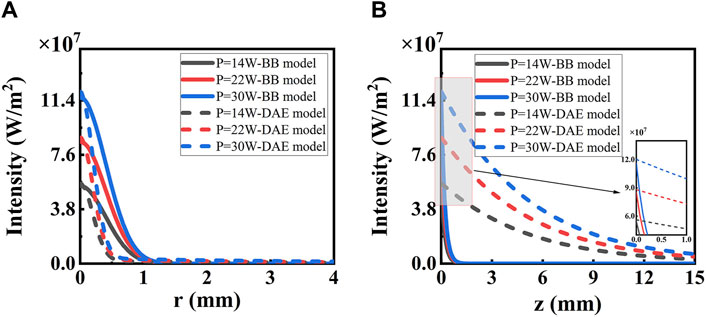
Figure 4. Intensity distribution along (A) radial and (B) axial directions with different irradiated laser power based on the two models. The solid lines represent the BB model, and the dashed lines represent the DAE model. The inset in (B) shows the details from z = 0 to z = 2 mm.
The effective penetration depth
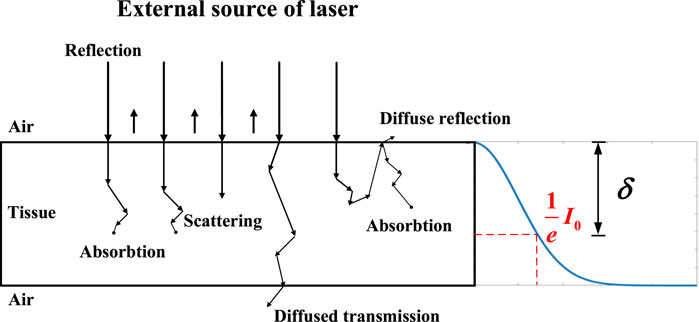
Figure 5. Effective penetration depth.
The DAE model is combined with the collimated part Ic and the diffuse part Id. The latter influences the width of ablation. To provide a clear understanding of its contribution, the diffuse part Id is analyzed in Figure 3C. Further details are presented in Figure 6 along both the radial and axial directions. The photon intensity increases with increasing irradiated laser power. The diffuse part of photon intensity decreases widely along both radial and axial directions, and the value in both two directions is equal initially. The diffuse part of photon intensity decreases along the radial direction as distance increases, reaching e−1 at r = 4.1 mm. The diffuse part of photon intensity reaches a peak at z = 1.7 mm and then decreases along the axial direction as the distance increases, reaching e−1 at z = 14 mm. The depth of the peak in photon intensity is due to the total internal reflection caused by the index mismatch boundary. These simulation data are used to evaluate the contribution of the diffuse part Id to the photon distribution inside the tissue. If necessary, the DAE model is a better choice, whereas the BB model may not suffice.
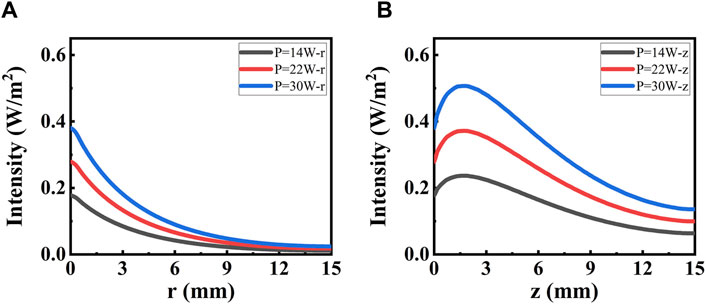
Figure 6. Intensity distribution for the diffuse part irradiated with different power. (A) Distribution along the radial direction. (B) Distribution along the axial direction.
4.2 Temperature distribution in the liver
As shown in Figure 7, it illustrates a 2D section of temperature distribution parallel to the axial direction based on different theoretical models. In each small part of Figures 7A, B, the laser power is depicted as 14 W, 22 W, and 30 W from left to right, respectively. Broadly speaking, the higher the power, the higher the temperature and the larger the range of temperature in the liver. Moreover, the temperature distribution differs between the two models, the BB model in Figure 7A and the DAE model in Figure 7B. The differences in temperature distribution between the two models along the radial and axial directions are compared. In the radial direction, the temperature distribution appears approximately like an ellipse for the BB model. Its width of temperature higher than 60°C is nearly 1.6 times than the DAE model. In the axial direction, the temperature distribution resembles like a droplet for the DAE model. Additionally, its penetration depth of temperatures higher than 60°C is deeper compared to the BB model, which is nearly 5.8 times. These differing phenomena in temperature distribution are consistent with the intensity distribution in Section 4.1.
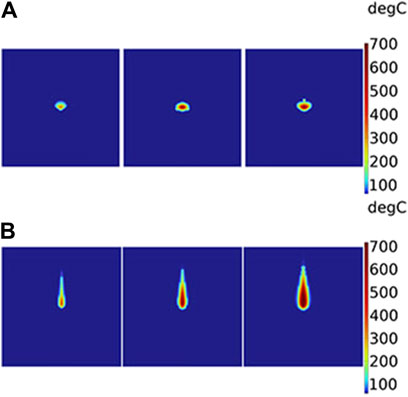
Figure 7. Two-dimensional section of temperature distribution parallel to the axial direction based on different theoretical models: (A) BB model and (B) DAE model. The laser power is 14 W, 22 W, and 30 W from the left to the right for each picture, respectively.
Temperature distribution along the radial and axial directions is depicted and thoroughly analyzed, with irradiated laser power based on the two models, as shown in Figure 8. A higher peak temperature and a wider range of distribution are observed with increasing laser irradiation power in both models. Significantly, differences emerge between the two models as the laser power changes. The peak temperatures are 339°C and 426°C with a laser power of P = 14 W for the two models, respectively. With a laser power of P = 30 W, the peak temperatures are 702°C and 1073°C for the two models, respectively. The temperature decreases to 60°C at r = 1.45 mm and 0.90 mm along the radial direction for the two models with the distance increasing when P = 14 W, respectively. The temperature exponentially drops to 60°C at z = 1.97 mm along the axial direction for the BB model as the distance increases when P = 14 W. The temperature peaks at z = 0.76 mm and then gradually decreases to 60°C at z = 11.42 mm for the DAE model along the axial direction as the distance increases when P = 14 W. The temperature distribution is higher for the first model than for the second model along the radial direction and lower than that of the second model along the axial direction. The temperature trend is consistent with the diffuse part of intensity distribution for the second model. The intensity distribution determines the temperature intensity as it is absorbed by the tissue. Due to the mismatch boundary, many photons are reflected back into the tissue unless absorbed. It is the scattering and absorption under the boundary conditions that determine the coordinate position of the peak temperature, occurring at a point near the laser incident surface.
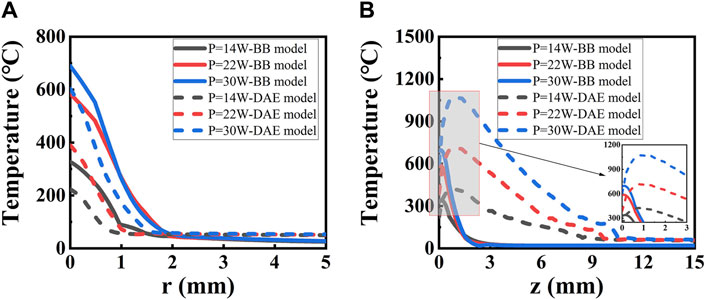
Figure 8. Temperature distribution along (A) radial and (B) axial directions with different irradiated laser powers based on the two models. The solid lines represent the BB model, and the dashed lines represent the DAE model. The inset in (B) shows the expended curves from z = 0 to z = 5.0 mm.
The intensity distribution and the temperature distribution exhibit obvious differences for the two models. To clarify which one is more suitable for analyzing the interaction between the laser and the tissue, a laser ablation experiment is conducted. The laser ablation experimental setup is shown in Figure 9, which is drawn by Figdraw. The home-built continuous wave (CW) laser source has a wavelength of 980 nm and a maximum average power of 300 W. The core diameter is 800 μm and NA = 0.22 for the fiber. The fresh liver is taken away from the slaughterhouse within less than 3 h. Four thermocouples (WRNK-191) are placed in different locations to measure the temperature of the liver along the axial direction. Its diameter is 1 mm, and the precise location values are measured to be 1 mm, 3 mm, and 4 mm from the laser output surface of the fiber. Their accuracy of temperature measurement is ±1.5°C, and the response speed is 0.5 s. The digital display (XSR40-V0) is used to record the temperature during the laser irradiation, and the total recorded time is 50 s with accuracy ±0.2% F.S. Temperature and thermal damage distributions in the liver ex vivo are then discussed theoretically and experimentally.
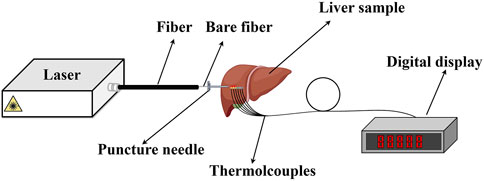
Figure 9. Experimental setup for laser ablation.
Temperature distribution is analyzed in detail for the two models both theoretically and experimentally along the axial direction with different laser power, as shown in Figure 10. It is observed that the experimental data fit better for the DAE model than the BB model, as seen in Figure 10. For P = 10 W, the maximum deviation is 72.9% at z = 7 mm and the minimum deviation is 2.43% at z = 1 mm. For P = 14 W, the maximum deviation is 82% at z = 7 mm and the minimum deviation is 10.4% at z = 1 mm. For P = 18 W, the maximum deviation is 67.3% at z = 7 mm and the minimum deviation is 9.4 at z = 5 mm. For P = 22 W, the maximum deviation is 37.2% at z = 8 mm and the minimum deviation is 3.5 at z = 4 mm. However, for the BB model, the minimum deviation is even more than 65%. Based on the temperature simulation results, the minimum deviation in the BB model is 26 times higher than that in the DAE model. This suggests that the numerical simulation of temperature distribution has a greater error in the BB model. Thus, it can be concluded that the DAE model is more suitable for analyzing the temperature distribution during the interaction between the laser and the tissue.
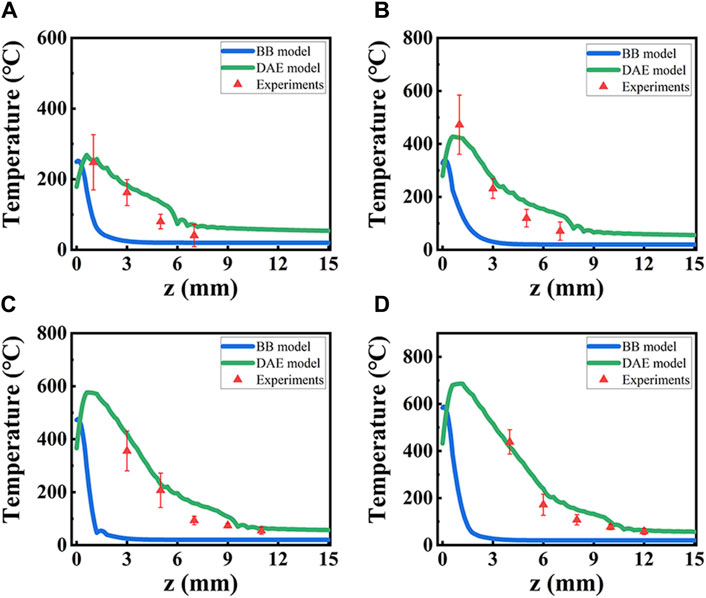
Figure 10. Temperature distribution from simulation data based on two models and experiment data, along the axial direction with different laser power P. (A–D) for P = 10 W, 14 W, 18 W, and 22 W. Blue lines: the BB model; green lines: DAE model; red triangles: experimental data.
4.3 Thermal damage in the liver
Thermal damage is analyzed in detail for the two models both theoretically and experimentally with different laser powers. The simulated thermal damage differs in two theoretical models, as shown in Figure 11. In the radial direction, changes are not obvious for the BB model but are noticeable for the DAE model when the laser power changes. Additionally, for the DAE model, the width of thermal damage increases by more than 3 mm with laser power increasing from 10 W to 30 W. In the axial direction, the length of thermal damage is more than 3 times greater for the DAE model than the BB model.
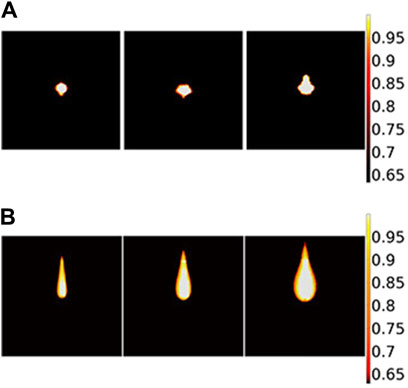
Figure 11. Two-dimensional section of thermal damage distribution parallel to the axial direction based on different theoretical models: (A) BB model and (B) DAE model. The laser power is 14 W, 22 W, and 30 W from the left to the right for each picture, respectively.
The ablation depth with different laser power is analyzed theoretically and experimentally (shown in Figure 12). For P = 10 W, the damage length is 1.2 mm, 5.0 mm for both the BB model and the DAE model in simulated results, and 5.0 mm for the experimental data. The deviation is 75.9% for the BB model and 0.5% for the DAE model, compared with the experimental data. For P = 14 W, the damage length is 1.2 mm, 6.3 mm for both the BB model and the DAE model in simulated results, and 6.9 mm for the experimental data. The deviation is 82.7% for the BB model and 9.4% for the DAE model, compared with the experimental data. For P = 18 W, the damage length is 1.8 mm for the BB model, 9.6 mm for the DAE model, and 9.25 mm for the experimental data. The deviation is 80.6% for the BB model and 3.8% for the DAE model, compared with the experimental data. For P = 22 W, the damage length is 1.9 mm for the BB model, 11 mm for the DAE model, and 10.8 mm for the experimental data. The deviation is 83.1% for the BB model and 2.2% for the DAE model, compared with the experimental data. Moreover, in the BB model, the minimum deviation is even more than 70% compared with the experimental values. Simulated results agree well with the experimental data for the DAE model. Additionally, the amount of error is within the mean square error range of the experimental measurements compared with the DAE model. Based on the simulated results of the damage length, the minimum deviation in the BB model simulations is 140 times that of the DAE simulation model, indicating a highly significant discrepancy from the experimental results. Therefore, the DAE model is more suitable for analyzing the thermal damage distribution during the interaction between the laser and the tissue.
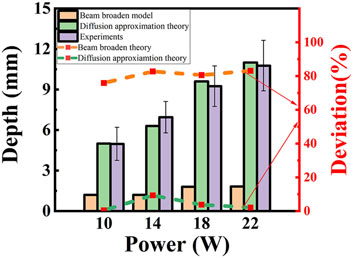
Figure 12. Thermal damage depth and deviation with different laser power. The column diagram shows the thermal damage length, and the value is shown on the left coordinate. The yellow column: BB model; the green column: DAE model; the purple column: experimental data. The dashed lines represent the deviation and the value shown on the right coordinate. The orange line: BB model; the green line: DAE model.
5 Conclusion
Three methods are used for a numerical solution, the MC method, DAE model, and BB model based on Beer–Lambert’s law equation. The comparison between the first two methods is reported theoretically, and the latter is a better choice in the high-density tissue. However, the comparison between the third method and the first or the second method is rarely reported. Two classical models to describe the interaction between the laser and the bio-tissue are analyzed and compared, to make it clear which one is more suitable for analyzing the mechanism.
First, intensity distribution is simulated and compared for the two models, the BB and DAE models. In the radial direction, it is about 1.9 times for the BB model compared with the DAE model when the intensity drops to 80%. In the axial direction, it is nearly 24 times for the DAE model compared with the BB model. The reason is that absorption is added in the axial direction, and the model also considers scattering loss and the forward probability factor for the DAE model.
Second, temperature distribution and thermal damage are investigated theoretically and experimentally for both models. The differences and the reasons are analyzed. In comparison to the experimental results, the minimum temperature deviation in the BB model is 26 times higher than that in the DAE model, while the minimum thermal damage deviation in the BB model is also 140 times higher than that in the DAE model. The DAE model fits better in temperature and thermal damage depth with the experimental data than the BB model.
The DAE model is more suitable for quickly analyzing the mechanism between the laser and the bio-tissue, based on the degree of fitting between the simulated and experimental data. This report provides a better choice for analyzing the interaction mechanism between the laser and the bio-tissue.
Data availability statement
The original contributions presented in the study are included in the article/Supplementary Material; further inquiries can be directed to the corresponding authors.
Ethics statement
Ethical approval was not required for the studies on animals in accordance with the local legislation and institutional requirements because only commercially available established cell lines were used.
Author contributions
YC: conceptualization, data curation, formal analysis, funding acquisition, investigation, methodology, project administration, resources, software, supervision, validation, visualization, writing–original draft, and writing–review and editing. YS: writing–original draft and writing–review and editing. YG: supervision and writing–review and editing. YW: supervision and writing–review and editing. ZL: formal analysis and writing–review and editing. NW: writing–review and editing. EW: investigation and writing–review and editing. GL: formal analysis and writing–review and editing. YB: supervision and writing–review and editing. QP: supervision and writing–review and editing.
Funding
The author(s) declare that financial support was received for the research, authorship, and/or publication of this article. The National Key Research and Development Program of China (key special projects, Young Scientist) (No. 2022YFB3607900); Global Common Challenges Project of International Partnership Program of Chinese Academy of Sciences (174GJHZ2022016GC); The National Special Support Program for High-level Talents Science and technology (Innovation leading talent program Defense Technology Innovation Foundation) (No. SQ2022RA24910010); Technical Institute of Physics and Chemistry of the Chinese Academy of Sciences; Key Laboratory Foundation of Chinese Academy of Sciences, Key Lab of Solid State Laser (No. CXJJ-22S020); and Talent introduction training program of Institute of Optical Physics and Engineering Technology, Qilu Zhongke (No. RK-JS-THZJG-22-01).
Conflict of interest
The authors declare that the research was conducted in the absence of any commercial or financial relationships that could be construed as a potential conflict of interest.
Publisher’s note
All claims expressed in this article are solely those of the authors and do not necessarily represent those of their affiliated organizations, or those of the publisher, the editors, and the reviewers. Any product that may be evaluated in this article, or claim that may be made by its manufacturer, is not guaranteed or endorsed by the publisher.
References
2. Luo Q, Huang C, Li Z, Yao Y, He Y, Wang LV, et al. Measurement of optical absorption coefficient of bio-tissue at 532nm wavelength. In: Fifth International Conference on Photonics and Imaging in Biology and Medicine (2007). p. 6531–6.
3. Lv C, Zhan R. Theoretical models of light distributionin biological tissues irradiated by laser. Laser Optoelectronics Prog (2021) 58(6):1–17. doi:10.3788/LOP202158.0600003
4. Zhang R, Verkruysse W, Aguilar G, Nelson JS. Comparison of diffusion approximation and Monte Carlo based finite element models for simulating thermal responses to laser irradiation in discrete vessels. Phys Med Biol (2005) 50(17):4075–86. doi:10.1088/0031-9155/50/17/011
5. Mohammazadeh A, Mahmouie S, Far AM. Monte Carlo and bioheat transfer simulation of dual sequential wavelength laser for port wine stains treatment. Ijst-t Electr Eng (2020) 20(28):7281–96. doi:10.1109/ICEE50131.2020.9260635
6. Zhang S, Chen S, Liu Y, Tan Z. Light diffusion in turbid cylinder based on finite element simulation. Acta Phys Sin-ch (2018) 47(9):1–10. doi:10.3788/gzxb20184709.0917001
7. Jasiński M, Majchrzak E, Turchan L. Numerical Analysis of the interactions between laser and soft tissues using generalized dual-phase lag equation. Appl Math Model (2016) 40(2):750–62. doi:10.1016/j.apm.2015.10.025
8. Cavagnaro M, Pinto R, Lopresto V. Numerical models to evaluate the temperature increase induced by ex vivo microwave thermal ablation. Phys Med Biol (2015) 60(8):3287–311. doi:10.1088/0031-9155/60/8/3287
9. Li X Numerical Analysis and experimental research on laser induced thermal effect in bio-tissues. Tianjin: Tianjin University (2004).
10. Li X, Fan S, Zhao Y, Xiao S. A numerical simulation of photothermal response in laser medicine. Chin Opt Lett (2004) 2(3):157–9.
11. Wang X, Qi H, Yang X, Xu H. Analysis of the time-space fractional bioheat transfer equation for biological tissues during laser irradiation. Int J Heat Mass Tran (2021) 177:121555–15. doi:10.1016/j.ijheatmasstransfer.2021.121555
12. Partovi B, Ahmadikia H, Mosharaf-Dehkordi M. Analytical and numerical Analysis of the dual-pulse lag heat transfer in a three-dimensional tissue subjected to a moving multi-point laser beam. J Therm Biol (2023) 112:103431. doi:10.1016/j.jtherbio.2022.103431
13. Lyu C, Zhan R. Accurate Analysis of limiting human dose of non-lethal laser weapons. Def Technol (2022) 18(4):678–88. doi:10.1016/j.dt.2021.03.018
14. Zhang W, Mei N, Qian L. Comparison of nutrients between donkey liver and pig liver, chicken liver and goose liver. J Food Saf Food Qual (2018) 9(16):4436–9.
15. Li C, Wang K, Huang J. Simulation of the effect of spot size on temperature field and weld forming in laser tissue welding. Optik (2018) 155:315–23. doi:10.1016/j.ijleo.2017.09.118
16. Ishimaru A. Diffusion of light in turbid material. Appl Opt (1989) 28(12):2210–5. doi:10.1364/AO.28.002210
17. Chen Z, Shi J, Yu Y, Chen X. Photothermal and photoacoustic properties of biological tissues with micro tumors under the action of pulsed laser. Optik (2022) 266(24):169637–14. doi:10.1016/j.ijleo.2022.169637
18. Pennes HH. Analysis of tissue and arterial blood temperatures in the resting human forearm. J Appl Physiol (1948) 1(2):93–122. doi:10.1152/jappl.1948.1.2.93
19. Moritz AR, Henriques FC. Studies of thermal injury: ii. The relative importance of time and surface temperature in the causation of cutaneous burns. Am J Pathol (1947) 23(5):695–720. doi:10.1039/jr9320002839
20. Cheong JK, Popov V, Alchera E, Locatelli I, Alfano M, Menichetti L, et al. A numerical study to investigate the effects of tumour position on the treatment of bladder cancer in mice using gold nanorods assisted photothermal ablation. Comput Biol Med (2021) 138:104881–12. doi:10.1016/j.compbiomed.2021.104881
21. Ye Y Experimental research and device design of laser-induced thermal damage to biological tissues. Guangdong, China: South China University of Technology (2020).
22. Pham NT, Lee SL, Park S, Lee YW, Kang HW. Real-time temperature monitoring with fiber bragg grating sensor during diffuser-assisted laser-induced interstitial thermotherapy. J Biomed Opt (2017) 22(4):045008. doi:10.1117/1.JBO.22.4.045008
23. Long S, Xu Y, Zhou F, Wang B, Zeng Y. Temperature simulation model of tumor tissue in tumor bearing mice during photothermal therapy. Appl Laser (2018) 38:142–9. doi:10.14128/j.cnki.al.20183801.142
24. Ji Y, Wang G, Chen Z, Chen H. Step response model and real-time prediction of temperature fields in laser irradiated biological tissues. Int J Therm Sci (2023) 194(16):108607–11. doi:10.1016/j.ijthermalsci.2023.108607
25. Zhang S, Li C, Cao L, Moser MAJ, Zhang W, Qian Z, et al. Modeling and ex vivo experimental validation of liver tissue carbonization with laser ablation. Comput Meth Prog Bio (2022) 217(8):106697. doi:10.1016/j.cmpb.2022.106697
26. Rui S, Mi Y, Liu L, Yao C, Li C. Study on temperature of liver and tumor under high frequency nanosecond pulsed field. In: 2015 IEEE Pulsed Power Conference (PPC); May, 2015; Austin, TX, USA (2015). p. 1–5.
Keywords: bio-heat transfer, laser ablation, diffusion approximation equation, beam broaden model, thermal damage
Citation: Cheng Y, Shen Y, Gao Y, Wen Y, Lv Z, Wen N, Wang E, Li G, Bo Y and Peng Q (2024) Investigation and comparison on the interaction of laser and bio-tissue based on two classical models, the beam broaden model and diffusion approximation equation model, theoretically and experimentally. Front. Phys. 12:1407471. doi: 10.3389/fphy.2024.1407471
Received: 26 March 2024; Accepted: 29 April 2024;
Published: 28 May 2024.
Edited by:
Bozhang Dong, University of California, Santa Barbara, United StatesReviewed by:
Yanzhong Chen, Chinese Academy of Sciences (CAS), ChinaWang Pengyuan, Chinese Academy of Sciences (CAS), China
Ting Yu, Chinese Academy of Sciences (CAS), China
Copyright © 2024 Cheng, Shen, Gao, Wen, Lv, Wen, Wang, Li, Bo and Peng. This is an open-access article distributed under the terms of the Creative Commons Attribution License (CC BY). The use, distribution or reproduction in other forums is permitted, provided the original author(s) and the copyright owner(s) are credited and that the original publication in this journal is cited, in accordance with accepted academic practice. No use, distribution or reproduction is permitted which does not comply with these terms.
*Correspondence: Yu Shen, c2hlbnl1QG1haWwuaXBjLmFjLmNu; Ya Wen, d2VueWFAbWFpbC5pcGMuYWMuY24=
†These authors have contributed equally to this work and share first authorship