 An Zhang
 Peng Liu
 He Zhang
94% of researchers rate our articles as excellent or good
Learn more about the work of our research integrity team to safeguard the quality of each article we publish.
Find out more
ORIGINAL RESEARCH article
Front. Phys., 14 June 2024
Sec. Interdisciplinary Physics
Volume 12 - 2024 | https://doi.org/10.3389/fphy.2024.1401538
This article is part of the Research TopicWave Propagation in Complex EnvironmentsView all 13 articles
To enhance the impact resistance of penetration fuze, this paper investigates the response of fuze buffer materials to stress waves and develops a model for stress wave transmission inside the fuze. The stress concentration impacts of different cell structures of Imitation Bamboo Type Penetration Fuze Buffer Protection Structure (IBS) under stress wave action are compared and analyzed. The paper elucidates the impact of different cell parameters on stress concentration impacts, establishes nonlinear fitting functions of Stress Concentration Factor (SCF) and cell parameters, and solves the prediction error. Based on the wave function expansion method, an expression for Dynamic Stress Concentration Factor (DSCF) when stress waves interact with the potting material is derived, and numerical results of DSCF around bubbles under different physical parameters are provided. Finally, dynamic impact tests are conducted on the combined buffer scheme of penetration fuze. Impact test results show that, under an initial velocity impact of 50 m/s, the overload peak attenuation rate is 39.42%, and under an initial velocity impact of 70 m/s, the overload peak attenuation rate is 32.87%. IBS can effectively protect the electronic components inside the fuze.
During the high-speed penetration process, both the projectile and the fuze are subjected to strong dynamic loads, and the stresses generated are transmitted in various forms of waves to different parts [1–3]. The phenomenon of stress waves is widely present in the lives and has been extensively studied by experts and scholars in various fields, mainly in engineering, military technology, and scientific theoretical research [4]. The most typical examples of stress wave phenomena are various explosive and impact load problems in the military field [5]. Under the dynamic response of impact loads, the response of objects often differs significantly from that under static loads [6]. For example, when glass is subjected to the impact of a stone, the back of the glass often fractures and collapses first. When a static load is applied to one end of a metal rod, an experimental phenomenon opposite to that of applying a dynamic load occurs: the deformation of the metal rod under static load is basically uniformly distributed along the metal rod, while under impact load, the deformation is concentrated more at the two ends of the metal rod [7, 8].
This article focuses on the study of buffer materials for penetration fuze and proposes an IBS. Establish a theoretical model for stress wave propagation inside the fuze and derive the energy absorption mechanism of IBS under axial impact load. By using finite element method to analyze the SCF of different cell structures under penetration overload, and exploring the influence of cell geometric parameters on SCF, a semi analytical solution of the nonlinear fitting function for predicting SCF is obtained. In addition, theoretical analysis and numerical calculation were conducted on the DSCF around the bubbles in the sealing material, and the distribution curve of the DSCF in the fuze sealing material was solved. Finally, the optimal structure of IBS is prepared through additive manufacturing technology, select the sealing material with the best buffering performance. Conduct dynamic impact tests on the optimized buffer scheme to verify that IBS can effectively reduce overload peaks and minimize damage to the electronic device structure of the fuze caused by stress waves.
Biomimetics is the study of the principles of structure and function of biological organisms, and based on these principles, new equipment, tools, and technologies are invented to create advanced techniques applicable to production, learning, and life. For example, in architecture, large-span thin-shell buildings are constructed by mimicking the structure of shells, and pillars are built by mimicking the structure of bones, which not only eliminates regions of stress concentration but also allows for the use of minimal building materials to withstand maximum loads. Zhang et al. [9] referred to the hierarchical structure of loofah sponge and the stiffening behavior of sea cucumber and proposed a new strategy for achieving multi-physical field protection through biomimetic structure design. This biomimetic structure effectively enhances the stiffness of polyurethane foam. Additionally, the stiffness of this biomimetic structure increases with increasing compressive strain rate, exhibiting excellent impact resistance under dynamic loads. Compared to polyurethane foam, the impact force of this biomimetic structure is reduced by 57.6%, and energy absorption is increased by 25.7%. This study provides an innovative means for the development of intelligent multi-physical field protection. Li [10] found that the arc-shaped structure of natural organisms can provide a reference for the design of impact-resistant structures. Most existing biomimetic arc-shaped impact-resistant structures are directly formed using 3D printing technology, and samples cannot dynamically adjust their impact resistance performance in various applications. This method uses 4D printing technology based on fuzed filament fabrication, dynamically adjusts process parameters, and incorporates them into the printing program to create flat structures with different design shapes. Through dynamic thermal stimulus processing, these structures can undergo deformation and transform into biomimetic arc-shaped structures. Thermal stimulus processing can drive the dynamic transformation of 2D planar structures into 3D structures. Under the same experimental conditions, the higher the thermal stimulus temperature, the more pronounced the deformation impact, and the higher the structural density. There is a certain positive correlation between the thermal stimulus temperature and the mechanical properties of biomimetic structure specimens. Additionally, designing different cyclic unit patterns has different compressive mechanical properties, with a greater number of cyclic units resulting in more prominent energy absorption characteristics. 3D models of Imitation Bamboo Type Penetration Fuze Buffer Protection Structure (IBS) and traditional concave hexagonal honeycomb structure are shown in Figure 1.
Figure 1. Honeycomb structure models of Penetration Fuze buffer. (A) IBS. (B) Traditional straight-edge structure.
During the penetration process of hard targets, when the projectile impacts the target plate at high speed due to strong dynamic loads, the stresses and deformations generated are propagated in the form of stress waves in the projectile-fuze structure. When the stress generated by the load reaches or far exceeds the yield strength of the projectile material, irreversible plastic deformation occurs in the material, resulting in the generation of plastic waves between the projectile and the fuze. Since the velocity of elastic waves is much faster than that of plastic waves, elastic waves precede plastic waves. Under uniaxial strain conditions, the velocity of elastic waves in the material is given by Eq. 2.1:
where C is the velocity of longitudinal elastic waves in the medium, determined by the material’s elastic modulus E and density ρ; and ρC is the impedance of longitudinal elastic waves. According to the theory of stress wave propagation, during the penetration of the projectile into the target plate, the impact is transmitted from the projectile to the buffer pad. When the elastic wave reaches the interface between two different media in the projectile-fuze structure, reflection and transmission of elastic waves occur. The reflected tensile elastic wave propagates to the left, unloading the elastic compression wave and the plastic loading wave successively. The transmitted elastic wave continues to propagate to the right, entering the cushioning and isolating material. Subsequently, the impact-resistant cushion is transmitted to the fuze casing, and the impact on the fuze casing passes through the potting layer before reaching the electronic device. Due to the different materials of the fuze casing, potting material, and circuit board, reflection and transmission of stress waves occur again during the internal propagation of stress waves in the fuze. In this paper, a 1D analysis of stress wave transmission is performed on the fuze casing, potting material, and circuit board, as shown in Figure 2.
Figure 2. 1D analysis model of fuze.
At the interface between the fuze casing and the potting material, and between the potting material and the circuit board, the equation can be expressed as Eq. 2.2:
where σ₁ is the stress of the fuze casing; σ₂ is the stress inside the potting material; σ3 is the stress on the circuit board; and ρC is the wave impedance of the material. Substituting the above values into the equation, the stress relationship between the potting material and the fuze body and PCB board is obtained as follows:
Through the above analysis of the potting material, in engineering applications, potting materials with low transmission coefficients should be selected to reinforce the circuit components and reduce the transmission of stress in the projectile.
The energy absorption behavior of honeycomb structures is described by the principle of energy conservation, which delineates the energy conversion process from intact to failure under in-plane loading conditions. It develops a nonlinear relationship between stress-strain and external work done by the load, which provides a solution closer to reality than directly solving boundary value problems of partial differential equations. Taking the elastoplastic energy absorption of honeycomb structures as an example, the strain energy density per unit volume is expressed as Eq. 2.3:
where WY is the strain energy density and εij is the strain component. Therefore, the total strain energy of elastoplastic deformation in honeycomb structures is given as Eq. 2.4:
If there is no energy loss during the crushing process of the honeycomb structure, then the strain energy inside the honeycomb structure numerically equals the work done by the surface load during the crushing displacement. According to the principle of virtual displacement, if the honeycomb structure is in a stable state under external loads, virtual displacements occur at various reference points inside the honeycomb structure. Likewise, the work done by external loads on virtual displacement numerically equals the virtual strain energy of the honeycomb structure under virtual displacement expressed as Eq. 2.5:
where δQe is the virtual work; fi is the volume force; Pi is the surface force; and δUi is the virtual displacement. Thus, the virtual strain energy caused by virtual displacement is Eq. 2.6:
If the external force is a time-varying load, it can be dominated by the potential function, then the variational equation can be expressed as Eq. 2.7:
where H is the total potential energy of the elastoplastic body. For the buffering honeycomb structure subjected to axial impact, initial deformation only results in local deformation bands. However, when the penetration overload exceeds tens of thousands of g-forces, the buffering honeycomb structure undergoes fracture and significant deformation, and energy is dissipated in other forms. Therefore, the honeycomb structure follows the principle of energy conservation under penetration conditions expressed as Eq. 2.8:
where the terms on the right-hand side represent energy dissipation due to bending, torsion, friction, and fracture, respectively. Generally, porous honeycomb structures exhibit strong energy absorption characteristics and can serve as ideal energy absorption structures. Under low-speed impacts (around 2000g), the energy absorption structure only undergoes elastic deformation. However, in the load conditions experienced by penetration fuze, as the projectile penetrates defensive structures and the overload exceeds 50000g, the energy absorption structure is crushed and compacted, exhibiting structural fracture and failure under such instantaneous high dynamic loading conditions.
The IBS designed in this article can effectively attenuate the impact amplitude when penetrating a reinforced concrete target, and improve the impact resistance of the internal circuit board of the fuze. In the project, the diameter of the projectile is 105–155mm, the strength of the target plate is C35-C60, and the buffer material is installed between the fuze and the projectile. The reserved thickness of the projectile in the buffer area is not more than 4 mm. Under ultra-high-speed penetration overload, the buffer protective structure for penetration fuze mainly undergoes linear elastic deformation, elastic buckling, plastic collapse, and fracture failure.
Under quasi-static compressive loads, honeycomb structures undergo linear elastic deformation and plastic collapse deformation. This section mainly studies the deformation under uniaxial loading in the plane, as shown in Figure 3.
Figure 3. Schematic of uniaxial loading on cell face. (A) Representative cell deformation effect. (B) Upper crossbeam force diagram. (C) Internal concave curved edge force diagram.
Where (a) represents the deformation impact of a representative cell under axial stress σ1; (b) represents the force diagram on the upper beam; and (c) represents the force diagram on the concave curved edge. The honeycomb structure initially enters the linear elastic region under initial compression displacement, where elastic deformation predominates. The equilibrium equation is given as Eq. 2.9:
where ts is the thickness of the thin wall in the axial direction; R is the bending moment; and X is the horizontal load. The deflection of the line is expressed as Eq. 2.10:
where Es is Young’s modulus; I is the second moment of inertia of the line; and the deflection component is parallel to the load direction. The expression for cell strain can be derived as Eq. 2.11:
Therefore, the elastic modulus of the cell in the axial direction is shown as Eq. 2.12:
Similarly, analyzing the stress deformation on the curved edge, the honeycomb structure’s curved edge undergoes shear deformation under penetration overload. Due to the symmetry of the cell, the analysis shows that points A, B, and C of the 1/4 cell unit do not experience relative displacement under shear load, and the shear deflection is caused by compression of the upper beam and rotation around point B. The rotation angle is φ, as shown in Figure 3C, which represents the schematic diagram of force deformation of a representative honeycomb cell upper beam, curved edge, and support under penetration load. The resultant moment at point B can be expressed as Eq. 2.13:
Similarly, based on the previous analysis of deflection and moment of inertia, the expression for the rotation angle can be obtained as Eq. 2.14:
Therefore, the expression for the shear deflection at the right vertex D of the upper beam is determined as Eq. 2.15:
The shear strain on the curved edge can be expressed as Eq. 2.16:
Using the same derivation method as the analysis of beam deformation under load, the shear modulus of the biomimetic honeycomb structure is obtained as Eq. 2.17:
When the honeycomb structure is in the initial stage of penetration load, linear elastic deformation predominates. The honeycomb structure can be analyzed as an elastic body. When the compressive load in the axial direction exceeds the Euler buckling load, elastic buckling occurs. The expression is given as Eq. 2.18:
where ϖ is the endpoint constraint factor, representing the rotational stiffness at the connection between the curved edge of the representative honeycomb cell and the support rod; I is the second moment of inertia of the straight line. Similarly, the relationship between the curved edge bearing the penetration load and the impact stress can be expressed as Eq. 2.19:
When P=Pcri, the honeycomb buffer honeycomb absorbs penetration overload energy through elastic collapse, and its collapse stress is determined as Eq. 2.20:
where ϖ is impacted by the cell line diameter on the rotation stiffness at the connection between the curved edge and the support rod. The larger the value, the greater the suppression of the rotational impact of the cell, with a maximum value of 1.7. The smaller the value, the less inhibition of the rotational impact of the cell, with a minimum value of 0.3, at which point the cell rotates freely.
As the penetration overload increases gradually, when the axial load stress borne by the buffer honeycomb exceeds the critical load, plastic collapse of the honeycomb structure begins, and the pores are gradually filled. At this point, due to 3D structure of the buffer honeycomb and the negative Poisson’s ratio impact, the honeycomb structure as a whole is in a state of being squeezed towards the geometric center from all sides. Therefore, this section analyzes from both the axial and radial directions. The plastic collapse of the honeycomb structure in the axial direction is shown in Figure 3. Under this condition, the equilibrium equation is shown as Eq. 2.21:
During the process of the projectile penetrating the target, the kinetic energy of the internal components of the fuze is mainly absorbed by the plastic deformation of the honeycomb structure. Let the cellular structure compress the energy absorption per unit volume as η, according to the law of conservation of energy, the plastic deformation energy of honeycomb materials ΔE is Eq. 2.22:
In the formula: ΔL is the compression stroke; S is the number of cells. Only when
By combining (2.21), (2.22) and (2.23), it can be concluded that when plastic shear torsion occurs at each connection point of the honeycomb structure, the plastic work done at the connection point is Eq. 2.24:
Where MP represents the plastic moment during plastic shear twisting. Based on the empirical equation of moment, the critical value of plastic collapse stress for the buffer honeycomb can be derived as Eq. 2.25:
Similarly, based on the expression of plastic moment and the critical value of plastic collapse stress, the maximum moment of the buffer honeycomb can be obtained as Eq. 2.26:
In the radial direction, the buffer honeycomb cell is mainly subjected to compression from adjacent cells. By equating the plastic work required for compression deformation to the work done by the penetration overload stress, the relationship between the maximum moment of the buffer honeycomb and the plastic moment is expressed as Eq. 2.27:
By analyzing the radial plastic shear situation using a method similar to that of axial loading, in the early stages of collapse, the cells surrounding the representative cell undergo shear loading in the radial direction, causing plastic shear of the buffer honeycomb. The critical shear strength is calculated as Eq. 2.28:
In the early to mid-stages of collapse, elastic buckling is insufficient to support the strength of the buffer honeycomb, leading to plastic collapse. At this point, the equilibrium equation is given as Eq. 2.29:
Existing research results show that for 3D printed metal structures, the magnitude of the elastic modulus is relatively low. When the relative density is small, the buffer honeycomb undergoes plastic collapse under penetration load.
As the penetration overload further increases, the buffer honeycomb enters the final stage of protective work: fracture failure. At this point, the cells begin to collapse on a large scale, and the pores are gradually filled. The compressive stress borne by the buffer honeycomb under the action of the moment Mmax is determined as Eq. 2.30:
When the compressive stress equals the fracture strength of the buffer honeycomb, the structure undergoes fracture failure, and the fracture moment is expressed as Eq. 2.31:
By substituting the fracture moment into the equation for the maximum moment of the buffer honeycomb, the fracture strength of the biomimetic structure is obtained as Eq. 2.32:
The maximum local stress at the irregularities of the outer shape of the buffering structure is denoted as σmax, and it can be obtained through solid elastoplastic deformation theory and structural mechanics calculations. During the process of projectile penetration through the target, the theoretical Stress Concentration Factor (SCF) is represented by the ratio of the maximum local stress σmax to the nominal stress σnom approximately uniformly distributed on the cross-section of the buffering structure can be represented as Eq. 2.33:
From the equation above, the more abrupt the external shape mutations of the buffering structure, the more severe the stress concentration. In the case of penetration fuze with buffering structures made of metal, under the action of penetration overload, as the maximum local stress reaches the yield limit of the buffering structure, and with the continued increase in penetration overload, the nominal strain continues to increase while the nominal stress no longer increases. The additional overload will be borne by the remaining parts until the nominal stress at all section nodal points of the entire honeycomb structure approaches the yield strength. At this point, the energy absorption process of the buffering structure concludes.
IBS finite element model is imported into SolidWorks Simulation, with the biomimetic cell model being 6 mm in length and 4 mm in height. The structure is made of 7,075 aluminum alloy with elastic modulus of 7.2 × 10¹⁰N/m2, shear modulus of 2.69 × 10¹⁰N/m2, yield strength of 4.35 × 10⁸N/m2, density of 2830 kg/m3, and Poisson’s ratio of 0.33. The bottom of the cell is fixed, and a uniaxial compression load is applied to the top surface. To ensure the intuitiveness and efficiency of the finite element simulation, based on Saint-Venant principle, a 1:100 equivalent reduction model is selected for static analysis. Under actual penetration conditions, the penetration overload experienced by the projectile ranges from 0 to 50000 g. Compression loads of 20000g, 35000g, and 50000 g are respectively applied for in-plane axial loading to simulate the mechanical response behavior of IBS during penetration, and to compare it with traditional concave hexagonal structures to analyze the stress concentration impacts of different structures.
Considering the central symmetry characteristics of IBS, as well as the load and constraint conditions, and ensuring the accuracy of the calculation results, the number of meshes is minimized to ensure calculation accuracy and efficiency. One edge of the buffering structure model is selected for analysis. Using the partition meshing method, the cell model is divided into different regions according to the accuracy requirements of the calculation results. Finer meshes are applied to critical areas prone to stress concentration, while relatively sparse meshes are used in areas away from critical areas to improve computational efficiency.
In summary, the mesh size in non-critical areas is set to 0.2mm, and the mesh in critical areas is appropriately refined to four times the size of non-critical areas (0.05 mm). The transition ratio of the mesh is set to 1:1.2. The final mesh division of the model is shown in Figure 4.
Figure 4. Finite element mesh model of buffer structure.
The penetration process of the projectile can be divided into the pit opening stage, the tunneling stage, and the target back collapse stage (exit stage). To explore the stress concentration impacts of different buffering structures at various stages of the penetration process, different overload values are applied. First, the stress situation of the buffering structure under the condition of 20000 g projectile penetration overload is analyzed, at which point the fuze is in the pit opening stage. Using the pre-compression node height h as a reference baseline, the stress-node curve is obtained as shown in Figure 5.
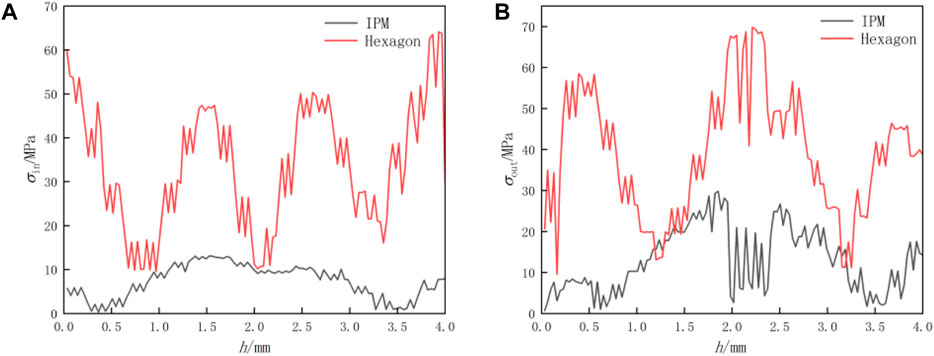
Figure 5. Stress distribution on inclined surface under 20000 g overload. (A) Inner wall of cell. (B) Outer wall of cell.
Figure 5 shows the stress-node curves of different cell structures under 20000 g overload. The red solid line represents the traditional concave hexagonal structure, while the black solid line represents IBS. On the inner wall of the cell, the protective performance of IBS is significantly better, with stress values at each node lower than those of the traditional structure. The peak stress is 13.09MPa, occurring in the middle section, with slight oscillations in stress values stabilizing at around 10 MPa. For the traditional structure, the peak stress is 64.17MPa, occurring at the contact position between the inclined surface and the upper beam. Stress values are smaller in the middle section but exhibit greater oscillations. On the outer wall of the cell, the stress values at each node of IBS are generally lower than those of the traditional structure, except at 1.2mm and 3.2 mm where they exceed. The peak stress is 29.79MPa, occurring in the middle section, with larger oscillations compared to the inner wall. For the traditional structure, the peak stress is 69.83MPa, occurring in the middle section. The stress concentration impact is significant at the contact position between the support frame and the inclined surface, leading to considerable stress oscillations, which could have adverse impacts on the energy absorption of the penetration fuze buffering structure.
The stress situation of the buffering structure under the condition of 35000 g projectile penetration overload is analyzed, at which point the fuze enters the tunneling stage, generating the stress-node curve as shown in Figure 6.
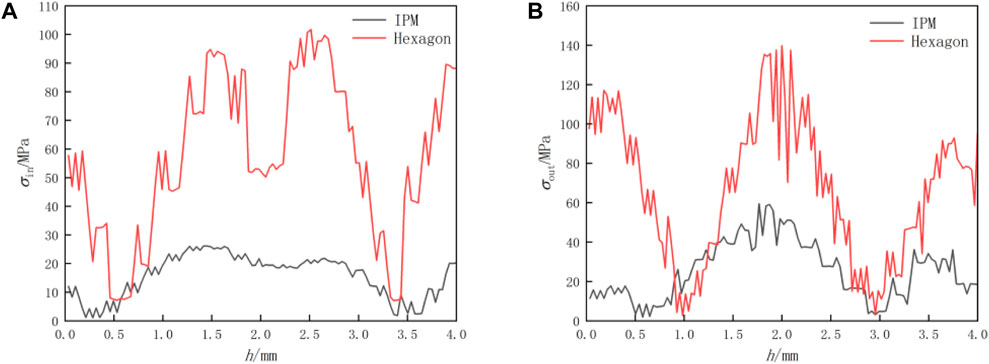
Figure 6. Stress distribution on inclined surface under 35000 g overload. (A) Inner wall of cell. (B) Outer wall of cell.
From the graph, it can be seen that under an overload of 35000g, On the inner wall of the cell, the degree of stress concentration in IBS is significantly lower than that in the traditional structure, with a peak stress of 26.14 MPa occurring below the support frame position, and stress values oscillating around 20 MPa. For the traditional structure, the peak stress is 101.73MPa, occurring above the support frame position, with smaller stress at non-contact areas but larger stress oscillations. On the outer wall of the cell, the degree of stress concentration in IBS is still lower than that in the traditional structure, with a peak stress of 59.49 MPa occurring in the middle section, and stress values oscillating more than on the inner wall of the cell. For the traditional structure, the peak stress is 139.66MPa, occurring in the middle section, with significant stress concentration at the corner of the straight edge, leading to larger stress oscillations.
The stress situation of the buffering structure under the condition of 50000 g projectile penetration overload is analyzed, at which point the fuze reaches its overload peak, generating the stress-node curve as shown in Figure 7.
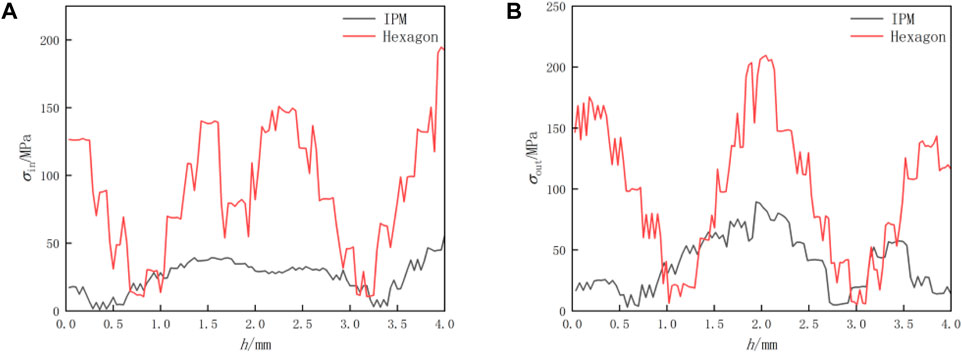
Figure 7. Stress distribution on inclined surface under 50000 g overload. (A) Inner wall of cell. (B) Outer wall of cell.
From the graph, it can be seen that under an overload of 50000g, On the inner wall of the cell, the stress distribution in IBS is uniform, and the degree of stress concentration is lower than that in the traditional structure, with a peak stress of 55.63 MPa occurring at the contact position between the curved edge and the upper beam, and stress values oscillating around 40 MPa. For the traditional structure, the peak stress is 194.63MPa, occurring at the contact position between the curved edge and the upper beam, with smaller stress at non-contact areas but larger stress oscillations. On the outer wall of the cell, the degree of stress concentration in IBS is still lower than that in the traditional structure, with a peak stress of 89.37 MPa occurring in the middle section, and stress values oscillating more significantly. For the traditional structure, the peak stress is 209.49MPa, occurring in the middle section, with significant stress concentration at the corner of the straight edge.
Overall, during various stages of the penetration process, the degree of stress concentration in the traditional structure is greater than that in IBS, indicating that IBS provides better buffering protection for the fuze. This is because of the presence of initial curvature, which makes bending the predominant mode of deformation in IBS, resulting in an increase in the equivalent modulus of the honeycomb structure. In general, the energy absorption of specialized energy absorption structures refers to the plastic energy dissipated under compression loads. Both structures undergo consistent impact loads and plastic deformation. IBS has a higher elastic modulus; therefore, it can absorb more kinetic energy during the penetration process.
From the finite element simulation results, under the same penetration conditions, IBS can better eliminate stress concentration compared to the traditional concave hexagonal structure. Additionally, during the penetration process, the microstructural geometric parameters of the cell will also affect the stress concentration impact. Based on the calculated results of the developed IBS finite element model, stress concentration in IBS mainly occurs at the center of the curved edge. Therefore, the impact of cell geometric parameters on the distribution of SCF at the midpoint of the curved edge is studied. Figure 8 illustrates the peak stress of IBS with different wall thicknesses under various penetration overloads.
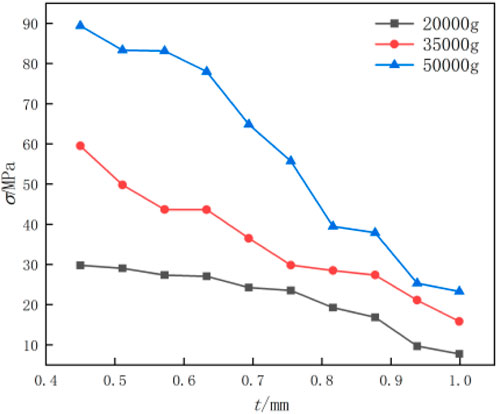
Figure 8. Relationship between peak stress and wall thickness.
The impact of wall thickness on peak stress is significant, as depicted in Figure 8. For the same penetration overload, the peak stress decreases with the increase of wall thickness. For cells with the same wall thickness, the peak stress increases with the increase in penetration overload, and cells with smaller wall thickness exhibit a more pronounced response to overload. According to the material properties of metal and the national standard GB/T 3190-2018, combined with the evaluation equation for stress concentration degree, SCF at the center of the curved edge for different wall thicknesses under each condition is calculated, as shown in Table 1. SCF at the center of the curved edge decreases with increasing wall thickness. When the wall thickness reaches 1mm, the minimum SCF at an overload of 50000 g is 1.004.
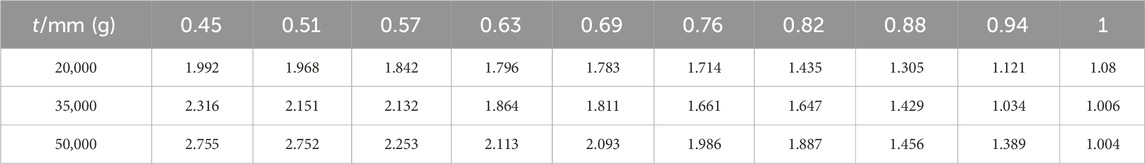
Table 1. Curved center SCFs for different wall thicknesses.
Figure 9 presents the peak stress of IBS with different side lengths under various penetration overloads. The impact of side length on peak stress is minimal, almost negligible, for the same penetration overload. For cells with the same side length, the peak stress increases with the increase in penetration overload. SCF at the center of the curved edge for different side lengths under each condition is calculated, as shown in Table 2. As the side length increases, SCF at the center of the curved edge slightly increases. However, this change has almost no impact on the stress concentration impact. When the side length reaches 7.8mm, the maximum SCF under an overload of 50000 g is 2.854.
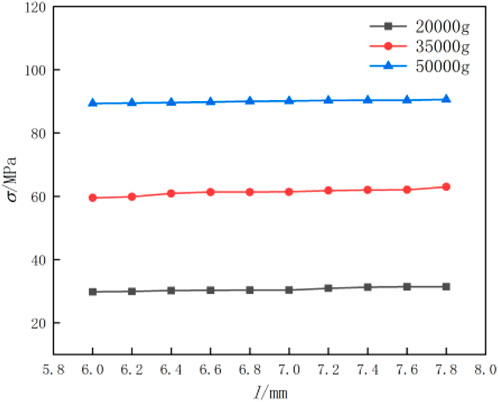
Figure 9. Relationship between peak stress and side length.
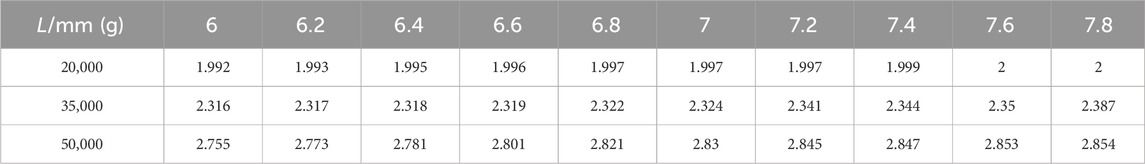
Table 2. Curved center SCFs for different side lengths.
In addition to wall thickness and side length, curvature also has a significant impact on stress concentration impacts. Figure 10 illustrates the peak stress of IBS with different curvatures under various penetration overloads. The impact of curvature on peak stress is significant. For the same penetration overload, the peak stress increases with the increase of curvature. For cells with the same curvature, the peak stress increases with the increase in penetration overload. Furthermore, cells with larger curvature exhibit a more pronounced response to overload. SCF at the center of the curved edge for different curvatures under each condition is calculated, as shown in Table 3. SCF at the center of the curved edge increases with the increase in curvature. When the curvature reaches 2.4, the maximum SCF under an overload of 50000 g is 3.907.
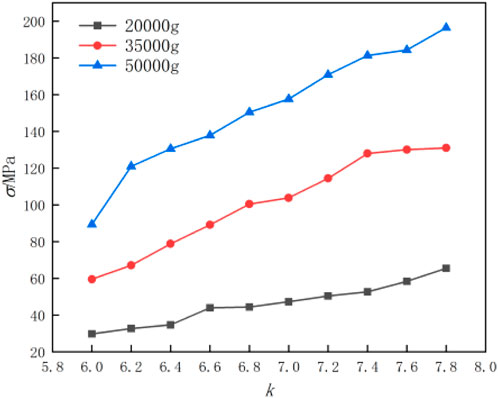
Figure 10. Relationship between peak stress and curvature.
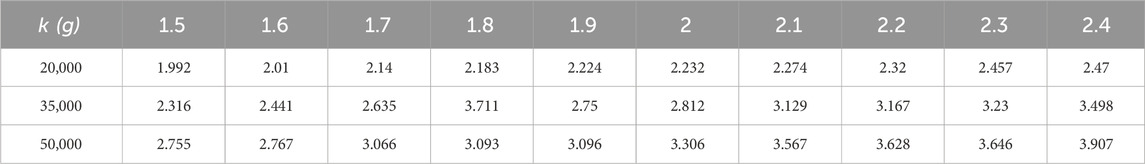
Table 3. Curved center SCFs for different curvatures.
In the reliability assessment of penetration fuze buffer structures, to address the inefficiency of calculating SCF for each node individually, this study develops a fitting equation for SCF with cell geometric parameters to predict SCF under different cell structures. Under the premise of meeting the engineering design error requirements, only an approximate value of SCF is needed. Therefore, based on the aforementioned SCF calculation results, a nonlinear fitting method is used to establish a fitting function for SCF at the center of the curved edge of IBS during the penetration process. The sinusoidal fitting function model of SCF at the center of the curved edge of IBS under an overload of 20000 g with respect to wall thickness is as Eq. 5.1:
where SCF(t) represents the data to be fitted; y1 is the initial phase; tc1 is the fitting interval length; A1 is the amplitude; and w1 is the sampling frequency. According to the principle of least squares, the above equation can be transformed into Eq. 5.2:
Taking the first partial derivatives with respect to tc1, A1, and w1, the expression can be given as Eq. 5.3:
According to the trigonometric function equation derivation, it can be expressed as Eq. 5.4:
By solving Eq. 5.1, the range of values for y1, tc1, A1, and w1 can be determined, with y1 ranging from −7,219.95 ± 48.88, tc1 ranging from −10.63 ± 37.9, A1 ranging from 7,249 ± 488.34, and w1 ranging from 22.17 ± 75.62. After adjustment, the fitting goodness is 0.97778. Gaussian fitting function model for SCF at the center of the curved edge of IBS under an overload of 35000 g with respect to wall thickness is as Eq. 5.5:
where SCF(t) represents the distribution function of stress concentration coefficient with respect to wall thickness; y2 is the initial deviation; tc2 is the fitting interval length; A2 is the loss factor; and w2 is the normalized frequency. The purpose of this step is to predict the trend of the curve. Taking the logarithmic transformation of both sides of Gaussian curve, it can be expressed as Eq. 5.6:
The model in the above equation resembles a parabolic equation y = at 2 + bt + c with respect to t. Therefore, by solving for the fitting parabolic coefficients, the expression for the Gaussian curve function can be determined. Using the principle of least squares, the parameters ai, bi, and ci are obtained to minimize the sum of squared errors (S) is Eq. 5.7:
Taking the first partial derivatives of the above equation and setting them equal to 0, the equation can be given as Eq. 5.8:
where the coefficient is expressed as Eq. 5.9:
It should be noted that the solution to this equation is obtained by taking the logarithm of the original Gaussian curve function, meaning that the predicted values of SCF are logarithmically transformed to satisfy the parabolic equation, and thus, y2 ranges from 268.54 ± 4.16, tc2 ranges from 1.59 ± 3.15, A2 ranges from −268.51 ± 4.16, and w2 ranges from 17.9 ± 139.98. After adjustment, the fitting goodness is 0.96397. The Lorentz fitting function model for SCF at the center of the curved edge of IBS under an overload of 50000 g with respect to wall thickness is determined as Eq. 5.10:
where SCF(t) represents the quadratic polynomial Lorentz fitting function; y3 is the equivalent error; tc3 is the fitting interval length; A3 is Gini coefficient; and w3 is the composite weight. By dividing the wall thickness into n groups from small to large and setting the wall thickness of each group as ti and the corresponding SCF as yi, SCF value of the i th group can be represented as Eq. 5.11:
The fitting error of the ith group SCF can be expressed as Eq. 5.12:
By solving the above equation and plotting the cumulative percentage of wall thickness and the cumulative percentage of error on XOY plane, the follows expression can be given as Eq. 5.13:
The sequences of the abscissa and ordinate of the above points are both monotonically increasing sequences. By fitting the above n+1 points with a smooth curve, Lorentz curve of SCF with respect to wall thickness at the center of the curved edge can be obtained, and thus, y3 ranges from −18.04 ± 19.31, tc3 ranges from 0.49 ± 0.03, A3 ranges from 131.44 ± 57.29, and w3 ranges from 0.79 ± 0.2. After adjustment, the fitting goodness is 0.98085.
According to the analysis of the impact of edge length on SCF, the relationship between SCF at the center of the curved edge and the edge length tends to be linear overall. Therefore, this study adopts a linear function for fitting. The linear function fitting model of SCF at the center of the curved edge of IBS under an overload of 20000 g with respect to edge length is as Eq. 5.14:
where SCF(l) represents the stress concentration coefficient to be fitted; a1 is the slope, with a range of 0.97 ± 0.1; and b1 is the intercept, with a range of 23.9 ± 0.6. After adjustment, the fitting goodness is 0.93139. The linear function fitting model of SCF at the center of the curved edge of IBS under an overload of 35000g with respect to edge length is as Eq. 5.15:
where SCF(l) represents the stress concentration coefficient to be fitted; a2 is the slope, with a range of 1.63 ± 0.19; and b2 is the intercept, with a range of 50 ± 1.29. After adjustment, the fitting goodness is 0.91594. The linear function fitting model of SCF at the center of the curved edge of IBS under an overload of 50000g with respect to edge length is as follows:
Where SCF(l) represents the stress concentration coefficient to be fitted; a3 is the slope, with a range of 0.69 ± 0.04; and b3 is the intercept, with a range of 85.26 ± 0.26. After adjustment, the fitting goodness is 0.97465. The relationship between SCF and edge length is Eq. 5.16:
In Figure 1, under an overload of 20000g, the relationship between SCF at the center of the curved edge of IBS and the curvature tends to rise in an approximately upward-opening parabolic trend. The quadratic function fitting model of the relationship between SCF at the center of the curved edge of IBS and the curvature is as Eq. 5.17:
Selecting n unit nodes (ki, yi), after m iterations, the equation can be expressed as Eq. 5.18:
To determine the coefficients in the above equation, substitute the nodes into the polynomial to obtain the error equation as Eq. 5.19:
Minimizing the sum of squared errors provides as Eq. 5.20:
Taking the first partial derivative of both sides of the equation to determine as Eq. 5.21:
Thus, the solution coefficients can be obtained as Eq. 5.22:
Simultaneous equation (5.17)–(5.21), the quadratic term coefficient a4 for the parabolic fitting equation is in the range of 1.56 ± 2.31, the linear term coefficient b4 is in the range of −2.89 ± 31.95, and the constant term c4 is in the range of −8.66 ± 1.1. After adjustment, the fitting goodness is 0.96529. Under an overload of 35000g, the relationship between SCF and curvature approximately follows a logarithmic growth trend. Therefore, a quadratic logarithmic polynomial is used to approximate the curve, and the coefficients of this polynomial equation are determined by logarithmic functions. The logarithmic fitting function model of the relationship between SCF at the center of the curved edge of IBS and the curvature is given as Eq. 5.23:
where kc2, v2, and B2 are constants. Taking the logarithm of both sides of the equation provides as Eq. 5.24:
After straightening n unit nodes, the equation can be expressed as Eq. 5.25:
Therefore, the straightening coefficient N can be calculated as Eq. 5.26:
Substituting the value of N into the original equation, u2 can be solved, which ranges from 96.7 ± 11.72, kc2 ranges from 5.87 ± 0.48, v2 ranges from 0.31 ± 0.6, and B2 ranges from −315.58 ± 55.46. After adjustment, the fitting goodness is 0.97812. In general, increasing the order of the fitting polynomial can effectively improve the fitting accuracy. To accurately predict the relationship between SCF at the center of the curved edge of IBS and the curvature under an overload of 50000g, a cubic polynomial is used to fit the data. The fitting function model is expressed as Eq. 5.27:
where a3, b3, c3, and d3 are parameter values. To ensure that the predicted values are closer to the true calculated data, the sum of squared errors for all reference points needs to be minimized as Eq. 5.28:
Expressed in the form of a cubic polynomial function as Eq. 5.29:
After matrix transformation, it can be expressed as Eq. 5.30:
where a3 ranges from 17.6 ± 10.5; b3 ranges from −378.71 ± 21.73; c3 ranges from 2,750.46 ± 1.5; and d3 ranges from −6,584 ± 36.13. After adjustment, the fitting goodness is 0.98668.
To meet engineering design requirements, it is necessary to verify the accuracy of SCF fitting function predictions. In practical applications of penetrating projectile engineering, project technical specifications require that the error in SCF predictions be within 15%. Therefore, Matlab’s numerical computation and functions can be utilized to solve the error level of SCF fitting in complex engineering problems involving penetrating projectiles, and to visualize the results of the calculations. The ‘assume’ function in Matlab’s Symbolic Math Toolbox is used to specify the properties of the coefficients, and the ‘constraint’ function is used to define the range of coefficient values obtained from the previous solution. Taking the wall thickness t = 0.69, the output SCF prediction error analysis results are shown in Figure 11.
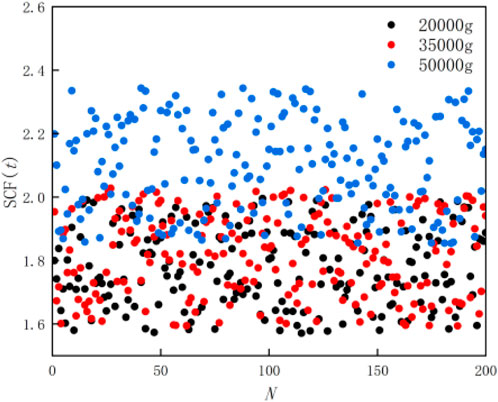
Figure 11. Predicted values of SCF for wall thickness.
In Figure 11, N represents the number of iterations, i.e., the number of samples. The black dots represent the predicted values of SCF at the center of the curved edge under 20000 g overload, the red dots represent the predicted values under 35000 g overload, and the blue dots represent the predicted values under 50000 g overload. As calculated earlier, when the wall thickness t = 0.69, the corresponding SCF values are 1.783, 1.811, and 2.093 respectively. The maximum deviation under 20000 g overload is 1.96, with an error of 9.97%; under 35000 g overload, the maximum deviation is 1.695, with an error of 6.4%; under 50000 g overload, the maximum deviation is 2.493, with an error of 11.94%. By organizing the data, it was found that the prediction error under overload of 35000 g was the smallest, and the SCF prediction values under overload of 20000g and 36000 g were relatively close. This is because there is a non-linear relationship between the maximum deviation and overload during high-speed penetration. As the overload increases, the buffer material approaches the yield limit faster, and plastic collapse energy absorption is more efficient. Taking the edge length l = 6.4, the output SCF prediction error analysis results are shown in Figure 12.
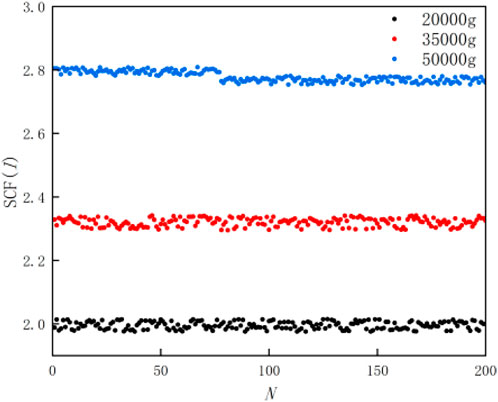
Figure 12. Predicted values of SCF for side length.
As calculated earlier, when the edge length l = 6.4, the corresponding SCF values are 1.995, 2.318, and 2.781 respectively. The maximum deviation under 20000 g overload is 1.975, with an error of 0.98%; under 35000 g overload, the maximum deviation is 2.341, with an error of 0.99%; under 50000 g overload, the maximum deviation is 2.753, with an error of 1.02%. The calculation found that the SCF prediction value about the edge length is the most accurate, because SCF is least affected by the edge length, and stress concentration mainly occurs in the vertical direction of the cell, that is, parallel to the loading direction. Taking the curvature k = 2.2, the output SCF prediction error analysis results are shown in Figure 13.
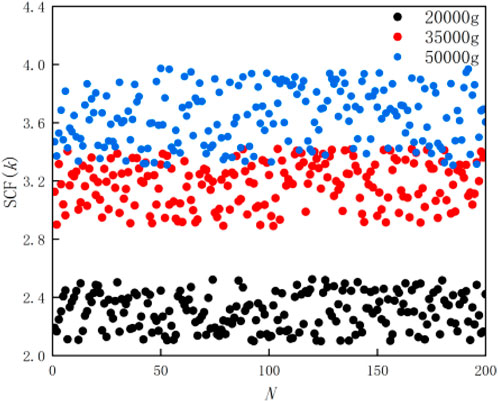
Figure 13. Predicted values of SCF for curvature.
As calculated earlier, when the curvature k = 2.2, the corresponding SCF values are 2.32, 3.167, and 3.628 respectively. The maximum deviation under 20000 g overload is 2.098, with an error of 9.57%; under 35000 g overload, the maximum deviation is 2.885, with an error of 8.89%; under 50000 g overload, the maximum deviation is 3.978, with an error of 9.64%. The prediction errors of SCF for curvature are all less than 10%, with SCF prediction values closer under overload of 35000g and 50000 g. Unlike traditional concave hexagonal honeycomb structures, the deformation of IBS is dominated by bending due to the presence of initial curvature, which can increase the equivalent modulus of honeycomb structures. The predicted results all meet engineering technical specifications. Therefore, the nonlinear fitting curves of SCF proposed in this paper can meet the practical application requirements of penetrating projectile engineering.
To ensure the reliable operation of explosive devices in ultra-high-speed penetration environments, they are typically sealed with materials such as epoxy resin and polyurethane to enhance their impact resistance. However, during the sealing process, defects such as bubbles and cracks may occur due to poor colloidal flow or insufficient mixing. These defects can lead to dynamic stress concentration under stress wave action, causing uneven stress distribution in the sealed body’s circuit board. Consequently, the electronic components of the explosive device may become detached, and in more severe cases, the circuit board may fracture, resulting in device failure. Therefore, investigating the problem of dynamic stress concentration in sealed materials containing defects is of significant theoretical and engineering importance. The model of stress wave incidence during penetration is illustrated in Figure 14.
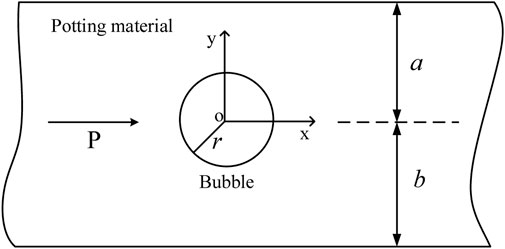
Figure 14. Bubble model of potting material under stress wave action.
Assuming the radius of bubbles in the potting material is r, the primary stress wave during penetration is predominantly longitudinal, with the incident direction along the positive X-axis. Its wave velocity is given as Eq. 6.1:
where λ and μ are Lamé constants; ρ is the density of the potting material; and a and b are the distances from the bubble center to the upper and lower boundaries, respectively. In the theory of elastic wave motion, the expression for the spatial displacement component u of a particle’s motion equation is presented as Eq. 6.2:
The wave propagation equation inside the elastic body can be expressed as Eq. 6.3:
where λm and μm are Lamé constants of the potting material; ∇ is Laplace operator; E is the elastic modulus of the potting material; and v is Poisson’s ratio of the potting material. The stress on the sealed material’s plane transmitted is given as Eq. 6.4:
This study does not consider the displacement situation of the explosive device boundary, which belongs to a stress boundary value problem. It requires solving the unknown coefficients in the displacement expression. The stress boundary conditions can be solved by utilizing the continuity conditions at the interface between the potting material and the explosive device. The boundary condition expression is obtained as Eq. 6.5:
where σx and σy are the radial and tangential stresses of the potting material, respectively. At the internal interface of the potting material, considering the contact surface model between the potting material and the explosive device as ideal contact, the unknown coefficients can be solved by using the interface continuity condition and the stress-free condition on the inner surface of the potting material.
When a stress wave enters a potting material containing bubbles, it encounters scattering due to bubbles, cracks, and indentations, generating new wave sources that spread outwards. Due to the combined action of the explosive device interface and bubbles, there is a significant increase in stress in the local area around the bubbles, leading to the rupture of the explosive device interface and the inner surface of the bubbles. Therefore, DSCF is used to characterize the scattering of stress waves. The form of stress wave scattering is given as Eq. 6.6:
where Cn is an undetermined coefficient, which can be obtained by solving the boundary conditions of the bubble. At this time, the boundary condition is that the stress in the positive X-axis direction is 0. To obtain a steady-state solution, a variable is introduced, defined as Eq. 6.7:
where ω is the oscillation frequency of the stress wave. It can be derived that the wave number of the scattered wave satisfies the equation as Eq. 6.8:
By combining the particle displacement function and the displacement potential function, the general solution of 2D wave equation in the potting material can be obtained as Eq. 6.9:
where G represents the scattering coefficient of the n th bubble. Based on the obtained incident wave field and scattered wave field of the stress wave in the bubble, the total displacement field and total stress field in the potting material can be obtained as Eq. 6.10:
DSCF under stress wave scattering is defined as Eq. 6.11:
The formula for calculating the dynamic stress concentration coefficient in the presence of bubbles is as Eq. 6.12:
In the formula, the numerator represents the stress around the bubble, and the denominator represents the maximum amplitude of stress caused by the incident stress wave.
Based on the theoretical wave function model derived in this paper, taking circular bubbles in the potting material as an example, programming calculations were performed using Matlab. The bubble radius ranges from r = 0.5–0.9mm, the incident angle is α, the density of the potting material for the penetrating detonator ρ is 1119 kg/m3, the elastic modulus E is 3.02 × 10³MPa, the Poisson’s ratio v is 0.37, and the dimensionless wave number Ka = 0.5-3.5. The bubble depth ratio a/h is dimensionless, with parameters k1/k2 = 0.2 and μ1/μ2 = 1.5. The distribution curve of the dimensionless DSCF on the surface of circular bubble cavities under the action of penetrating stress waves is shown in Figure 15.
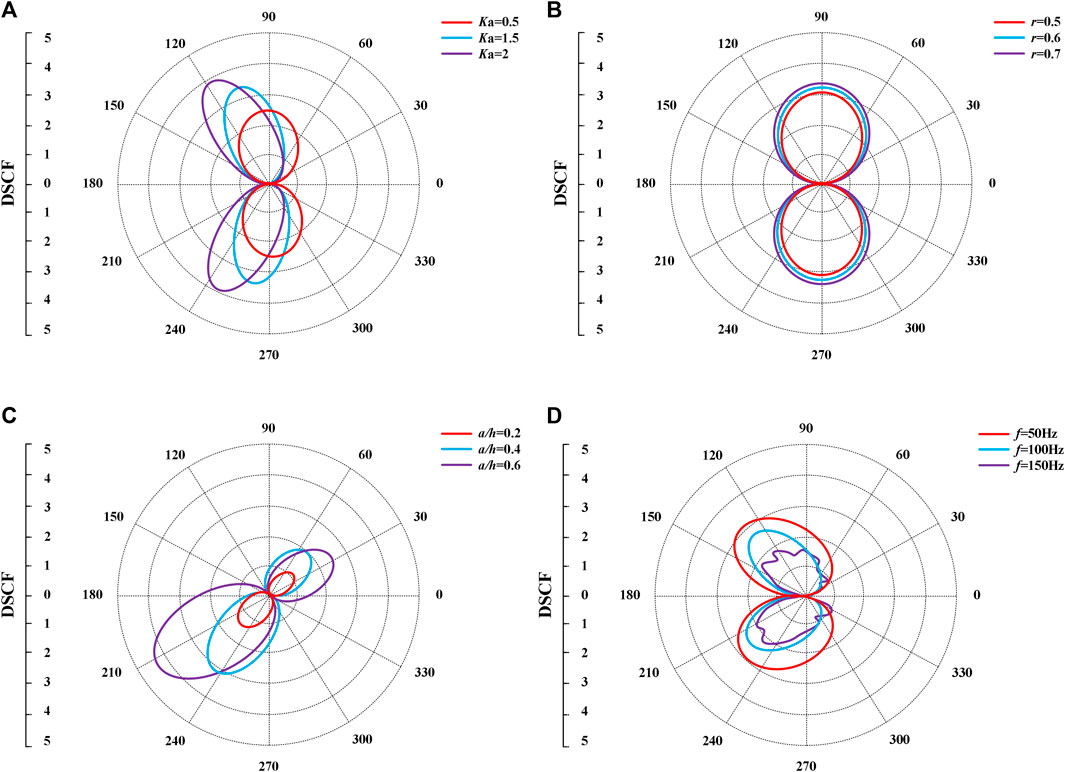
Figure 15. Distribution of DSCF in fuze potting material. (A) Relationship between DSCF and wave number. (B) Relationship between DSCF and radius. (C) Relationship between DSCF and depth. (D) Relationship between DSCF and frequency.
Figure 15A illustrates the variation of DSCF around the bubble with the dimensionless wave number Ka. DSCF is significantly impacted by the wave number. DSCF is symmetrically distributed along the X-axis and increases with the increase of wave number. When Ka = 2, the maximum value of DSCF is 2.91, occurring at positions 118° and 242°.
Figure 15B shows the variation of DSCF around the bubble with the bubble radius r. DSCF does not change significantly with the bubble radius, and stress concentration phenomena mainly occur at the 90° and 270° directions. When the bubble radius is 0.7, the maximum value of DSCF is 3.48.
Figure 15C depicts the variation of DSCF around the bubble with the bubble depth ratio a/h. When the bubble depth ratio is 0.2 and 0.4, the maximum value of DSCF occurs at positions 220° and 230°, respectively, while for a/h = 0.6, the maximum value of DSCF occurs at position 210°. This is due to the increased oscillations near the tail of the projectile when it contacts the top end and the target plate.
Figure 15D presents the variation of DSCF around the bubble with the incident frequency f. The highest DSCF values appear on the side opposite to the projectile impact. As the incident frequency of stress waves increases, the noise in the curve increases, and DSCF gradually decreases. When f = 50Hz, the maximum value of DSCF is 2.22, occurring at 135°.
Based on the above analysis, in the process of structural optimization, attention should be paid to the strength and stability of the projectile tail, and solid materials should be filled around the contact between the projectile tail and the fuze. In addition, exhaust holes should be designed during the sealing process to allow gas to be fully discharged and reduce the presence of bubbles in the sealing material.
This article uses a single impact table (device impact overload>50,000 g, impact pulse width ≥231) μ s) Conduct experimental research on the protective characteristics of penetration fuze buffer materials. When the test projectile launched by the air gun comes into contact with the cutting board, it will generate an instantaneous peak value shock overload, which is transmitted in the form of stress waves from the contact point between the projectile and the cutting board to the interior of the projectile. This is used as the system input shock to excite the test device installed inside the test projectile. The shock table device is shown in Figure 16.
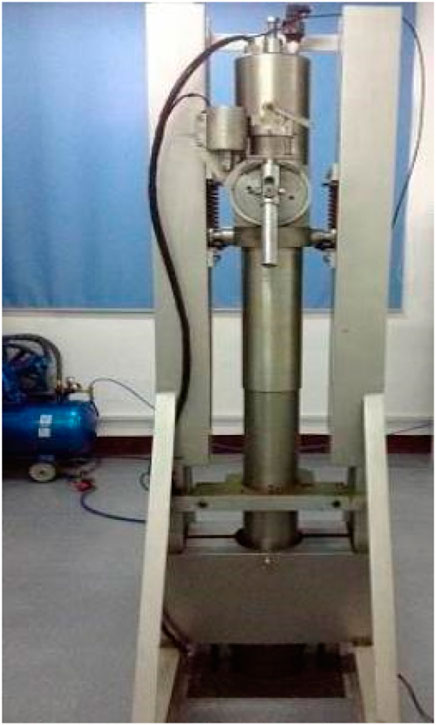
Figure 16. Single impact platform.
Combined with the calculated results from earlier sections, the optimal cell geometry parameters are shown in Table 4. IBS solid materials were manufactured using 3D printing technology, as depicted in Figure 17.
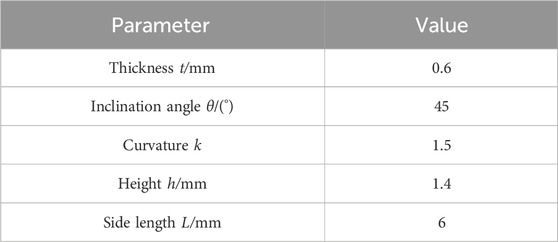
Table 4. Cell geometric parameters.

Figure 17. IBS solid material.
The impact wave-related parameters of the detonator casing, potting material reinforcement layer, and circuit board are shown in Table 5.
Table 5. Material impedance parameters.
The pressure inside the chamber is controlled by the intake volume, thereby controlling the launch speed. The sensitivity of the pressure resistance sensor used in the overload signal recovery device is 0.8 μ V/g, with a magnification of 30 times. Conduct impact tests at different initial velocities, and the measured acceleration overload signal is shown in Figure 18.
Figure 18. Impact signal measured through accelerometer. (A) V0 = 50 m/s. (B) V0 = 70 m/s.
In Figure 18, at an initial velocity of 50 m/s, the peak acceleration overload of the detonator without IBS buffering protection is 38,560g, while with IBS protection, the overload peak is 23,360g, resulting in a reduction rate of 39.42%. At an initial velocity of 70 m/s, the overload peak without IBS is 51,668g, while with IBS protection, the overload peak is 34,685g, resulting in a reduction rate of 32.87%. This reduction is attributed to the fact that when the stress wave reaches the interface between the base and the buffering structure, the plastic collapse of the buffering structure absorbs a large amount of kinetic energy from the detonator, resulting in a decrease in overload peak. The high wave impedance of the detonator potting material causes the transmitted wave to be weaker than the incident wave, thereby attenuating the stress wave and protecting the internal electronic components of the detonator, allowing them to record experimental data intact. Reference [11] used a conventional rubber buffer gasket with an overload peak of 470,000 g under the same working condition, and the combined buffer scheme in this paper reduced the maximum overload by 12315 g compared to it. The experimental data indicate that the combined buffering protection impact of IBS and potting material is significant. The effectiveness and scalability of this method have been demonstrated, and the missile storage system has survived well with normal data recovery. It can be correctly recorded and read back, meeting the design requirements of fast response, high tracking accuracy, and good stability of the fuze control system. It can be used as a buffer protection for fuze in typical penetration environments, high overload, and strong impact. The dynamic impact test further verifies the engineering applicability of this method.
This study calculated the basic mechanical properties of IBS, elucidated the energy absorption mechanism of IBS penetration process, and developed a theoretical mechanical model for in-plane uniaxial loading. Through finite element analysis, a comparison was made between IBS and traditional concave hexagonal structures, and the stress distribution in key areas of both was analyzed. SCFs of IBS curved edges under different penetration overloads were calculated, and the impact of geometric parameters such as cell wall thickness, aspect ratio, and curvature on SCF was further analyzed. A nonlinear fitting function for SCF was established, and a method for predicting SCF at peak stress locations in IBS was proposed, with the accuracy of SCF fitting function predictions being validated. To more precisely explain the phenomenon of stress wave propagation and scattering, and to accurately determine the location of dynamic stress concentration in the potting material, numerical results of DSCF around the bubbles under different physical parameters were provided. Finally, dynamic impact testing was conducted on the combined buffering protection scheme. The main conclusions are outlined as follows:
1) Throughout the stages of the penetration process, the degree of stress concentration in traditional structures is greater than that in IBS, indicating that IBS provides better buffering protection for fuze.
2) In the context of the same penetration overload, the peak stress decreases with the increase of wall thickness. For cells with the same wall thickness, as the penetration overload increases, the peak stress also increases. Additionally, cells with smaller wall thickness show a more pronounced response to overload. The impact of side length on peak stress is negligible. The peak stress increases with the increase of curvature. Cells with larger curvature exhibit a more pronounced response to overload.
3) DSCF around the bubbles in the potting material is significantly impacted by the dimensionless wave number, showing symmetrical distribution along the X-axis and increases with the increase of wave number. The change in DSCF with bubble radius (r) is not significant. With increasing bubble depth, DSCF also increases, emphasizing the importance of the strength and stability of the projectile tail section. Low-frequency stress wave incidence has a more severe impact on bubble DSCF.
4) The overload peak attenuation rates are 39.42% at an initial velocity of 50 m/s and 32.87% at an initial velocity of 70 m/s. IBS effectively protects the internal electronic components of fuze, demonstrating significant buffering protection effectiveness.
With the strengthening of future construction projects, fuze will face more severe tests. Future fuze buffer materials should have the characteristics of lightweight, higher specific energy absorption, better filtering performance, easy processing, easy installation, and high forming accuracy.
The original contributions presented in the study are included in the article/supplementary material, further inquiries can be directed to the corresponding author.
AZ: Data curation, Visualization, Writing–original draft, Writing–review and editing. PL: Methodology, Software, Writing–review and editing. HZ: Funding acquisition, Project administration, Supervision, Writing–review and editing.
The author(s) declare that financial support was received for the research, authorship, and/or publication of this article. This study has received support from the National Natural Science Foundation of China, with the Project No. 61403201.
The authors declare that the research was conducted in the absence of any commercial or financial relationships that could be construed as a potential conflict of interest.
All claims expressed in this article are solely those of the authors and do not necessarily represent those of their affiliated organizations, or those of the publisher, the editors and the reviewers. Any product that may be evaluated in this article, or claim that may be made by its manufacturer, is not guaranteed or endorsed by the publisher.
1. Ding C, Chen B, Li WA, Gao D, Chen Y, Feng J. A numerical study on projectile penetration into underwater Torpedo warhead. J Phys Conf Ser (2023) 2478:072043. doi:10.1088/1742-6596/2478/7/072043
2. Li XL, Zhao EL, Liu ZT, Liu Y, Feng X, Gu Z. Experimental study on multiple propagation characteristics of stress wave and surface displacement behavior in coal based on SHPB and DIC. Bull Eng Geology Environ (2023) 82:246. doi:10.1007/s10064-023-03272-7
3. Ma HR, Sun H, Li CS, Penetration overload prediction method based on a deep neural network with multiple inputs. Appl Sciences-Basel (2023) 13:2351. doi:10.3390/app13042351
4. Mei L, Song XM, Wang WB. Study on the dimensionless model of high-speed penetration efficiency. Appl Mech Mater (2015) 789:362–7. doi:10.4028/www.scientific.net/AMM.789-790.362
5. Poonam , Malik S, Antil A, Kumar K, Nautiyal RC. Impact of initial stress on wave propagation in exponentially graded isotropic nonlocal generalized thermoelastic solid medium. Mech Sol (2023) 58(3):939–60. doi:10.3103/s0025654423600320
6. Surana KS, Abboud E. Deviatoric stress waves due to rheology in incompressible thermoviscoelastic solid medium with small strain, small deformation physics. Meccanica (2023) 58(4):755–79. doi:10.1007/s11012-023-01646-5
7. Xiao Y, Li C, Miao C. Analysis of overload response characteristics of high-speed penetration of composite heterogeneous warhead. Proc SPIE (2023). doi:10.1117/12.2680731
8. Zhang H, Niu S, Analysis the influence of projectile penetration velocity and length - diameter ratio on fuze overload signal adhesion. J Phys Conf Ser (2023) 2478:072035. doi:10.1088/1742-6596/2478/7/072035
9. Zhang JS, Wang Y, Wu JP, Zhou J, Wang W, Liu S, et al. STF-filled biomimetic variable stiffness hierarchic porous material with impact resistance, thermal insulation, and sensing. Chem Eng J (2023) 477:146939. doi:10.1016/j.cej.2023.146939
10. Li GW, Tan LC, Ren LQ, Zheng A, Li Y, He Z, et al. Biomimetic 4D printing of dome-shaped dynamic mechanical metamaterials. J Mater Res Tech (2023) 24:4047–59. doi:10.1016/j.jmrt.2023.04.039
Keywords: stress wave, fuze, stress concentration, wave function, dynamic impact
Citation: Zhang A, Liu P and Zhang H (2024) Analysis and experiment of stress concentration in penetration fuze buffer materials under stress wave incursion. Front. Phys. 12:1401538. doi: 10.3389/fphy.2024.1401538
Received: 15 March 2024; Accepted: 13 May 2024;
Published: 14 June 2024.
Edited by:
Yilin Qu, Northwestern Polytechnical University, ChinaCopyright © 2024 Zhang, Liu and Zhang. This is an open-access article distributed under the terms of the Creative Commons Attribution License (CC BY). The use, distribution or reproduction in other forums is permitted, provided the original author(s) and the copyright owner(s) are credited and that the original publication in this journal is cited, in accordance with accepted academic practice. No use, distribution or reproduction is permitted which does not comply with these terms.
*Correspondence: Peng Liu, bmp1c3RjYUBuanVzdC5lZHUuY24=
Disclaimer: All claims expressed in this article are solely those of the authors and do not necessarily represent those of their affiliated organizations, or those of the publisher, the editors and the reviewers. Any product that may be evaluated in this article or claim that may be made by its manufacturer is not guaranteed or endorsed by the publisher.
Research integrity at Frontiers
Learn more about the work of our research integrity team to safeguard the quality of each article we publish.