 Jing Huang1†
 Sheng Chen
- 1Department of Neurology, First Hospital, Shanxi Medical University, Taiyuan, China
- 2Chongqing University Central Hospital, Chongqing Emergency Medical Center, Chongqing, China
- 3Department of Neurosurgery, Chongqing University Central Hospital, Chongqing Emergency Medical Center, Chongqing, China
Currently, there is an urgent need for a fast and portable intracerebral hemorrhage (ICH) detection technology for pre-hospital emergency scenarios. Owing to the disproportionately elevated permittivity of blood compared to other brain tissues, Electrical Capacitance Tomography (ECT) offers a viable modality for mapping the spatial distribution of permittivity within the brain, thus facilitating the imaging-based identification of ICH. Currently, ECT is confined to time-differential imaging due to limited sensitivity, and this methodology requires non-hemorrhagic measurements for comparison, data that are frequently inaccessible in clinical contexts. To overcome this limitation, in accordance with the natural bilateral symmetry of the cerebral hemispheres, a symmetrical cancellation scheme is introduced. In this method, electrodes are uniformly arrayed around the cranial periphery and strategically positioned in a symmetrical manner relative to the sagittal suture. Subsequently, the measured capacitances for each electrode pair are subtracted from those of their symmetrical counterparts aligned with the sagittal suture. As a result, this process isolates the capacitance attributable solely to hemorrhagic events within a given hemisphere, permitting the absolute imaging of ICH. To assess the feasibility of this method, simulation and empirical imaging were conducted respectively on a numerical hemorrhage model and three physical models (a water-wrapped hemorrhage model, an isolated porcine fat-wrapped hemorrhage model, and an isolated porcine brain tissue-wrapped hemorrhage model). Traditional absolute imaging, time-differential imaging and symmetrical cancellation imaging were performed on all models. The results substantiate that the proposed imaging modality is capable of obtaining absolute imaging of ICH. But a mirrored artifact, symmetrical to the site of the actual hemorrhage image appeared in each of the imaging results. This mirror artifact was characterized by identical dimensions and an inverted pixel-value schema, an intrinsic consequence of the symmetrical cancellation imaging algorithm. The real image of hemorrhage can be ascertained through pre-judgment with the symptoms of the patient. Additionally, the quality of this imaging is seriously dependent on the precise alignment between the electrodes and the sagittal suture of the brain; even a minor deviation in symmetry could introduce excessive noises. Thus, the complicated operational procedures remain as challenges for practical application.
Introduction
Spontaneous intracerebral hemorrhage (ICH) constitutes hemorrhage induced by the disruption of blood vessels within the brain parenchyma. It represents the most grave form of acute stroke due to its immediacy, perilous nature, high morbidity, and mortality. Annually, ICH is accountable for approximately 2.8 million fatalities, yielding an incidence rate of 4.1% [1]. According to the 2018 China Stroke Prevention and Treatment Report, the incidence rate of hemorrhagic stroke was 126.34 per 100,000 person-years in China [2]. Optimal postoperative outcomes and survival rates subsequent to ICH could be substantially improved through prompt diagnosis and intervention [3, 4]. Presently, CT and MRI scans constitute the primary modalities for ICH detection. However, considerable temporal lags ensue during patient transit to healthcare facilities, CT examination, and consequent diagnostic revelation, thereby losing the most ideal time for effective treatment. Moreover, these voluminous pieces of equipment are infeasible for pre-hospital emergency care and bedside monitoring. Hence, a portable, cost-effective, non-invasive, and expedient detection technology for ICH is imperatively necessitated.
Innovative methodologies, aimed at diagnosing cerebral pathologies, capitalize on the electrical properties of biological tissues, notably exemplified by Electrical Impedance Tomography (EIT) and Magnetic Induction Tomography (MIT) [5, 6]. Due to the relatively high electrical impedance of the skull, there is a considerable attenuation of the exciting current in EIT. Secondly, EIT requires the connection of electrodes with the scalp, which results in a very large contact impedance. These issues result in low sensitivity of EIT in imaging brain tissues. As for MIT, the induced magnetic field generated in biological tissues exposed to an excitation field is negligible because of the biological tissue’s poor conductivity (0.1–2 S/m). Furthermore, the conductivity of blood is not noticeably different from those of other brain tissues. Because of these two factors, MIT has relatively poor sensitivity for visualizing a brain hemorrhage.
Investigations into the permittivity of cerebral tissues have elucidated that the permittivity of blood markedly supersedes that of other tissues. At a frequency of 1 MHz, the permittivity values for blood, grey matter, and cerebrospinal fluid stand at 3,000, 990, and 108, respectively [7]. Albeit the permittivity across all cerebral tissues diminishes in tandem with frequency, the permittivity indices of blood remain uniformly elevated. Hence, theoretical considerations suggest that imaging based on permittivity distributions is more efficacious than conductivity-based imaging for ICH detection. Electrical Capacitance Tomography (ECT) serves as a technological platform for visualizing permittivity distribution within the object under examine, predicated upon capacitance measurements obtained from a multi-electrode sensor encircling said object—a technique commonly employed in multi-phase flow analyses in the oil sector and fluidized bed measurements in the industry [8, 9]. Previous experimental endeavors have utilized parallel plate capacitors to measure cerebral capacitance change concurrent with hemorrhagic events; results from animal studies showed an increment in cerebral capacitance change with increased volumes of blood infusion [10]. Subsequently, we engineered a 16-channel ECT system, successfully employing it to visualize hemorrhagic phenomena within porcine cerebral tissue ex vivo [11]. These preliminary studies proved the feasibility of detecting the onset of cerebral hemorrhage via capacitance variations in brain tissue. Although the utility of ECT in our last study for in vitro imaging of cerebral hemorrhage, the employed methodology was that of time-differential imaging—subtracting pre-hemorrhagic measurement data from post-hemorrhagic data—which is commonly adopted in most current electrical imaging modalities [12]. Given that baseline, non-hemorrhagic data is unattainable in clinical settings, this approach is restricted to the dynamic monitoring of bleeding, thus lacking the ability for initial ICH diagnosis. To fulfill the unmet need for immediate ICH detection, it is imperative to ascertain the absolute spatial distribution of cerebral hemorrhage, rather than its temporal change, akin to the capabilities of CT and MRI. Owing to the subtle electrical property differentials between cerebral hemorrhage and other biological tissues, coupled with the minuscule volume of cerebral hemorrhage relative to normative cerebral tissues, the weak signal emanating from the hemorrhagic region is subsumed within the electrical noise generated by normal cerebral tissue. Consequently, conventional electrical imaging techniques are incapable of delineating the absolute electrical parameter distributions within the entire cerebral domain, much less those specifically related to cerebral hemorrhage.
The examination of the structural composition of the human brain demonstrates that the left and right hemispheres are substantially symmetrical with respect to the sagittal suture, and the histological distributions within these hemispheres are analogous [13, 14]. Numerous studies indicate that the impedance in the left and right hemispheres of a healthy brain is comparatively homogenous. Empirical evidence from numerous cases reveals that most cerebral hemorrhages (excluding subarachnoid hemorrhages) manifest in a single hemisphere, and localized hemorrhagic events do not perturb the tissue distribution of the contralateral hemisphere in the absence of a midline shift [15, 16]. However, the occurrence of localized bleeding within a hemisphere disrupts the impedance equilibrium between the two hemispheres [17]. In this study, a modified ECT imaging—termed symmetrical cancellation ECT—is proffered, predicated upon the inherent structural characteristics of the human brain. In this paradigm, electrodes strategically arrayed around the cranium are positioned in a symmetrical manner relative to the sagittal suture. Subsequently, the measured capacitance from each electrode pair is subtracted from the reference capacitance of the symmetrical electrode pair adjacent to the sagittal suture, serving as the imaging data. This imaging technique is devised to counteract all capacitance signals emanating from normative brain tissue at symmetrical positions within the left and right hemispheres, isolating only the capacitance signals attributable to hemorrhagic events. In theory, this enables the acquisition of absolute imaging of cerebral hemorrhage [18]. Barry McDermott et al. [19] applied this approach in EIT, arranging the EIT electrodes symmetrically on both hemispheres of the skull and using the voltage differences between symmetrically placed electrodes as imaging data. In their simulations and physical experiments, they achieved absolute imaging of cerebral hemorrhage. The imaging results included not only the hemorrhage image but also a mirrored image with pixel values that were inversely related. Subsequently, they proposed a dual-frequency symmetrical cancellation EIT imaging method to minimize the impact of electrode symmetry errors on the imaging outcomes [20]. These two articles verify the feasibility of this method.
This paper substantiates the feasibility of the proposed method via simulation and empirical imaging exercises. In the simulation experiment, a cerebral hemorrhage model comprising six distinct tissue types was constructed, and cerebral hemorrhage was depicted using both time-differential imaging and symmetrical cancellation imaging. In the experimental phase, three prototypical cerebral hemorrhage models were established: a model of water-encapsulated blood, a model of isolated porcine adipose tissue-encapsulated blood, and a model with isolated porcine cerebral tissue-encapsulated blood. Subsequent imaging utilizing the aforementioned 16-electrode ECT system was conducted on these models, employing absolute imaging, time-differential imaging, and symmetrical cancellation imaging. The resultant imaging outcomes were then comparatively analyzed.
Methods and materials
Symmetrical cancellation ECT method
The typical ECT imaging system is composed of three components: 1) sensor, 2) data acquisition system, and 3) computer for reconstruction. Figure 1 illustrates an ECT sensor equipped with 16 electrodes, denoted by integers 1 to 16. These 16 homogeneous electrodes are uniformly arrayed around the cranium (represented by a sizable white circle at the center). The spherical cranium is partitioned into the left and right hemispheres, and exhibits symmetry about the central sagittal suture (delineated by dashed line AB). A crimson circle is situated in the upper-right quadrant of the right hemisphere to signify hemorrhage. To implement a symmetrical cancellation measurement, it is important that the electrodes dispersed in the left and right hemispheres maintain symmetry relative to the sagittal suture. To satisfy this criterion, one must ensure that the sagittal suture of the skull and the midpoint of a pair of opposing electrodes are collinear. In Figure 1, the sagittal suture is aligned with the midpoint of electrodes 1 and 9; that is, dashed line AB intersects the centers of electrodes 1 and 9 as well as the central imaging region. Consequently, electrodes 2 and 16 are symmetrical, as are electrodes 3 and 15, electrodes 4 and 14, electrodes 5 and 13, electrodes 6 and 12, electrodes 7 and 11, and electrodes 8 and 10. AB additionally serves as the axis of symmetry for the ECT sensor. In a complete measurement protocol within conventional ECT systems, an electrode is successively chosen as the excitation electrode, while the remaining serve as detection electrodes, to obtain the capacitance data between all different electrode pairs. Taking an sixteen-electrode sensor in Figure 1 as an example, capacitance measurements are obtained in the following sequential steps. Initially, a voltage signal is administered to electrode 1, followed by the measurement of electric charges on electrodes 2–16, thereby quantifying the capacitances between electrode 1 and the other 15 electrodes. Subsequently, electrodes 2–15 are activated in a systematic sequence, thus enabling the acquisition of capacitance data for all unique electrode pairs, culminating in a total of 120 independent electrode combinations. With this measurement strategy, the number of independent capacitance measurements is
where N is the number of electrodes. For this particular sensor, N = 16, and 120 independent capacitances can be measured from different electrode pairs.
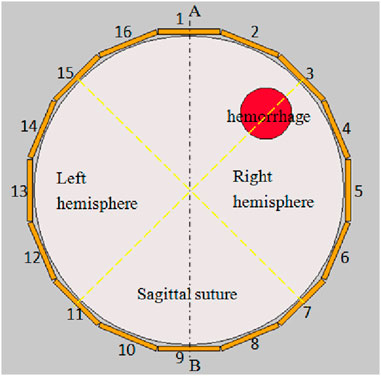
Figure 1. The schematic diagram of ECT Sensor with symmetrical cancellation.
ECT imaging data are typically rendered by subtracting the reference frame data from the substance-field measurements. Various imaging modalities employ different sets of reference frame data. In traditional absolute imaging, the reference data are the measurement data (i.e., the empty field measurement data) when the imaging area is entirely comprised of air. For time-differential imaging, the reference data are derived from pre-hemorrhagic measurements; however, it is impossible to acquire such measurements in a real-world setting. The reference data for each electrode pair in symmetrical cancellation ECT proposed herein utilizes the data of the electrode pair exhibiting axial symmetry, therefore the measurement data and the reference data are all derived from the substance-field measurement data. Ci-j is utilized to denote the capacitance of the electrode pair comprising the excitation electrode i and the measurement electrode j. As depicted in Figure 1, for instance, with electrode 1 serving as the excitation electrode, the reference electrode pair for C1-2 is C1-16, the reference electrode pair for C1-3 is C1-15,
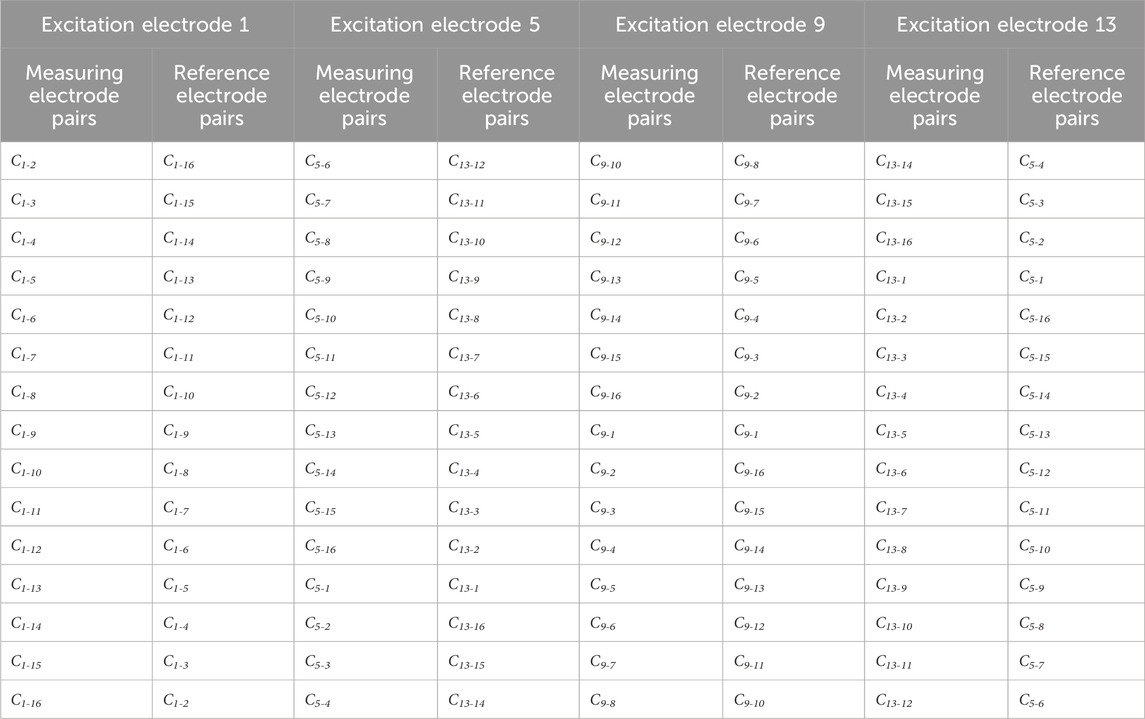
Table 1. All the measuring electrode pairs and their corresponding reference electrode pairs in symmetrical cancellation ECT when electrodes 1, 5, 9, 13 are used as excitation electrodes.
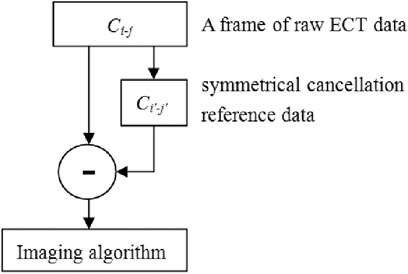
Figure 2. The flow chart of symmetrical cancellation ECT.
Imaging algorithm
The inverse problem within ECT seeks to reconstruct the permittivity distribution within an object based on capacitance measurements. In the case of minor change of permittivity ∆ε, the relationship between the capacitance change ∆C and the change of permittivity ∆ε can be simplified to the following approximated linear equation:
Where, S is the sensitivity matrix, which is the prior information of image reconstruction that maps the permittivity distribution to capacitance change ∆C. Eq. 2 has to be discretized to calculate S and visualize the permittivity distribution. The sensing area is divided into N elements or pixels. The discrete form of Eq. 2 can now be expressed as [21]:
where ∆C is the capacitance vector,
The sensitivity was calculated with the imaging zone under the air domain. The sensitivity of electrode pairs i-j at pixel point P(x, y) is shown in Eq. 4, with (Exi, Eyi) being the x-directional electric field component and the y-directional electric field component at pixel point P when electrode i is used as the excitation. (Exj, Eyj) are the x-directional electric field component and the y-directional electric field component at pixel P when electrode j is used as the excitation. This air domain sensitivity matrix is used for both the simulation imaging and the later actual imaging.
The inverse problem of ECT is to deduce the permittivity distribution ε(x, y) from the measured capacitance vector ∆C. In its discrete form, the objective is to compute the unknown variable g from the known ∆C, employing Eq. 3, wherein S is considered a constant, a priori calculated matrix [22]. The resolution of this inverse problem constitutes the task of image reconstruction. Owing to the fact that the number of pixels N substantially exceeds the number of capacitance measurements M, Eq. 3 is ill-posed, rendering the solution non-unique. Therefore, reconstruction algorithms are imperative for the pursuit of an approximate solution.
In this paper, the Tikhonov regularization method is utilized to address the inverse problem of ECT [21]. The reconstructed distribution of permittivity g is ascertained as Eq. 5:
Where I is the identity regularization matrix, and λ is the regularization parameter which accounts for the degree of smoothness of the reconstructed image. The value was empirically selected and remained constant for the reconstructed images in subsequent sections. In order to overcome the issues of excessive smoothing and loss of information in the conventional Tikhonov regularization method, adaptive regularization methods should be considered in the future, where the regularization parameters are dynamically adjusted according to the characteristics of the data. Additionally, combining various regularization techniques such as Tikhonov regularization and L1 regularization (LASSO) could leverage the strengths of both to enhance the model’s generalization ability and sparsity.
Simulation experiments
The simulation was executed using COMSOL Multiphysics and MATLAB on a computing environment equipped with an Intel Core i7 processor operating at 3.40 GHz. First and foremost, a 16-electrode ECT sensor model, depicted in Figure 3, was constructed in COMSOL, conforming to the dimensions of the actual ECT sensor employed in the subsequent physical experiment. Sixteen homogeneous rectangular electrodes (each possessing a width of 12 mm) were equidistantly positioned around a circle with a diameter of 60 mm. The internal surface of the 16 electrodes is encircled by a circle with a 60 mm diameter, constituting the imaging area. The 16 electrodes were enumerated in a clockwise orientation, with electrode 1 at the apex and electrode 9 at the nadir. For the resolution of the inverse problem, the imaging area is partitioned into a 32 × 32 grid, and the external portion of the circle is excluded, yielding 812 pixels within the imaging area. The sensitivity metrics for each of the 812 pixels were subsequently calculated for each electrode pair and utilized for imaging. Three distinct cerebral hemorrhage models (Figures 3A–C) were formulated for numerical simulation. The red circles in the triad of models serve to simulate hemorrhagic incidents, each with a diameter of 10 mm.
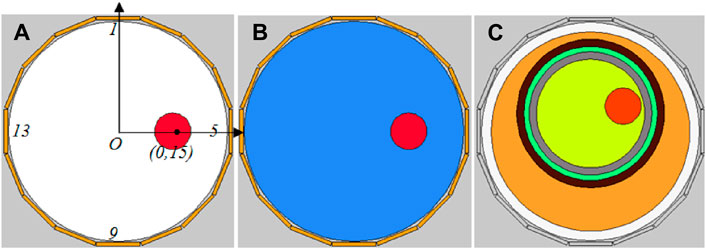
Figure 3. Simulation models of three cerebral hemorrhages. (A) Air-encapsulated cerebral hemorrhage model. (B) Water-encapsulated cerebral hemorrhage model. (C) Complex cerebral hemorrhage model comprising six distinct tissue.
In both Models A and B, the coordinates of the red circle’s center are (0 mm, 15 mm), strategically situated at the midpoint between the imaging area center O and electrode 5. The remainder of the imaging area in Models A and B, exclusive of the red circle, constitutes the background; Model A is denoted by white, and Model B is denoted by blue. Apart from the difference in the permittivity setting for the background, Models A and B are entirely same. The permittivity for each segment of Models A and B is specified in Table 2. The permittivity of the red circle is configured at 3000, equivalent to the permittivity of blood at 1 MHz. The background permittivity for Model A is set at 1, representing air, while the background for Model B is configured at 80, signifying water. Consequently, Model A represents an air-encapsulated cerebral hemorrhage model, and Model B represents a water-encapsulated cerebral hemorrhage model. Model C incorporates a complex cerebral hemorrhage model comprising six distinct tissue types. This model is grounded upon actual brain architecture, yet simplified by segmentation into six layers from the external to the internal, simulating skin (orange), skull (black), cerebrospinal fluid (green), gray matter (gray), white matter (yellow), and blood (red). The outermost layer is air. The relative permittivity of each component in Model C is calibrated to the measured values of human brain tissue, as documented in the literature [7] (Table 3). The small red circle denotes hemorrhaging in the right hemisphere, with central coordinates at (9 mm, 7 mm).

Table 2. The relative permittivity of each part in the models A and B (1 MHz).
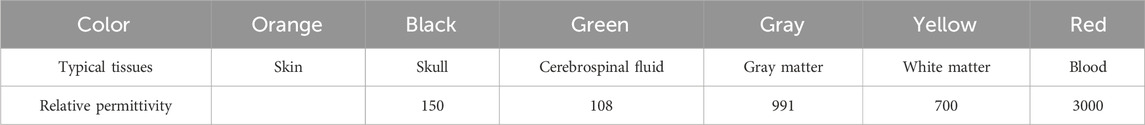
Table 3. The relative permittivity of each part in the ICH model (1 MHz) [7].
For each model, the data computed in accordance with the aforementioned permittivity parameters constitute the substance-field measurement data. This field measurement data is subtracted from the reference frame data to yield the final imaging data. Distinct reference data correspond to different imaging methodologies. For Model A, the reference data is the data obtained when the red sphere is eliminated and the imaging area is uniformly set to air. The substance-field data is subtracted from the reference data for imaging, signifying absolute imaging as the traditional manner. For Model B, traditional absolute imaging, time-differential imaging, and symmetric cancellation imaging are executed respectively. The reference data calculation scenarios for these three imaging methods are as follows: the imaging area is uniformly set to air (permittivity of 1), the imaging area is set to a blue background (permittivity of 80) post-elimination of the red circle, and the unaltered environment is congruent with substance-field measurement environment. For Model C, three modalities of imaging are also undertaken. The reference data calculation scenarios for these three imaging methodologies are as follows: the imaging area is uniformly set to air (permittivity of 1), the red circle is excised to retain other colored segments, and the unaltered environment is consistent with the substance-field measurement environment.
To evaluate the quality of image reconstruction, the relative image error and the correlation coefficient between the true model and reconstructed images serve as assessment criteria. The definition of the relative image error and correlation coefficient is shown in Eqs 6, 7, respectively [22]. The lower the image error and the higher the correlation coefficient mean better image reconstruction outcomes.
where
Physical model experiments
Subsequent to the simulation experiment, the 16-electrode ECT system designed in the preceding stage was utilized to image various physical models of cerebral hemorrhage employing diverse methodologies. The efficacy of various imaging methods was assessed to evaluate the feasibility of symmetric cancellation ECT imaging modalities. The 16-electrode ECT imaging system we employed is depicted in Figure 4. Its design originates from an impedance analyzer and is elaborated upon in the referenced literature [11].
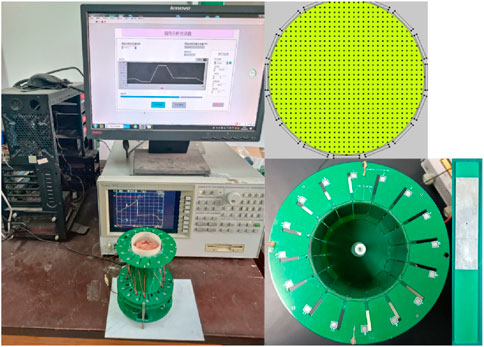
Figure 4. 16-electrode ECT system.
The ECT Sensor comprises sixteen square electrodes, which are uniformly arranged on a circular base with a diameter of 60 mm. A singular electrode is fabricated from a square thin copper film (50 mm * 12 mm) imprinted on a PCB, incorporating a solder pad centrally located for welding electrode leads. The imaging area is a circle with a diameter of 60 mm, centered around the electrode circle and uniformly partitioned into 812 pixel points. The ECT Sensor can provide 16*15/2 = 120 independent capacitance measurements for the inverse calculating of the permittivities for the 812 pixels. An impedance analyzer (4294A, Agilent Technologies) was engaged to measure the capacitances of the electrode pairs. The excitation signal frequency is 1 MHz.
Imaging experiments of water-wrapped blood hemorrhage model
As shown in Figure 5, a 3D-printed cylinder (inner diameter 56 mm, outer diameter 58 mm) is equipped with a thin tube with a diameter of 10 mm. The center of the tube is situated 15 mm from the center of the cylinder. The interior of the tubule was inundated with fresh sheep blood following anticoagulation with heparin sodium, and the exterior of the tubule was inundated with distilled water. The elevation of the water surface is congruent with the elevation of the blood surface; both are 50 mm. Thus, in this model, blood serves as the imaging target, and water functions as the background. The cylinder injected with blood and distilled water is delicately positioned at the center of the ECT sensor and is coaxial with the imaging center. The thin tube filled with blood is aligned along the axis between the center of horizontal electrode 5 and electrode 13. The ECT system depicted in Figure 4 is utilized to measure a frame of data, constituting the substance-field measurement data. Subsequently, the blood in the thin tube is drained, and another frame of data is measured, serving as the reference frame data for the time-differential imaging. All the distilled water is then drained, and the entire interior of the barrel is rendered air-filled; another measurement ensues. The outcome is the reference data for traditional absolute imaging. The reference data for the symmetric cancellation method is extracted from the substance-field measurement data in accordance with the methodology outlined in Figure 2. Subsequently, the substance-field measurement data are subtracted from three disparate reference data for imaging, and the traditional absolute imaging, time-differential imaging, and symmetric cancellation imaging outputs are acquired respectively.
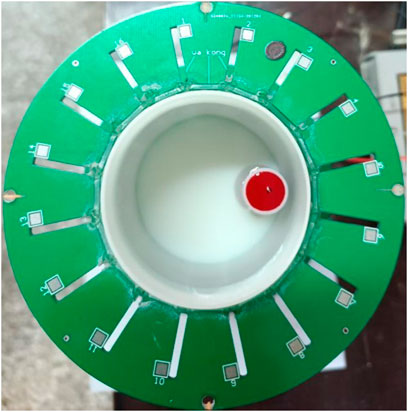
Figure 5. Water-wrapped blood hemorrhage model.
Imaging experiments of fat-wrapped blood hemorrhage model
As shown in Figure 6, a section of fresh porcine adipose tissue was procured from the market and reshaped using a cylindrical blade with an inner diameter of 56 mm. This yielded a cylindrical adipose specimen with a diameter of 56 mm and a height of 50 mm. Subsequently, another cylindrical blade, featuring an inner diameter of 10 mm, was utilized to excavate a cylindrical cavity with a diameter of 10 mm, situated 15 mm from the center of the adipose cylinder. This cavity was then inundated with the aforementioned sheep blood. The adipose cylinder engorged with blood was positioned at the center of the ECT Sensor’s imaging area. Its orientation was adjusted to align the blood-filled cavity along the axis between the centroids of horizontal electrodes 5 and 13. In this model, blood serves as the imaging target while adipose tissue constitutes the background. Initially, the ECT system is engaged to capture a frame of data, constituting the substance-field measurement data. Thereafter, the blood within the adipose cavity is drained, followed by another data frame measurement, which serves as the reference data for time-differential imaging. The adipose samples are then removed, and the interior of the chamber is rendered air-filled; a subsequent measurement is taken. This yields the reference data for traditional absolute imaging. The reference data for the symmetric cancellation method is extracted from the substance-field measurement data. The substance-field measurement data are then subtracted from three distinct reference data sets to generate imaging outputs: traditional absolute imaging, time-differential imaging, and symmetric cancellation imaging of the blood.
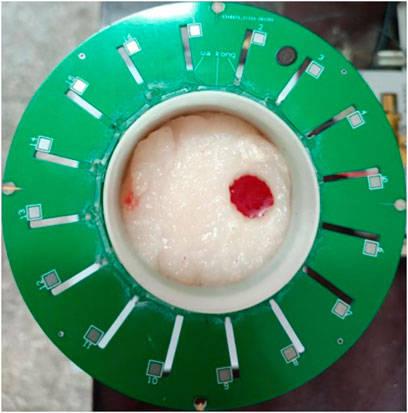
Figure 6. Fat-wrapped blood hemorrhage model.
In vitro pig brain hemorrhage model imaging experiments
As shown in Figure 7, fresh porcine brain tissue is procured from the market and cautiously positioned within a cylinder featuring an inner diameter of 56 mm. It is gently compressed to preserve its anatomical structure, ensuring the symmetry of the left and right hemispheres about the longitudinal cerebral fissure. A syringe with a 10 mm diameter (lacking its tip) is inserted into the right hemisphere, and the syringe’s center is situated approximately 13 mm from the center of the brain tissue. The syringe is then inundated with the aforementioned sheep blood. The cylinder, now filled with cerebral tissue and blood, is positioned at the center of the ECT Sensor’s imaging area. By rotating the cylinder, the longitudinal fissure of the porcine brain is aligned with the axis connecting the centroids of electrodes 1 and 9, while the blood is located along the axis between the centroids of horizontal electrode 5 and 13. This orientation satisfies the requirement for symmetric cancellation imaging. In this model, blood is the imaging target and cerebral tissue serves as the background. Initially, the ECT system is engaged to capture a frame of data, which is the substance-field measurement data. Subsequently, the blood within the syringe is drained, followed by another data frame measurement, constituting the reference data for time-differential imaging. All cerebral tissue is then extracted, and the chamber is rendered air-filled; another measurement ensues. This produces the reference data for traditional absolute imaging. The reference data for the symmetric cancellation method is extracted from the substance-field measurement data. Thereafter, the substance-field measurement data are subtracted from three distinct reference data sets to yield imaging outputs for absolute imaging, time-differential imaging, and symmetric cancellation imaging of the blood.
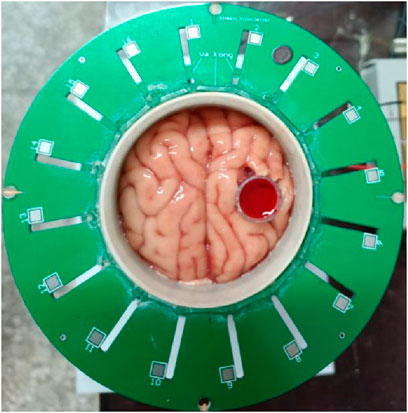
Figure 7. In vitro pig brain wrapped blood hemorrhage model.
Results and discussion
Simulation imaging results
The imaging results corresponding to the three simulation models in Figure 3 are delineated in Figure 8. The first line is the three original models of A, B and C, the second line is the traditional absolute imaging result corresponding to each model, the third line is the time-differential imaging result corresponding to each model, and the fourth line is the symmetrical cancellation imaging outcome corresponding to each model. For the absolute imaging utilizing the traditional method, only the result of Model A clearly delineates the location and dimension of the red blood circle, whereas the results of Model B and C negate the visualization of the blood spheres altogether. Owing to the fact that Model A is elementary and the background consists of air, its traditional absolute imaging is also time-differential imaging. The background of Model B and C is intricate. Particularly in Model C, the blood sphere is encased by quintuple layers of tissue. In this model, the capacitance change attributable to the blood sphere is entirely obscured by the capacitance change induced by the background, thereby corroborating that the traditional absolute imaging is unable to visualize the blood encased with a complex background. The time-differential imaging outcomes of the three models manifestly reflect the location and dimension of the blood spheres. However, the spatial localization of the image of blood of Model B and C exhibits a perceptible deviation relative to their positions in the original models, with both shifting towards the centroid. The white dotted circle in the imaging demarcates the original locale of the blood spheres in the model. This is predominantly attributable to the intricate backdrop. Because the sensitivity matrix S employed for imaging is calculated in the imaging region where the backdrop is a uniform permittivity distribution of air, and the background of Model B and C comprises heterogeneous distributions of varying permittivity. These distributions predominate over the expanse of the imaging area, and collectively converge towards the center of the imaging area; thus, the image of the blood in the imaging result shifts to the central point. Although time-differential imaging can visualize blood encased in intricate backdrops, it is inapplicable for the rapid detection of cerebral hemorrhage in clinical applications. This is predicated on the fact that the reference frame data requisite for time-differential imaging is the measurement devoid of hemorrhage, which can be simulated in computational environments, yet remains unattainable in clinical settings. The symmetrical cancellation imaging results of B and C explicitly demonstrate two symmetrical images of differing chromatic attributes, one pixel value being positive (red) and the other negative (blue). The chromatically red image is in precise correspondence with the position and dimension of the blood sphere in the model, indicating that the chromatically red image is indubitably the image of the blood in the model. Secondly, the pixel value is positive, indicative of an increase in the permittivity relative to the background, which is commensurate with the permittivity of actual blood. This congruence exists because the permittivity of the blood in the model exceeds that of the backdrop. It is justifiable to observe two symmetrical images with one positive and one negative pixel values in the symmetrical cancellation imaging results. This is corroborated by Figure 2, wherein the measurement capacitance of all electrode pairs in the symmetric cancellation mode is subtracted from the measurement capacitance of the electrode pairs symmetrically oriented about the intermediate symmetry axis. The capacitance of the electrode pairs of the hemorrhagic hemisphere is increased due to the presence of bleeding. In this context, the electrode pair capacitance of the hemorrhagic hemisphere subtracted from the electrode pair capacitance of the symmetrical non-hemorrhagic hemisphere constitutes a positive capacitance change. Conversely, the electrode pair capacitance of the same non-hemorrhagic hemisphere subtracted from the electrode pair capacitance of the symmetrical hemorrhagic hemisphere represents a negative capacitance change. The real hemorrhagic image in the outcomes of symmetric cancellation imaging can be prejudged based on the patient’s symptoms. The left and right neural centers of the brain severally govern the contralateral limb activity; thus, left cerebral hemorrhage predominantly induces right limb activity dysfunction, while right cerebral hemorrhage primarily provokes left limb activity dysfunction [23]. Additionally, the language center is localized in the left hemisphere, hence left cerebral hemorrhage can precipitate language dysfunction. The right brain orchestrates spatial imagination capabilities, and patients with right cerebral hemorrhage may manifest spatial imagination disorders. Moreover, experience can be accrued through imaging the cerebral hemorrhage ascertained by CT, thereby serving as a criterion for evaluating the real hemorrhage image in subsequent symmetrical cancellation imaging. A concomitant issue with symmetrical cancellation imaging results exists. The position of the blood image in BC model is likewise misaligned from its original locale in the model. In the figure, the white dotted circle demarcates the original position of the blood in the model. The reason for this result is the same as that of time-differential imaging. Model A did not undergo symmetrical cancellation imaging due to the simple background with air. The image error and correlation coefficient of different imaging results for the three models are shown in Table 4, and the symmetrical cancellation imaging results only consider the right red image.
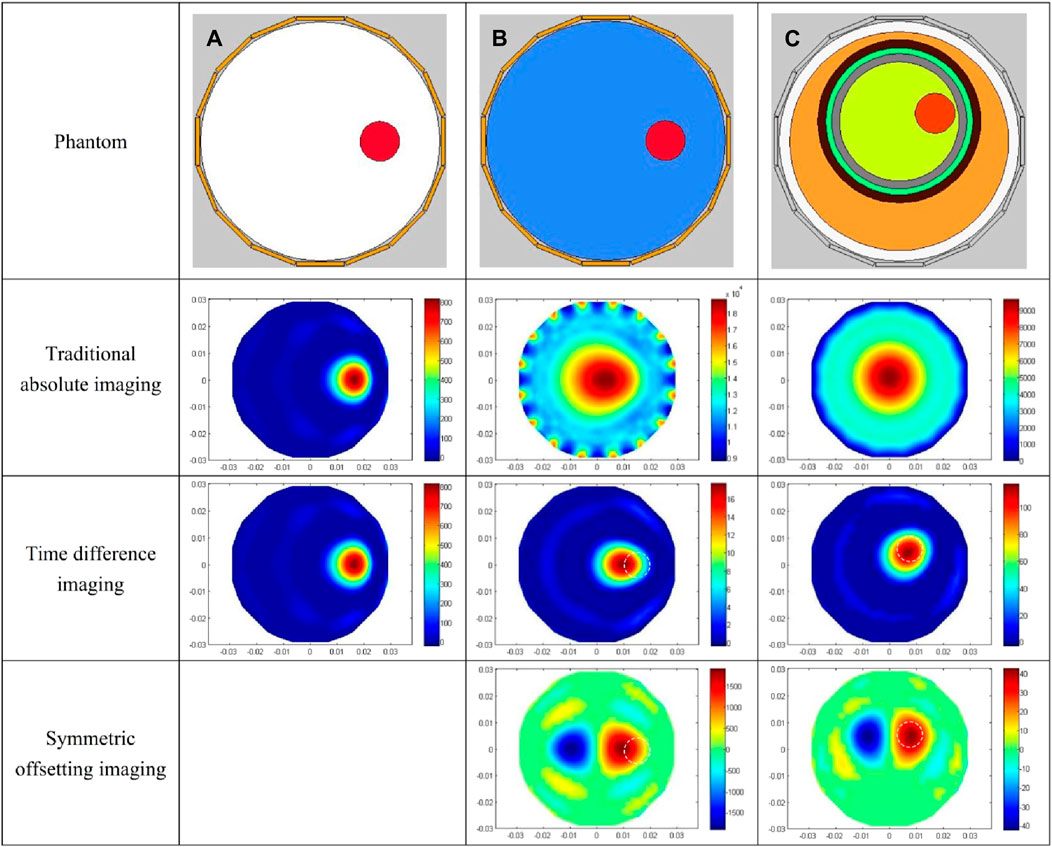
Figure 8. Simulation imaging results of three models. (A) Imaging results of the air-encapsulated cerebral hemorrhage model. (B) Imaging results of the water-encapsulated cerebral hemorrhage model. (C) Imaging results of the complex cerebral hemorrhage model comprising six distinct tissue.
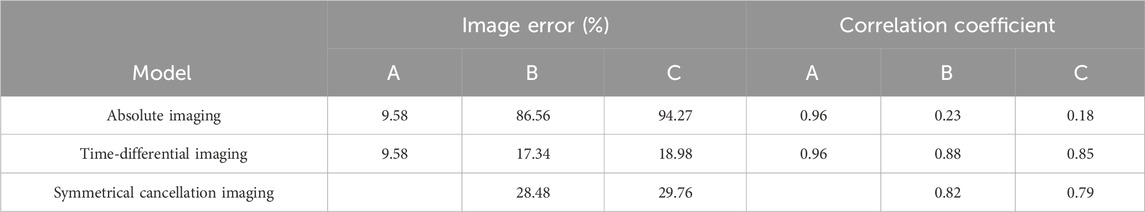
Table 4. Image error (%) and Correlation coefficient for simulation results.
Experimental results of physical model imaging
The results of the water-wrapped hemorrhage model are shown in Figure 9. The first row is the photographs of two original physical model. The blood-filled tubules in a horizontal orientation are proximal to electrode 13 (left) and electrode 5 (right), respectively. The center of the tubules is 15 mm away from the center of the imaging area. The second row displays the absolute imaging results with the traditional method. From the imaging results, the presence of blood cannot be seen at all. This predominantly stems from the fact that the volume of blood accounts for only 1/6 of the volume of the imaging area, which is much smaller than the volume of water. Subsequently, the permittivity of blood processed with heparin sodium is significantly attenuated compared to that of unadulterated blood, albeit marginally surpassing that of water [11]. These two reasons make it difficult for traditional absolute imaging to visualize water- wrapped blood. In the third row, two time-differential imaging images can clearly show the existence of blood, and the position and size of the circular image are basically the same as the position and size of the blood in the actual model, but its position is shifted to the center of the imaging area by about 5 mm. The white dotted circle in the image indicates the position of the actual blood. This phenomenon corroborates the outcome of the time-differential imaging in the simulation of Figure 8, and the reason is the same. The fourth row exhibits the symmetrical cancellation imaging results. Each image clearly shows two circular images of the same shape and size, one red and one blue, and is symmetrical about the axis of symmetry of the ECT Sensor. By analyzing the imaging data, it is found that the pixel values of the two symmetrical images are also complementary; ergo, one is positive, and one is negative. The pixel value of the red image is positive, and the value of the blue image is negative. Since the permittivity of the blood exceeds that of the ambient water, the red circular image represents the image of the actual blood, which also corresponds to the position of the blood in the actual model. Thus, symmetric cancellation imaging can indeed execute absolute imaging of water-wrapped blood without the need for reference data devoid of bleeding, which is not possible with time-differential imaging. Nonetheless, the noise in the symmetrical cancellation imaging result is much larger than the time-differential imaging. In addition to the two blood images of one red and one blue, numerous artifacts reside on the edge. This is predominantly attributable to the position deviation of the bucket in the actual model. Since the external diameter of the bucket is 58 mm and the diameter of the imaging area is 60 mm, there exists a gap of 1 mm between the edge of the bucket and the electrode surface. In practice, it is difficult to guarantee that the center of the bucket completely coincides with the center of the imaging area, thereby engendering a variable gap size between the upper and lower and left and right boundaries of the bucket and the corresponding electrodes. This inconsistency culminates in left and right asymmetry, and the accuracy of symmetry cancellation imaging entirely depends upon the symmetry of the upper and lower and left and right sectors. The higher the symmetry, the better the imaging quality. The asymmetry of the left and right sides of the bucket will engender symmetrical image noise on the left and right edges, and the asymmetry of the upper and lower sides of the bucket will also cause symmetrical image noise on the upper and lower edges. Because the overall volume of the barrel is much larger than the blood, very small asymmetry will cause a large image noise. The position of the blood image in the symmetrical cancellation imaging is also approximately 5 mm away from the center relative to its actual position, which is the same as the result in the simulation, and the reason is the same. The image error and correlation coefficient for the three imaging results of the two models are shown in Table 5. The image error of the time-differential imaging is the smallest, the correlation coefficient is the best, and the second is the symmetrical cancellation imaging. Because the result of absolute imaging is too poor, two imaging quality metrics are not included.
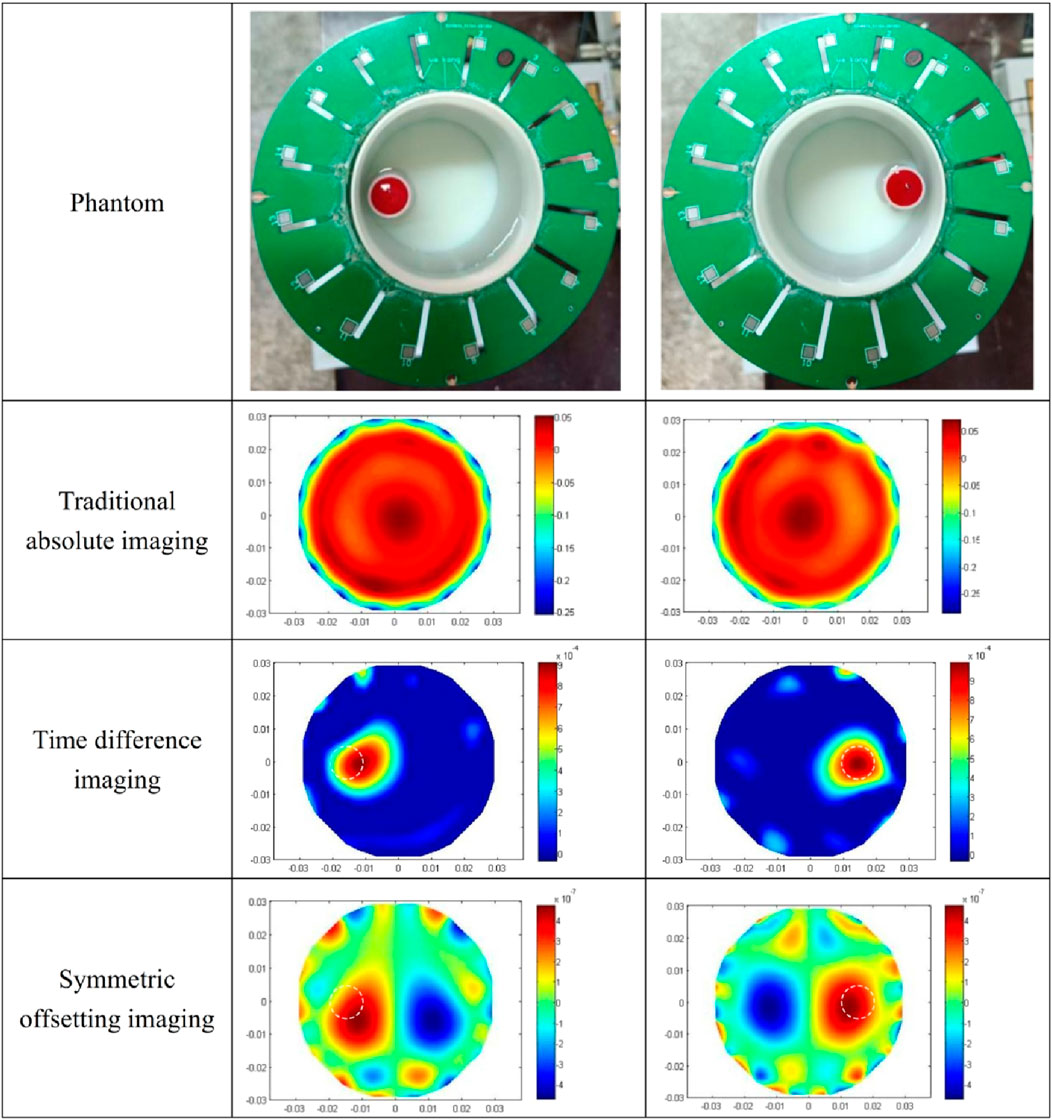
Figure 9. The results of three kinds of imaging methods for two water-wrapped blood models.
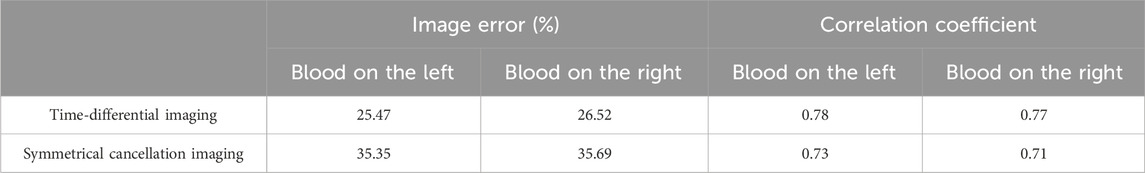
Table 5. Image error (%) and Correlation coefficient for imaging results of two water-wrapped blood models.
The results of the fat-wrapped hemorrhage model are shown in Figure 10. In the two prototypes in the first row, the blood in the horizontal cylindrical cavity is proximate to electrode 13 (left) and electrode 5 (right), respectively, and the center of the blood is 15 mm away from the center of the imaging area. The absolute imaging results of the second row are completely red, and the existence of blood cannot be seen at all, which proves that the absolute imaging with the traditional method cannot image the blood wrapped by fat tissue. The time-differential imaging results of the third row can clearly show the image of the blood. As in the scenario of water-wrapped hemorrhage model, the position of the blood image is shifted to the center by several millimeters relative to its position in the actual model. The white dotted circle in the figure demarcates the actual locus of the blood. In the symmetrical cancellation imaging results of the final row, both images clearly show two images with the same shape and size, one red and one blue color, and is symmetrical about the axis of the ECT Sensor. As in the case of the water-wrapped hemorrhage model, the pixel values of the two symmetrical images are equivalent, albeit with antithetical signs. As the permittivity of the blood is also greater than that of fat, so the positive red image is the actual image of the blood, which also corresponds to the position of the blood. Similarly, the noise in the symmetrical cancellation imaging result is much larger than that of the time-differential imaging, and many small patches appear on the edge. This is mainly due to the inconsistent gap size between the outside surface of the barrel and the electrode array, which is caused by poor symmetry. Secondarily, owing to limited manufacturing precision, the fat structure lacks a standardized cylindrical configuration, and its surface is not entirely planar, which further compromises bilateral symmetry. The position of the blood image deviates by several millimeters toward the center relative to its actual localization. In comparison to the symmetrical cancellation imaging results of the water-wrapped blood model in Figure 9, it is found that the dual symmetrical images of the blood in Figure 10, irrespective of hue, are diminished in intensity. That is, the contrast differential between the pixel values of the blood image and the background is attenuated. This is mainly because the permittivity difference between fat and blood is inferior to that between water and blood, rendering it more challenging to visualize fat-wrapped blood. The image error and correlation coefficient for the three imaging modalities are shown in Table 6. The image error of time-differential imaging is the smallest, the correlation coefficient is the best, followed by symmetrical cancellation imaging. Due to the poor performance in absolute imaging, two quantitative metrics are not included.
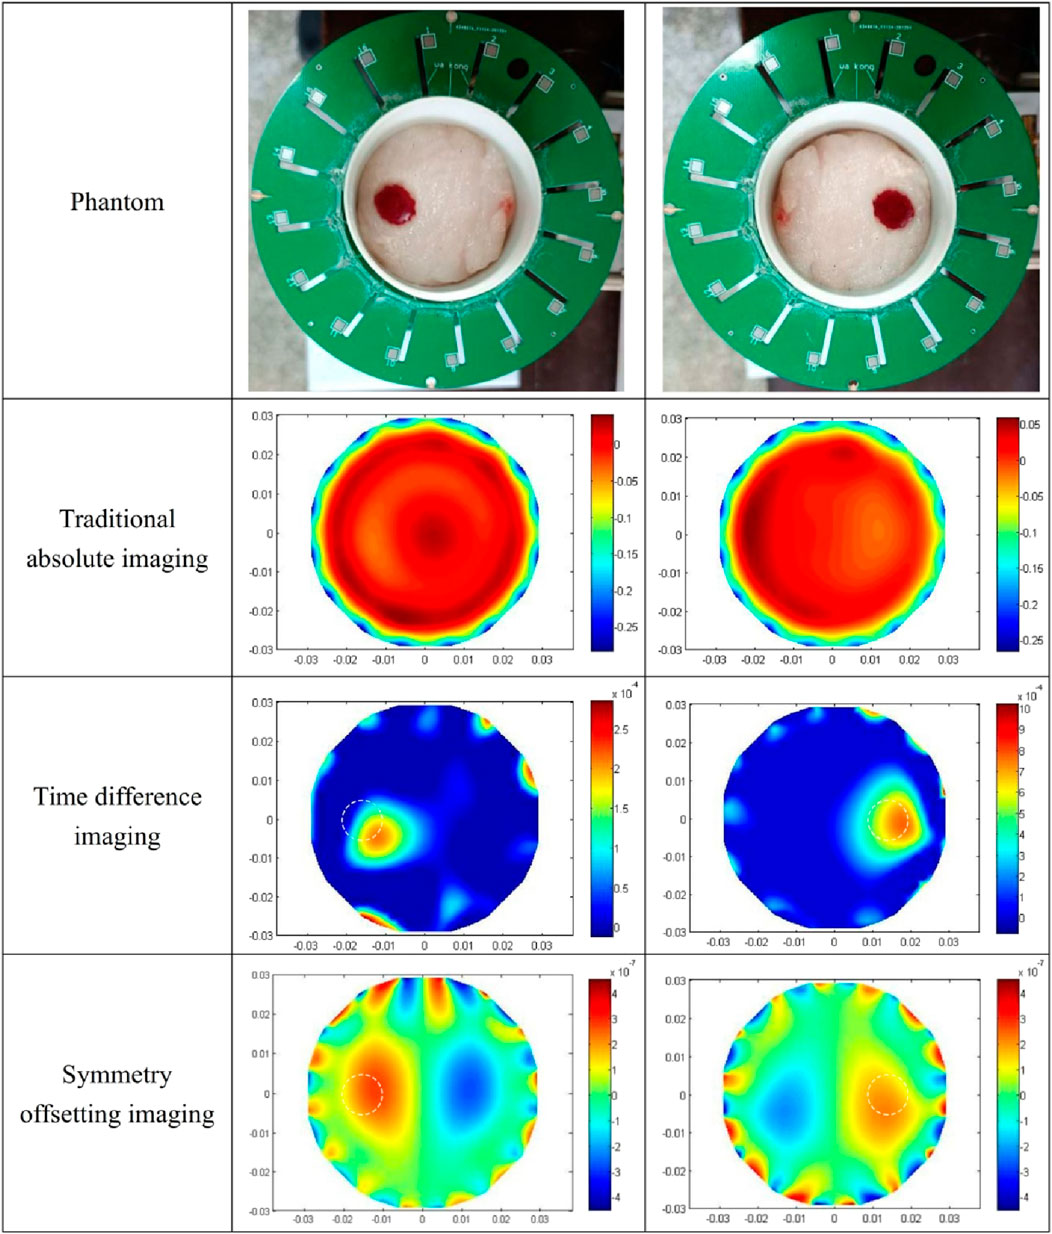
Figure 10. The results of three kinds of imaging methods for two fat-wrapped blood models.
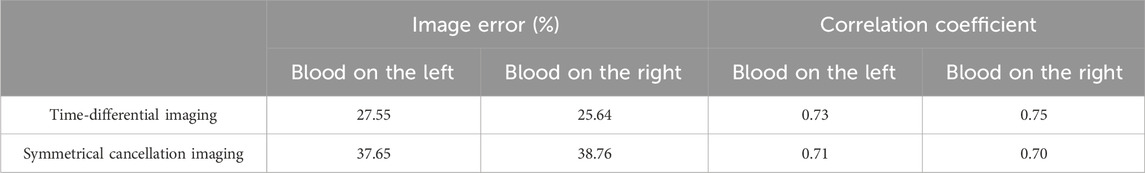
Table 6. Image error (%) and Correlation coefficient for imaging results of two fat-wrapped blood models.
The imaging results of the isolated porcine brain wrapped hemorrhage model are shown in Figure 11. In the two prototypes presented in the first row, the syringes filled with blood in a horizontal orientation are proximate to electrode 13 (left) and electrode 5 (right), respectively, and the center of the syringe is 13 mm from the center of the imaging area. The absolute imaging results with the traditional method of the second row are wholly suffused in red hue, rendering the presence of blood indiscernible. This is the same as the absolute imaging results of the previous two models, which proves that the traditional absolute imaging cannot image the blood wrapped in the porcine brain. The time-differential imaging results of the third line can clearly show the images of the blood in the two models, and the position of the blood image is shifted to the center by several millimeters relative to the position of the blood in the actual model. The white dotted circle in the figure represents the actual locus of the blood. In the symmetrical cancellation imaging results of the final row, both images clearly show two images with the same shape and size, one in a red hue and another in blue, symmetrical about the axis of the ECT Sensor. Consistent with the preceding models, the pixel values of the two symmetrical images are equivalent, albeit with antithetical signs. As the permittivity of the blood is also greater than that of other brain tissues, so the positive red image is the actual image of the blood, which also corresponds to the position of the blood in the actual model. Similarly, the noise in the symmetrical cancellation imaging result is much larger than that in the time-differential imaging, and numerous noises manifest at the periphery of the imaging area. This predominantly emanates from the inconsistent gap size between the outside surface of the barrel and all electrodes due to the asymmetry. Secondarily, due to the inherent pliability of the porcine brain tissue and manual stacking, the resultant structure lacks a standardized cylindrical configuration and bilateral symmetry is compromised. Furthermore, in an attempt to preserve the original morphology of the left and right hemispheres, the surface remains non-planar, thus impacting the symmetry. The size and position of the blood image in the two models in the final row vary, attributed to the relative position discrepancy of the barrel in the two models. The spatial orientation of the blood image deviates minimally toward the center, yet this deviation is less than in previous models. This is attributed to the nearer proximity of the actual syringe center, being only 13 mm from the imaging area’s center. The reason behind this procedural adjustment lies in the intrinsic softness of the porcine brain tissue; positioning the syringe closer to the edge would destroy its overall structural integrity. Analogous to the fat-wrapped blood scenario, the contrast differential between the pixel values of the blood image and the background image is attenuated in Figure 11. This is mainly because the permittivity difference between the porcine brain tissue and blood is inferior to that between water and blood, making it more difficult to visualize porcine brain tissue-wrapped blood. The image error and correlation coefficient of imaging results are shown in Table 7. Similarly, the image error of time-differential imaging is the smallest, the correlation coefficient is the best, followed by symmetrical cancellation imaging. Due to the poor performance in absolute imaging, two quantitative metrics are not included.
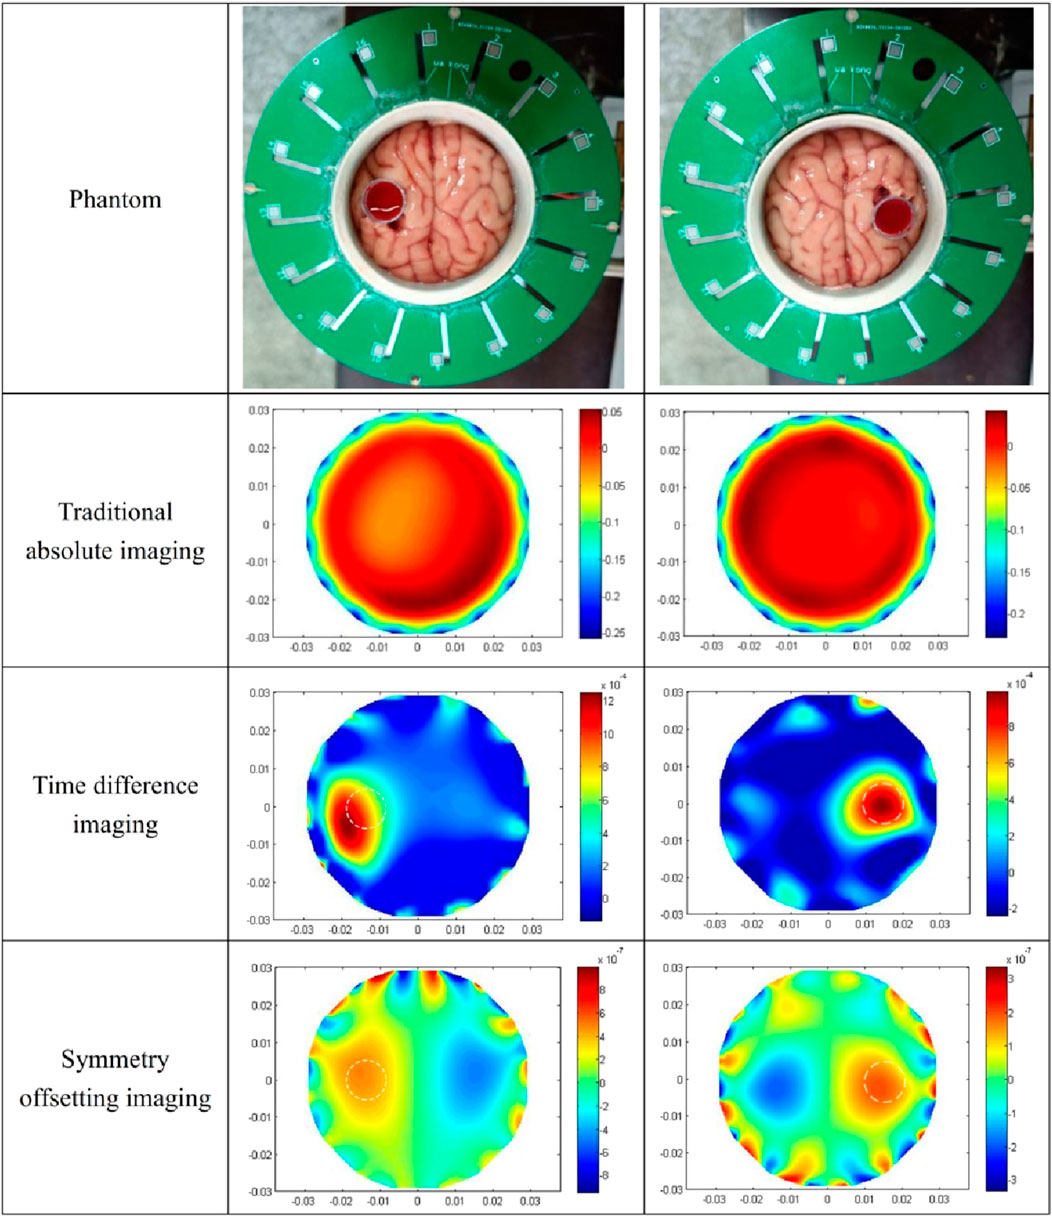
Figure 11. The results of three kinds of imaging methods for two isolated porcine brain wrapped blood models.
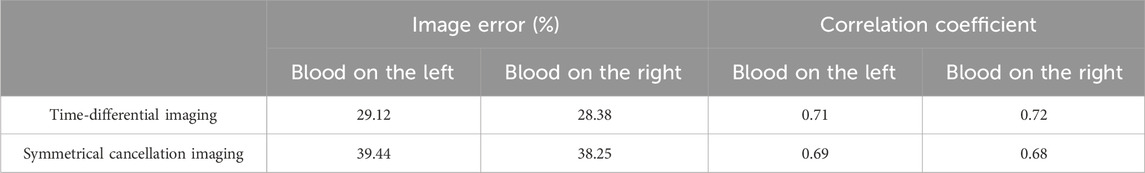
Table 7. Image error (%) and Correlation coefficient for imaging results of two porcine brain wrapped hemorrhage models.
Conclusion
At present, ECT can only image cerebral hemorrhage with time-differential imaging. Time-differential imaging requires measurement data when the patient is not bleeding, but this is difficult to achieve in practice. Therefore, this imaging modality lacks the capability for rapid acquisition of the absolute image information of cerebral hemorrhage, thus rendering it unable for rapid diagnostic applications. To solve this limitation, a symmetrical cancellation ECT Imaging method was proposed, predicated upon the anatomical symmetry between the left and right cerebral hemispheres. This method only needs that the sagittal suture of the examined cranium remain collinear with the central axis (symmetry axis) of a corresponding pair of electrodes in the ECT sensor. Such alignment enables the electrodes on both sides to maintain symmetry about the sagittal suture. Consequently, imaging data is attainable through the subtraction of capacitance measurements from their symmetrical counterparts. The reference data for this novel imaging modality is directly derived from the measurement data after bleeding, thereby eliminating the need for pre-hemorrhage measurement. In order to verify the feasibility of this scheme, simulation and empirical imaging evaluations were conducted across various cerebral hemorrhage models. The findings corroborate that the imaging method can indeed facilitate the absolute imaging of cerebral hemorrhage in the established way. Moreover, the results of this imaging method have a significant feature, that is, an artifact with the same size and shape and the opposite pixel value symbol appears on the opposite side of the actual bleeding image. This is determined by the principle of symmetrical cancellation imaging, no need to worry. Clinically, the hemisphere in which hemorrhage exists can be easily determined through patient’s symptoms. Moreover, the imaging quality is intrinsically dependent upon the anatomical symmetry across the cerebral hemispheres around the electrode’s symmetry axis; superior symmetry yields enhanced imaging quality and diminished noises. Nonetheless, practical applications are encumbered by operational complexities and the imperative for precise cranial alignment. The blood locus within the symmetrical cancellation imaging exhibits a slight deviation from its true coordinates, primarily due to non-homogeneous distribution of the permittivity within the imaging domain. Brain belongs to the non-uniform dielectric distribution, which contains tissues such as gray matter white matter cerebrospinal fluid, and also contains a small amount of residual blood, so it is a very inhomogeneous medium, thus leading to a large difference between the sensitivity distribution of the imaging area full of brain and that full of air, and the sensitivity matrices used for imaging in this paper are all calculated when the imaging zone are full of air, so it leads to poor imaging of blood, which may also be the reason why the imaging results deviate from the actual location. This problem can be potentially mitigated through refinement in the computational approaches for sensitivity matrix and imaging algorithms. In summation, the Symmetrical Cancellation Imaging modality elucidated here demonstrates potential for achieving absolute cerebral hemorrhage imaging, although further research is require for entering practical stage. The most significant hurdles pertain to the intricacy of operational procedures and the precision required in cranial placement. Future directions involve the refinement of ECT sensor design, computational methodologies for sensitivity matrix and imaging algorithms to enhance the imaging quality for this innovative imaging paradigm. To ensure that the ECT electrode array maintains precise symmetry with respect to the skull’s anatomical structure, it is proposed to install laser range sensors in the center of each electrode. This setup will allow for real-time display of the distances between all electrodes and the subject’s skull. Consequently, based on the measurements from the laser range sensors, the gap between the ECT electrode array and the skull can be adjusted more conveniently, significantly improving the precision of the array’s symmetry relative to the skull. Additionally, procedure for the calibration of symmetrical cancellation ECT is needed. It is proposed to design a 3D-printed adult skull model based on 3D scanning data of an adult skull. The model will include major fillers such as cerebrospinal fluid, gray matter, and white matter, whose electromagnetic parameters match those of their real-life counterparts. Before each measurement, the model will be measured first by the symmetrical cancellation ECT, the measurement data will be stored as calibration data. Subtracting this calibration data from subsequent actual measurements can achieve high-precision imaging results.
Data availability statement
The original contributions presented in the study are included in the article/supplementary material, further inquiries can be directed to the corresponding authors.
Author contributions
JH: Data curation, Writing–original draft. FC: Data curation, Writing–original draft. KW: Conceptualization, Supervision, Writing–review and editing. SC: Conceptualization, Supervision, Writing–review and editing.
Funding
The author(s) declare that no financial support was received for the research, authorship, and/or publication of this article.
Conflict of interest
The authors declare that the research was conducted in the absence of any commercial or financial relationships that could be construed as a potential conflict of interest.
Publisher’s note
All claims expressed in this article are solely those of the authors and do not necessarily represent those of their affiliated organizations, or those of the publisher, the editors and the reviewers. Any product that may be evaluated in this article, or claim that may be made by its manufacturer, is not guaranteed or endorsed by the publisher.
References
1. GBD 2016 Stroke Collaborators. Global, regional, and national burden of stroke, 1990-2016: a systematic analysis for the global burden of disease study 2016. Lancet Neurol (2019) 18:439–58. doi:10.1016/S1474-4422(19)30034-1
2. Wang L, Liu J, Yang G, Peng B, Wang Y. The prevention and treatment of stroke in China is still facing great challenges—summary of China Stroke Prevention report 2018. Chin Circ J (2019) 34(02):6–20.
3. Ayaz H, Lzzetoglu M, Izzetoglu K, Onaral B, Ben Dor B. Early diagnosis of traumatic intracranial hematomas. J Biomed Opt (2019) 24(5):1. doi:10.1117/1.jbo.24.5.051411
4. Balami JS, White PM, McMeekin PJ, Ford GA, Buchan AM. Complications of endovascular treatment for acute ischemic stroke: prevention and management. Int J Stroke (2018) 13(4):348–61. doi:10.1177/1747493017743051
5. Bayford R, Bertemes-Filho P, Frerichs I. Topical issues in electrical impedance tomography and bioimpedance application research. Physiol Meas (2020) 41(12):120301. doi:10.1088/1361-6579/abcb5b
6. Soleimani M, Ktistis C, Ma X Magnetic induction tomography: image reconstruction on experimental data from various applications (2005).
7. Sasaki K, Wake K, Watanabe S. Development of best fit Cole-Cole parameters for measurement data from biological tissues and organs between 1 MHz and 20 GHz. Radio ence (2015) 49(7):459–72. doi:10.1002/2013RS005345
8. Warsito W, Marashdeh Q, Fan LS. Electrical capacitance volume tomography. IEEE Sensors J (2007) 7(4):525–35. doi:10.1109/jsen.2007.891952
9. Wang H, Yang W. Application of electrical capacitance tomography in pharmaceutical fluidised beds – a review. Chem Eng Sci (2020) 231:116236. doi:10.1016/j.ces.2020.116236
10. Bai Z, Li H, Chen J, Zhuang W, Li G, Chen M, et al. Research on the measurement of intracranial hemorrhage in rabbits by a parallel-plate capacitor. PeerJ (2021) 9(99):e10583. doi:10.7717/peerj.10583
11. Xu R, Zhuang W, Bai Z, Wang F, Jin G, Liu N, et al. A pilot study on intracerebral hemorrhage imaging based on electrical capacitance tomography. Front Phys (2023) 3(11). doi:10.3389/fphy.2023.1165727
12. Chen Q, Liu R, Wang C, Liu RJMS. Real-time in vivo magnetic induction tomography in rabbits: a feasibility study. Meas Sci Technol (2020) 32(3):035402. doi:10.1088/1361-6501/abc579
13. Roldan-Valadez E, Suarez-May MA, Favila R, Aguilar-Castañeda E, Rios C. Selected gray matter volumes and gender but not basal ganglia nor cerebellum gyri discriminate left versus right cerebral hemispheres: multivariate analyses in human brains at 3T. anatomical Rec Adv Integr Anat Evol Biol (2015) 298(7):1336–46. doi:10.1002/ar.23165
14. Samir A. Anatomy, histology of cerebral hemisphere then the classification of CNS tumors with referral to morphology, complications and prognosis of Astrocytoma. Meningioma (2021). doi:10.13140/RG.2.2.14518.52802
15. Gm DCM, Brott TG, Xi G Lobar intracerebral hemorrhage model in pigs: rapid edema development in perihematomal white matter (2013).
16. Wang J, Li C, Chen T, Fang Y, Shi X, Pang T, et al. Nafamostat mesilate protects against acute cerebral ischemia via blood–brain barrier protection. Neuropharmacology (2016) 105:398–410. doi:10.1016/j.neuropharm.2016.02.002
17. Dai M, Liu XC, Li HT, Xu CH, Yang B, Wang H, et al. EIT imaging of intracranial hemorrhage in rabbit models is influenced by the intactness of cranium. Biomed Res Int (2018) 2018:1–10. doi:10.1155/2018/1321862
18. Jin G, Sun J, Qin M, Tang Q, Xu L, Ning X, et al. A new method for detecting cerebral hemorrhage in rabbits by magnetic inductive phase shift. Biosens Bioelectron (2014) 52:374–8. doi:10.1016/j.bios.2013.09.019
19. Mcdermott BJ, Porter E, Jones M, McGinley B, O’Halloran M. Symmetry difference electrical impedance tomography - a novel modality for anomaly detection. Physiol Meas (2018) 39:044007. doi:10.1088/1361-6579/aab656
20. Mcdermott B, Avery J, O'Halloran M, Aristovich K, Porter E. Bi-frequency symmetry difference electrical impedance tomography—a novel technique for perturbation detection in static scenes. Physiol Meas (2019) 40:044005. doi:10.1088/1361-6579/ab08ba
21. Yang WQ, Peng L. Image reconstruction algorithms for electrical capacitance tomography. Meas Sci Tech (2003) 14:R1–R13. doi:10.1088/0957-0233/14/1/201
22. Ye J, Wang H, Yang W. Image reconstruction for electrical capacitance tomography based on sparse representation. IEEE Trans Instrumentation Meas (2014) 64(1):89–102.
Keywords: intracerebral hemorrhage, ECT, symmetrical cancellation imaging, prehospital emergency, measurement
Citation: Huang J, Chen F, Wang K and Chen S (2024) Research on electrical capacitance tomography (ECT) detection of cerebral hemorrhage based on symmetrical cancellation method. Front. Phys. 12:1392767. doi: 10.3389/fphy.2024.1392767
Received: 28 February 2024; Accepted: 26 April 2024;
Published: 15 May 2024.
Edited by:
Guanqiu Qi, Buffalo State College, United StatesReviewed by:
Zhongyuan Zhao, Nanjing University of Information Science and Technology, ChinaPan Yang, Chongqing Medical University, China
Copyright © 2024 Huang, Chen, Wang and Chen. This is an open-access article distributed under the terms of the Creative Commons Attribution License (CC BY). The use, distribution or reproduction in other forums is permitted, provided the original author(s) and the copyright owner(s) are credited and that the original publication in this journal is cited, in accordance with accepted academic practice. No use, distribution or reproduction is permitted which does not comply with these terms.
*Correspondence: Ke Wang, dzEzOTk2MDQ4MjE2QDE2My5jb20=; Sheng Chen, dXBfY2hlbkAxMjYuY29t
†These authors have contributed equally to this work and share first authorship