- School of Physics, Harbin Institute of Technology, Harbin, China
Active laser imaging utilizes time-of-flight and echo intensity measurements to generate distance and intensity images of targets. However, scattering caused by cloud and fog particles, leads to imaging quality deterioration. In this study, we introduce a novel approach for improving imaging clarity in these environments. We employed a matched filtering method that leverages the distinction between signal and noise in the time domain to preliminarily extract the signal from one-dimensional photon-counting echo data. We further denoised the data by utilizing the Long Short-Term Memory (LSTM) neural network in extracting features from extended time-series data. The proposed method displayed notable improvement in the signal-to-noise ratio (SNR), from 7.227 dB to 31.35 dB, following an analysis of experimental data collected under cloud and fog conditions. Furthermore, processing positively affected the quality of the distance image with an increase in the structural similarity (SSIM) index from 0.7883 to 0.9070. Additionally, the point-cloud images were successfully restored. These findings suggest that the integration of matched filtering and the LSTM algorithm effectively enhances beam imaging quality in the presence of cloud and fog scattering. This method has potential application in various fields, including navigation, remote sensing, and other areas susceptible to complex environmental conditions.
1 Introduction
Active laser imaging utilizes the reflection of a laser beam incident onto a target to detect an echo signal for target imaging [1]. Algorithmic processing of the echo signal allows for a variety of information to be extracted, such as the distance to the target [2–5], shape [6, 7], and reflectivity of the target [8]. Active laser imaging has found widespread application in diverse fields, including target recognition [9, 10], autonomous driving [11–13], and guidance [14]. However, random scattering of light beams induced by cloud and fog particles in real-world scenarios [15] causes a reduced SNR in imaging [16, 17]. Consequently, there is a growing need for a technique to enhance the SNR in cloudy and foggy environments. The random scattering induced by cloud and fog results in a weak echo signal. The time-correlated single-photon counting (TCSPC) method, which is known for its ability to capture weak echo photons with high sensitivity, is particularly suitable for imaging in intricate scattering environments, such as cloud and fog [18, 19], as well as underwater [20, 21]. Therefore, a photon counter was employed to receive the echo photons and acquire the one-dimensional photon counting time distribution data of the beam. However, it is still necessary to process the noise present in the echo data in cloudy and foggy environments.
In recent years, diverse methods for processing echo data have emerged with the aim of enhancing data quality in the presence of noise interference. These methods include median filtering [22], mean filtering [23], Kalman filtering [24], and matched filtering [25], all of which are applied in the time domain. Additionally, methods such as low-pass filtering [26], processed in the frequency domain, and wavelet threshold denoising [27, 28], are applied in the wavelet domain. Median filtering showed effectiveness in eliminating pulse noise while preserving the edge clarity of the image during noise processing. Mean filtering is adept at removing abrupt noise but may not effectively safeguard local signal changes. Kalman filtering typically assumes Gaussian noise distribution. Low-pass filtering can effectively filter out noise but may be less efficient in preserving signal details. The effect of wavelet threshold denoising is influenced by various factors. Hou et al. [29] discovered that when processing signals against a backdrop of strong noise, this method fails to achieve precise signal detection and still suffers from significant noise interference, making it less than ideal for denoising signals with low SNR. By recognizing the disparity between the signal and backscatter noise in the time domain, matched filtering facilitates the identification of target echoes, which effectively filters out backscatter noise and enhances the SNR of the output. Nevertheless, challenges arise in extracting the target signal peaks in scenarios with strong noise characteristics. With the development of machine learning, various neural network architectures such as convolutional neural networks [30], BP neural networks [31], and recurrent neural networks (RNNs) [32] have been applied to denoising, recognition, and classification tasks. Although RNN are effective in processing one-dimensional time series, they are susceptible to gradient vanishing and explosion when implemented on complex data. The LSTM algorithm, which is a specialized form of the RNNs, addresses this challenge by incorporating gating mechanisms to control data flow [33]. The advantages and disadvantages of different noise filtering techniques are detailed in Section 1 of the Supplementary Material.
The aim of this study is to introduce a novel method to enhance the SNR of data, which contains noise induced through the backscattering effect of cloud and fog. The proposed denoising method combines matched filtering with the LSTM algorithm, resulting in the formation of the MF-LSTM algorithm. The initial noise reduction was accomplished through matched filtering, leveraging the temporal distribution difference between the signal and noise. The LSTM algorithm was integrated to extract features from the one-dimensional time-series signal, further enhancing noise filtration and improving the SNR of imaging in cloudy and foggy environments. The efficacy of the proposed method in enhancing the SNR of beam imaging in these environments was experimentally validated.
This article begins by outlining the experimental system design, followed by the introduction of a denoising method MF-LSTM algorithm. Subsequently, experimental verification was performed to demonstrate the effectiveness of this method for denoising the echo data of beam imaging under varying visibility conditions. A comparative analysis against mean filtering, median filtering, and the LSTM algorithm without matched filtering is conducted to reveal an improvement in the SNR. Furthermore, enhancements are observed in both the quality of the point cloud images and the SSIM index of the distance images. This method demonstrates improvements in imaging quality in cloudy and foggy environments.
2 Materials and methods
2.1 System working principle
Figure 1 displays the diagram of the imaging system developed to investigate imaging in cloudy and foggy environments and assess the denoising effect of the proposed algorithm. The beam at a wavelength of 532 nm, was expanded and collimated by lenses L1 and L2. A quarter-wave plate (QWP) was used to generate a circularly polarized beam. Utilizing a Dammann grating (DG) with a diffusion angle of 2° and a diffraction efficiency of 68.32%, the beam was divided into a
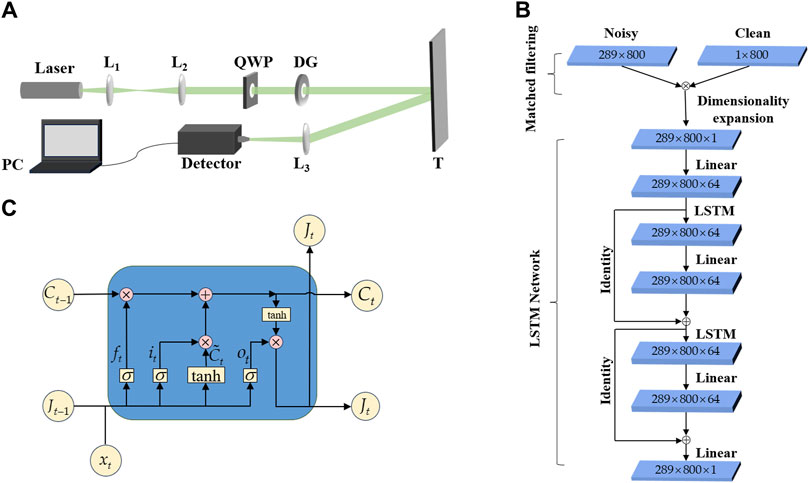
Figure 1. Schematic of the imaging system under cloud and fog conditions. (A) Laser: 532 nm laser; L1-L3: lens; QWP: quarter-wave plate; DG: Dammann grating; T: object; PC: personal computer. (B) Schematic of denoising model structure based on the MF-LSTM algorithm. (C) LSTM neural network unit structure diagram. Ct-1: memory data of the previous neuron; Ct: memory data of the current neuron; Jt-1: output data of the previous neuron; Jt: output data of the current neuron; xt: input data of the current neuron; ft: forget gate; it: input gate; ot: output gate; σ: Sigmoid function; tanh: Tanh function;
2.2 MF-LSTM algorithm
Step 1: Applying matched filtering for the initial processing of noisy data.
The data were initially processed using a matched filtering method. The normalized target echo data without cloud and fog was taken as the instrument response function, denoted as
Step 2: Applying the LSTM algorithm for further noise reduction.
After matched filtering in the cloudy and foggy environments, the data from each subbeam in the array served as the input of the network. The echo data corresponding to each subbeam in the cloudy and foggy-free environments served as the output of the network. The network employed the mean-square error as its loss function, with the learning rate set at
The distance was extracted from the data using the peak value method by identifying the time corresponding to the highest number of echo photons in the photon-count echo data and multiplying it by the laser flight speed to derive the target distance.
Figure 1C depicts the unit structure of the LSTM neural network, which regulates data through a forget gate, input gate, and output gate [34]. The forget gate
3 Experimental results
3.1 Denoising efficacy of the proposed algorithm in comparison to other methods on one-dimensional data
Validation experiments were conducted using the apparatus illustrated in Figure 1A to assess the efficacy of the proposed method for data denoising in cloudy and foggy environments. First, we examined the transmission of a single subbeam in cloudy and foggy environments. The photon-counting time distribution histogram was obtained after the reflection of the target at a distance of 6 m, using a photon counter. The single-photon detector module is utilized to detect photons, which, upon reception, are converted into electrical signals and output to a time-correlated photon counter. The photon counter is triggered on the falling edge, with a time resolution of 25 ps. In this study, we selected a time resolution of 100 ps to categorize the echo photons, recording the arrival time of each photon in groups, thereby generating a time-distributed histogram of the data. A total of 8670 sets of one-dimensional data were used as the training set for the network, which depicted in Figure 1B. Subsequently, the training set was processed using the matched filtering method and trained using the LSTM network model. Finally, the trained network was applied to denoise the one-dimensional photon-count time distribution data. The denoising results of the MF-LSTM algorithm, were compared with those of mean filtering, median filtering, and the LSTM algorithm without matched filtering. Figure 2 displays the comparison of one-dimensional photon count time distribution data of individual subbeams in a noise-free environment, a cloudy and foggy environment, and after denoising with various algorithms.
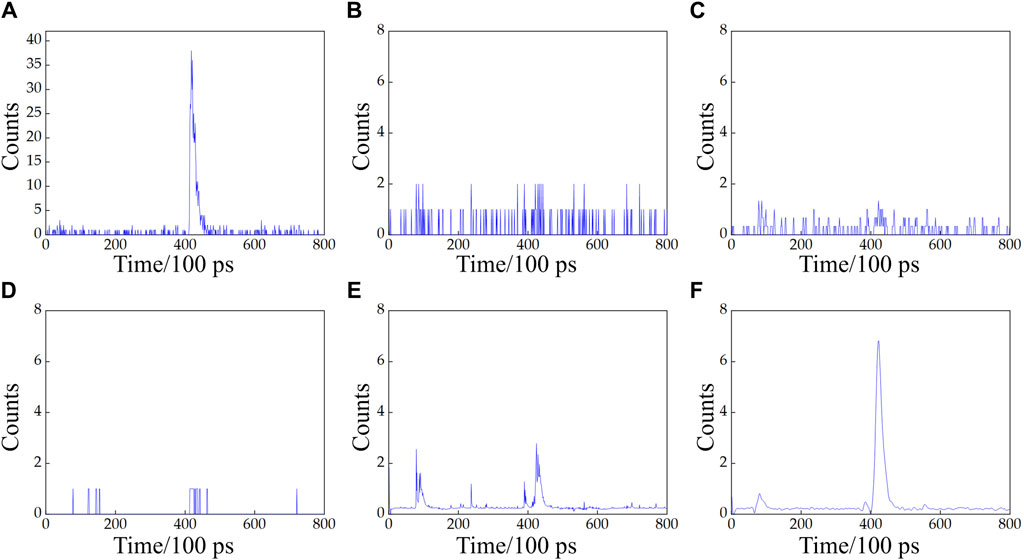
Figure 2. Denoising results of one-dimensional data under different algorithms. (A) Noise-free environment; (B) cloudy and foggy environment; (C) mean filtering; (D) median filtering; (E) LSTM algorithm; (F) MF-LSTM algorithm.
Each small grid on the horizontal axis in Figure 2 represents the time resolution of the photon counter, with a time grid of 100 ps. As shown in Figures 2A, A distinct target echo signal peak is evident in the photon count time distribution in the absence of cloud and fog. The photon number distribution primarily comprised of echo photons reflected by the target. Echo photons in the non-target reflection time region were also observed at a significantly lower rate, owing to the high sensitivity of the photon counter. Figure 2B displays the impact of backward scattering from cloud and fog, which led to a reduction in the number of echo photons reflected by the target and an increase in the number of noise photons, which concentrated at a distance closer than the target. This interference hampers the use of the peak value method for distance measurement, resulting in a decrease in the distance measurement value and the introduction of errors. The data displayed in Figures 2C,D show that application of the mean and median filtering for signal denoising may result in partial reduction in noise and an increase in the signal proportion. However, when the number of noise photons caused by the backscattering of cloud and fog is high, the distinction between the scattering peak value influenced by cloud and fog and the signal peak value becomes small. This led to a suboptimal noise filtering effect and a small improvement in the distance measurement using the peak value method. In Figure 2E, it is evident that the noise distribution is reduced when the LSTM algorithm without matched filtering was employed for denoising. A distinction is apparent between the echo peak value caused by cloud and fog backscattering and the echo peak value resulting from the target reflection. This distinction enhanced the results of the peak value method for ranging; however, the peak value of cloud and fog backscattering remained relatively high. The denoising effect based on the MF-LSTM algorithm is displayed in Figure 2F. Leveraging the distribution difference between signal and noise in the time domain, matched filtering exploits this dissimilarity to extract the signal. Compared with the LSTM algorithm without matched filtering, it effectively filters out the noise data induced by backscattering from cloud and fog.
3.2 Denoising efficacy of the proposed algorithm under various visibility conditions
To investigate the denoising efficacy of the proposed algorithm under varying visibility conditions, a histogram of photon count time distribution for the target reflection at a distance of 6 m in cloud and fog conditions was obtained using the device depicted in Figure 1A. Following network training, the echo data from subbeams with visibility values of 6, 10, 14, 18, 22, and 26 m were utilized as test data. Denoising was conducted using MF-LSTM algorithm. We evaluated the quality of the signal by obtaining the SNR based on the formula
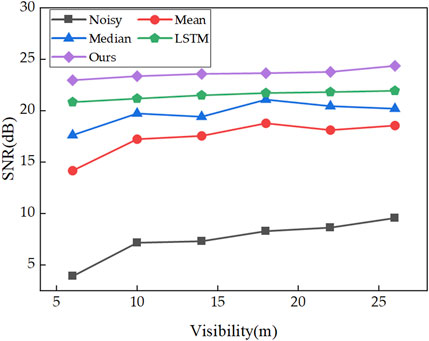
From Figure 3, it is evident that the SNR of the echo data in cloudy and foggy environments increased with improving visibility. These results confirm that improving visibility causes a diminish in the noise originating from the backward scattering of cloud and fog. The method proposed in this study enhanced the SNR of the echo data under various visibility levels after denoising. By comparing the SNR values from the different algorithms in Figure 3, we concluded that the proposed method generally outperforms mean filtering, median filtering, and the LSTM algorithm without matched filtering in terms of denoising effectiveness. When visibility deteriorates, noise increases and the SNR decreases, the filtering capability of other methods diminishes. However, the method proposed in this study maintains a stable SNR after denoising under different visibility conditions, exhibiting a gradual upward trend and showcasing strong noise resistance.
Histograms of the photon count time distribution under different visibility levels in cloud and fog at a target distance of 6 m, corresponding to Figure 3, are presented in Figure 4. The initial power of the beam in this study consistently matches the power of the beam under noiseless conditions, as illustrated in Figure 2A. The distribution of SNR under different visibility is provided in Figure 4.

Figure 4. Histograms of the photon count time distribution under different visibility levels. (A) Visibility: 6 m; SNR: 3.895 dB; (B) visibility: 10 m; SNR: 7.167 dB; (C) visibility: 14 m; SNR: 7.311 dB; (D) visibility: 18 m; SNR: 8.279 dB; (E) visibility: 22 m; SNR: 8.637 dB; (F) visibility: 26 m; SNR: 9.548 dB.
As depicted in Figure 4, when visibility is low, the target signal is submerged in the backscattered signals from cloud and fog, making accurate distance calculation challenging using the peak value method. With increasing visibility, the number of photons reflected by the target rises, the proportion of noise from cloud and fog scattering decreases, and the SNR improves. The denoised results using the MF-LSTM algorithm are presented in Figure 5. It is evident that across various visibility levels, noise is effectively filtered out, allowing clear peaks of the target echo signal to emerge, accompanied by an increase in signal proportion.
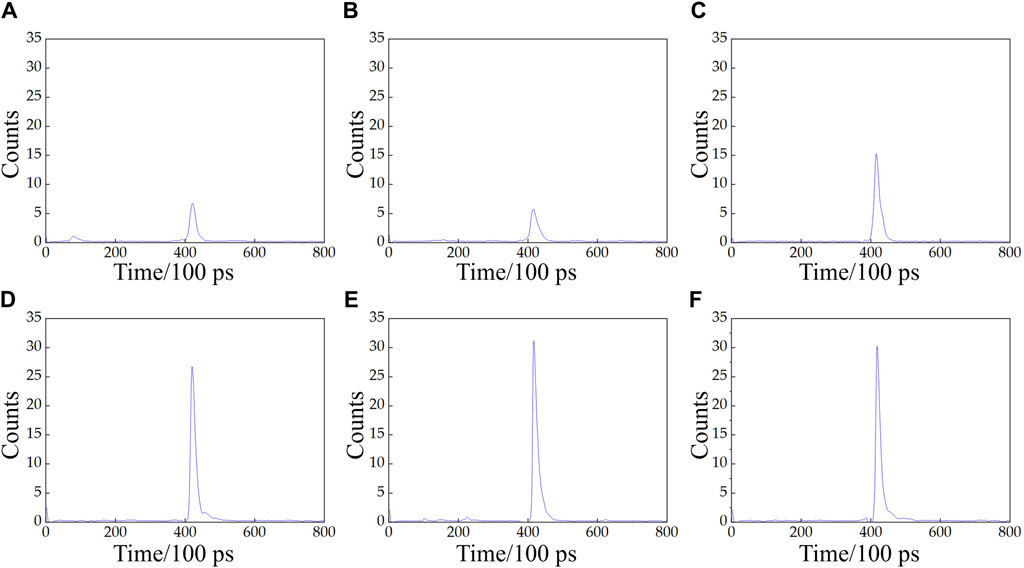
Figure 5. Histograms of the photon count time distribution after denoising based on the MF-LSTM algorithm. (A) Visibility: 6 m; SNR: 22.95 dB; (B) visibility: 10 m; SNR: 23.35 dB; (C) visibility: 14 m; SNR: 23.59 dB; (D) visibility: 18 m; SNR: 23.66 dB; (E) visibility: 22 m; SNR: 23.76 dB; (F) visibility: 26 m; SNR: 24.36 dB.
When visibility is low and cloud and fog concentration is high, the laser undergoes multiple scattering, making it challenging to distinguish between the target signal and noise, as illustrated in Figures 4A,B, which consequently impacts the ranging accuracy. After denoising with the MF-LSTM algorithm, the echo data transformed into Figures 5A,B, respectively, reveal clear peaks of the target echo signal. The average ranging error was calculated by determining the difference between the measured distance and the real distance using the formula
3.3 Denoising efficacy of the proposed algorithm in dense cloud and fog environments
To further illustrate the advantages of combining matched filtering and the LSTM algorithm, a study was conducted under conditions of high cloud and fog scattering, as depicted in Figure 6A. The cloud and fog visibility, as well as the target distance, depicted in Figure 6, are both 6 m. The target signal is submerged in noise, and obtaining a clear target signal peak becomes challenging. At this point, as shown in Figure 6D, matched filtering can still preliminarily filter the data, producing smoother data closer to the noiseless signals shown in Figure 6B. However, due to strong scattering noise, multiple peaks are generated, making it difficult to distinguish the target signal. Due to the robust data fitting ability of neural networks, these systems can directly establish mappings between input and output signals. Using the noise signals shown in Figure 6A and the data processed after matched filtering in Figure 6D as inputs to the network, mappings were established with that shown in Figure 6B. The results obtained after network processing are displayed in Figures 6C,E, respectively. The comparison reveals that the MF-LSTM algorithm exhibits a higher SNR and is closer to the noiseless signal after processing than achieved using only the LSTM algorithm. Therefore, it can be inferred that the MF-LSTM algorithm synergistically leverages the advantages of both matched filtering for extracting the target signal based on signal and noise distribution difference, and the LSTM algorithm for capturing complex time series signal features. Compared with the LSTM network alone, the MF-LSTM algorithm demonstrates superior data fitting capabilities and enhances the network’s noise removal performance.
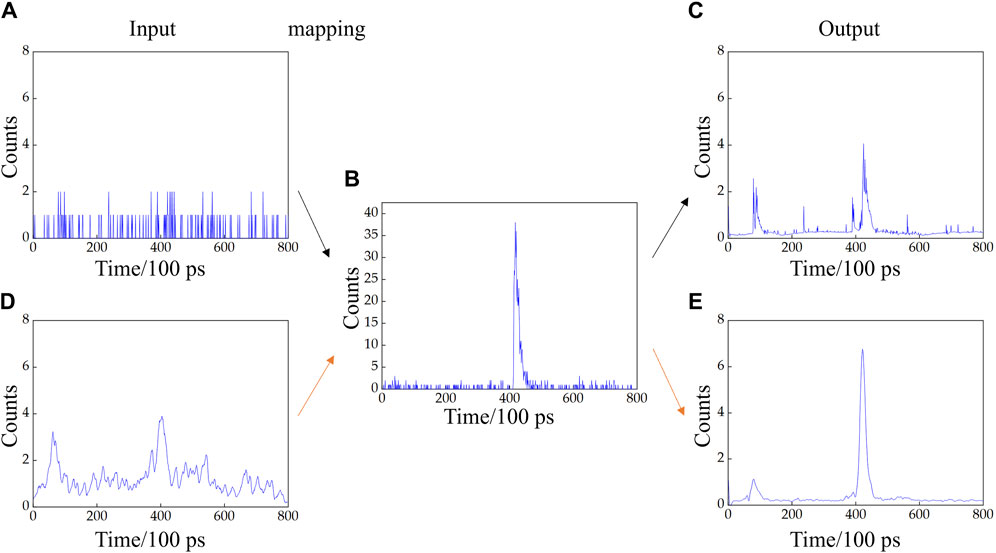
Figure 6. Comparison of denoising data between the LSTM and MF-LSTM algorithm in dense cloud and fog environments. (A) Cloudy and foggy environment; (B) noise-free environment; (C) LSTM algorithm; (D) matched filtering; (E) MF-LSTM algorithm.
3.4 Enhancement and evaluation of proposed algorithm
To investigate the improved imaging performance of the proposed algorithm under cloud and fog conditions, an experimental
The training dataset of this experiment includes three scenarios: high, moderate, and low cloud and fog concentrations. When the cloud and fog concentration is high, the corresponding visibility is less than or equal to 10 m, and the SNR is less than 5 dB. When the cloud and fog concentration is moderate, the corresponding visibility is between 10 and 25 m, and the SNR is between 5 and 10 dB. When the cloud and fog concentration is low, the corresponding visibility is higher than 25 m, and the SNR is higher than 10 dB.
The echo data of the three targets under average visibility conditions at 14.36, 13.24, and 13.58 m were used as the test sets. The network was applied to denoise the echo data from each subbeam, providing a comparison in the photon count time distribution data before and after denoising. The number of photons in each time grid was extracted from the data before and after denoising. The corresponding distance value for each time grid was determined to derive the photon distribution at different distance values.
Figure 7 displays the point cloud map of the target imaging before and after denoising acquired by organizing the photons from each subbeam at every distance. Figure 7A shows the effect of the cloud and fog on the three targets, which results in randomly scattered photons in space and a significant amount of noise in the point-cloud image. Additionally, a deterioration in the visibility causes an increase in noisy photons, making it difficult to distinguish the target image. Figure 7B displays the data after applying the MF-LSTM algorithm for denoising, showing a notable reduction in the noise distribution in the point cloud image. Photons were primarily concentrated in the target area at a distance of 6 m, which leads to an enhanced target resolution capability. By calculating the total number of photons in the signal and the total number of photons in the noise before and after denoising, we determined that the ratios of signal to noise points for the three types of targets increased by 17.64%, 23.58%, and 27.35% for visibility conditions at 14.36, 13.24, and 13.58 m, respectively, after denoising using the proposed algorithm. These results suggest that the MF-LSTM algorithm can achieve the denoising of point cloud images of targets under different visibility levels by denoising single subbeam echo data.
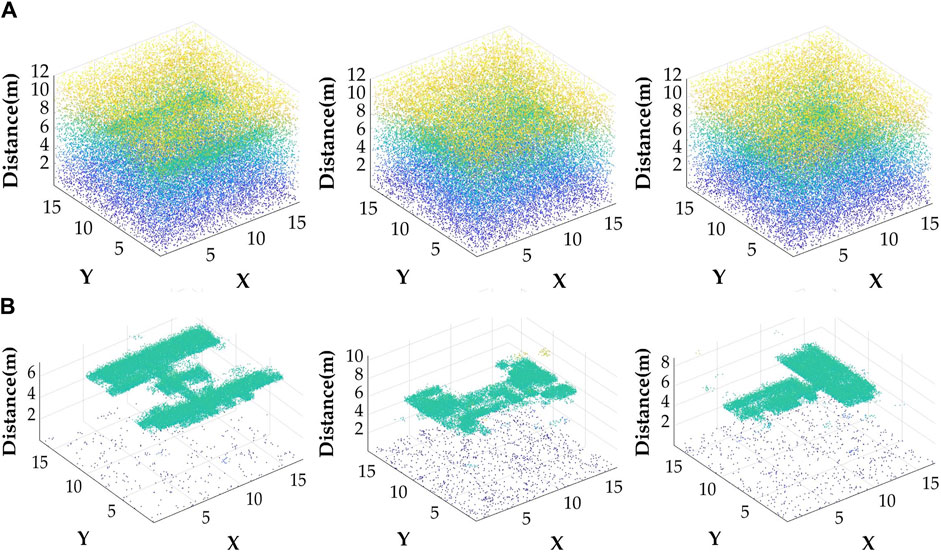
Figure 7. (A) Point cloud images of different targets in cloudy and foggy environments; (B) denoising results of the MF- LSTM algorithm.
4 Discussion
4.1 Denoising efficacy of the proposed algorithm on the target range profiles
To further validate the enhancement of the imaging effect in the cloudy and foggy scattering environments using the MF-LSTM algorithm, denoising was applied to the range profiles of the three targets within the cloudy and foggy environments. We compared our MF-LSTM algorithm with mean filtering, median filtering, and the LSTM algorithm for denoising photon count time distribution data. Using the peak value method to extract the distance values corresponding to each point from the denoised data, the distance profiles after denoising with various algorithms are illustrated in Figure 8.
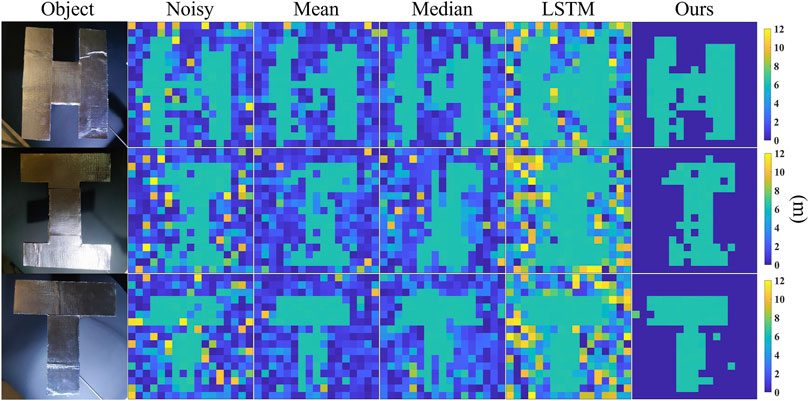
Figure 8. Distance images of the target at 6 m after denoising using different algorithms. Noisy: in cloudy and foggy environments; Mean: mean filtering; Median: median filtering; Ours: MF-LSTM algorithm. The colorbar represents the distance.
By calculating the average ranging error of a single pixel in the three target images before and after denoising, it was observed that the average ranging error decreased by 61.74%, 65.09%, and 82.88%, for the “H,” “I,” and “T” target images, respectively, following the application of the MF-LSTM algorithm. This indicates that the MF-LSTM algorithm effectively enhances the accuracy of imaging in cloudy and foggy environments.
The quality of the images before and after denoising was assessed based on the structural similarity index
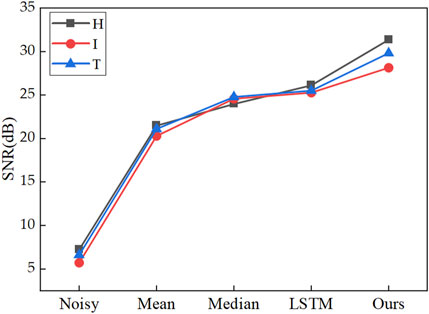
Figure 8 and Table 2 indicate that the backscattering by cloud and fog has an impact on the imaging of the target distance images leads to poor image resolution due to the noise distribution. It can be observed that although the SSIM of the image improved after mean filtering, the denoising process was less effective in filtering out the noise distribution, which resulted in a relatively small improvement in the target resolution. No significant improvement was observed in the SSIM of the image following median filtering, and in some cases, the SSIM was even smaller than that of the noisy image, leading to a relatively minor enhancement in the image. As shown in Figure 8, denoising with the LSTM algorithm restored the image within the target range compared to the cloud and fog environment and after mean and median filtering. However, the noise areas were not entirely filtered out, and the distinctions between the target and signal regions were relatively small. The SSIM after denoising using this method was smaller than that of noisy images, resulting in a poor denoising effect on the range profiles and no improvement in the target resolution. The application of the MF-LSTM algorithm not only effectively restored the image within the target range, but also reduced the noise distribution in the data by leveraging the difference between the signal and noise in the time domain based on matched filtering. This process effectively filtered out noisy areas in the image, thereby improving the SSIM and enhancing the resolution of the image. These results indicate that the MF-LSTM algorithm can not only effectively restore the target image, but also filter out background noise. In comparison to other algorithms, this method proves effective in enhancing the SSIM of images, thereby improving the resolution ability of the target image. This indicates that the proposed method can both denoise point cloud images and restore distance images. Figure 9 shows the SNR of the image after denoising using different algorithms.
The SNR of the “H” target in the cloudy and foggy environments was 7.227 dB as illustrated in Figure 9. The SNRs after denoising using the mean filtering, median filtering, LSTM and MF-LSTM algorithms were 21.47, 23.95, 26.10, and 31.35 dB, respectively. Figure 9 shows an improvement in the SNR of different targets after denoising using various algorithms. By comparing the SSIM and SNR of different denoising algorithms, it can be concluded that the MF-LSTM algorithm provides more effective denoising impact than other methods. Therefore, it can be applied for denoising active laser imaging in cloudy and foggy scattering environments.
To further investigate the denoising effect of the MF-LSTM algorithm on range profiles in various cloud and fog environments, the initial power of the beam was maintained at a constant value. By reducing visibility to increase cloud and fog scattering noise, different levels of noise and signals are obtained. Imaging of the “H” target was performed at a distance of 6 m under visibility levels of 9.04, 14.36, and 28.15 m. The SNR and SSIM values of the images before and after algorithm denoising are presented in Table 3. These results indicate that the SNR and SSIM of the images processed by the MF-LSTM algorithm were enhanced, suggesting that this algorithm is adaptable to different cloud and fog environments.
4.2 Denoising efficacy of the proposed algorithm on low-reflectivity targets
The target reflectivity influences the number of photons reflected by the target. When the target reflectivity is low, the number of reflected photons decreases. Under conditions of high cloud and fog scattering, accurate distance information of the target cannot be obtained from echo data. Therefore, this study simulated the SNR of targets with lower reflectivity in cloud and fog under the same distance and visibility using the Monte Carlo method [36], and denoised the data using the MF-LSTM algorithm. The SNR of the low-reflectivity targets before and after denoising is presented in Table 4.
It can be concluded that target reflectivity has a significant impact on the SNR in cloudy and foggy environments. The SNR of low-reflectivity targets is low. After denoising, the SNR improves under different low-reflectivity conditions by approximately 10 times, which is basically unaffected by the target reflectivity.
4.3 Denoising efficacy of the proposed algorithm in high proportion of multiple scattering
Photons transmitted through cloud and fog undergo multiple random scatterings by cloud and fog particles. According to Ref. [37], it is evident that the distance between consecutive scatterings of photons follows an exponential distribution, and the time intervals between scatterings also follow an exponential distribution. A detected photon undergoes multiple scatterings, and the sum of multiple independent exponential random variables follows a gamma distribution. Consequently, photons undergoing multiple scatterings in cloud and fog exhibit a gamma distribution.
The Monte Carlo simulation method for cloud and fog scattering [36] is based on Mie scattering theory and multiple scattering theory. Consequently, this method was employed to simulate and analyze the multiple scattering of light beams through cloud and fog at a target distance of 6 m with a SNR of 1.896 dB. Subsequently, the MF-LSTM algorithm was applied for denoising, and the results are depicted in Figure 10.
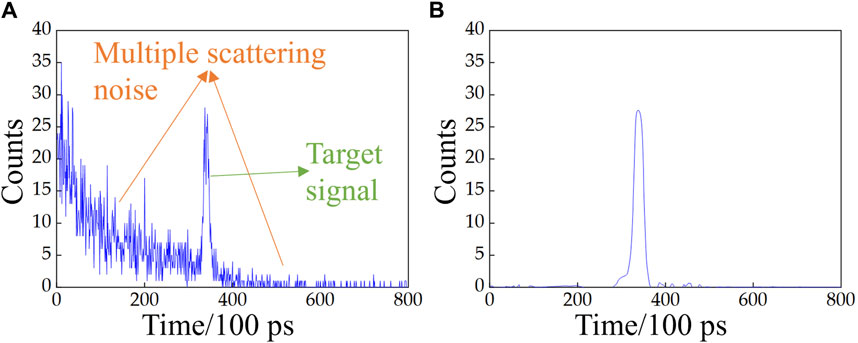
Figure 10. (A) Histogram of photon count time distribution after multiple scatterings in cloud and fog; (B) Denoising results obtained using the MF-LSTM algorithm.
From Figure 10A, it is evident that the multiple random scatterings of photons in cloud and fog lead to photons being detected by the detector before reaching the target, resulting in noise distribution preceding the target peak. Additionally, photons reflected from the target also undergo multiple scatterings, resulting in noise distribution after the target peak. The peak of cloud and fog scattering in the photon count time distribution histogram represents photons that have undergone multiple scatterings, revealing the statistical characteristics of cloud and fog. The broadening effect is evident, displaying a gamma distribution, which is consistent with theoretical expectations. The target peak also exhibits broadening, but the photons within the target peak still retain the information of essentially unscattered ballistic photons. The broadening effect is less pronounced compared to the cloud and fog scattering peak, indicating a distinction between the two distributions. As depicted in Figure 10A, the noise peak caused by multiple scatterings in cloud and fog surpasses the target signal peak. This results in the inability to accurately extract the target signal, consequently leading to reduced ranging accuracy. Leveraging the distinctions between the gamma distribution noise caused by multiple scatterings in cloud and fog and the target signal peak, this study employs the MF-LSTM algorithm to extract the target signal peak, achieving the removal of noise from multiple scatterings in cloud and fog. From Figure 10B, it can be concluded that the MF-LSTM algorithm effectively filters out the noise from multiple scatterings by exploiting the disparities between noise and signal distributions. After denoising, a distinct target signal peak is obtained, thereby enhancing ranging accuracy. The SNR increases to 12.53 dB after denoising. Hence, it can be inferred that the MF-LSTM algorithm is capable of improving ranging accuracy and SNR in scenarios characterized by a high proportion of multiple scattering in cloud and fog.
Monte Carlo simulation can also be used to simulate near-zero visibility environments, which are difficult to produce in the laboratory. Subsequently, the data can be denoised using the MF-LSTM algorithm, with the denoising results presented in the Section 3 of the Supplementary Material. Additionally, Monte Carlo simulation can be employed to assess the denoising performance of the MF-LSTM algorithm under different cloud and fog particle sizes, with corresponding results provided in the Section 4 of the Supplementary Material.
4.4 Denoising efficacy of the proposed algorithm under different learning rates
The learning rate represents the step length at which the gradient moves towards the optimal solution of the loss function in each iteration. If the learning rate is too high, it may cause the network to fail to converge. Conversely, if the learning rate is too low, it may slow the network’s training speed and increase training time. This study investigates the changes in the denoising effectiveness of imaging target “I” under different learning rates when the visibility is 13.24 m, the SNR is 5.708 dB and the SSIM is 0.7131, as shown in Table 5. The data in this table shows that at a learning rate of
We next compare the method proposed in this study with previous denoising schemes in cloudy and foggy environments. Feng Huang et al. [16] established a range-gated method for image denoising under cloud and fog conditions, which improves signal strength by shielding scattered light outside of the selected area. However, when the cloud and fog concentration is high, the gating method has little effect on the image improvement, and post-processing algorithms are still needed to process the image. The MF-LSTM algorithm can still recover the signal peak of the target and improve imaging performance even when the cloud and fog backscatter is high and the echo signal reflected by the target is low. Sang et al. [38] proposed a defogging method based on fog contour estimation, which involves subtracting the fog peak directly from histograms to reduce false alarms caused by fog at close distances. At a visibility of 50 m, this method was affected by the uneven distribution of cloud and fog, leading to inaccurate fog contour estimates and poor denoising results, with many noise points remaining in the images. In contrast, our study achieved effective filtration of cloud and fog noise in denser fog with a visibility of 14 m. The denoised images exhibit clear and visible target contours, with cloud and fog noise points effectively removed. Daiki Kijima et al. [39] proposed a method using double gating exposures under short pulse modulation, employing additional time gating exposures to estimate the scattering characteristics of fog and compensate for its scattering effects, thereby reconstructing target depth and intensity information. The image SNR of the method is 27.04 dB in dense fog environments, which is lower than the 29.07 dB achieved in this study. Lu et al. [40] developed an algorithm to mitigate the effects of scattering media during the imaging process of time-of-flight cameras. Their approach began with applying threshold segmentation to the depth histograms of images to eliminate interference from backscatter noise. This was followed by an image restoration algorithm based on atmospheric backlight prior knowledge to remove image disturbances. Finally, outliers in the images were removed. Their experiments denoised images of objects located 2 m away, achieving a maximum increase in the SSIM to approximately 0.7, showing only a slight improvement in SSIM compared to noise images under cloudy and foggy conditions. In contrast, our study conducted in a cloud and fog environment with a visibility of 13.24 m and targeting an object at a distance of 6 m, was able to increase the SSIM to 0.9052. Therefore, the denoising algorithm proposed in our study demonstrates a significant improvement over this method. By comparing with the above research in dense fog environments with this study, it can be concluded that the MF-LSTM algorithm exhibits superior denoising effectiveness when the cloud and fog backscattering is high.
To further extend the application of the algorithm in different scenarios, additional studies will be conducted on image denoising for complex targets and longer distances in realistic cloud and fog scenarios. A denoising database will be established, and the network’s robustness in various realistic scenarios will be enhanced.
5 Conclusion
We introduced a novel method to enhance imaging performance in cloudy and foggy scattering environments by combining matched filtering and the LSTM algorithm. This approach initially employs matched filtering to process the data and extract the target signal based on the difference in the noise and signal distribution in the time domain, thereby preliminary filtering out noise. Subsequently, leveraging the advantages of LSTM in extracting complex temporal signal features, further denoising is conducted under cloud and fog environments. Experimental imaging of different targets under cloud and fog conditions was performed. Our method demonstrated superior performance in denoising cloud and fog scattering noise and recovering target information compared to the results obtained using mean filtering, median filtering, and LSTM algorithm without matched filtering.
The experimental results indicated that the proposed method exhibited a notable denoising effect on the data at various visibility levels, and the SNR distribution after denoising remained relatively stable across different visibility conditions. The SNR for imaging the “H” target under cloud and fog conditions increased from 7.227 to 31.35 dB, demonstrating a superior improvement compared to 21.47 dB for mean filtering, 23.95 dB for median filtering, and 26.10 dB for the LSTM algorithm without matched filtering. The SSIM increased from 0.7883 to 0.9070, showing a more significant improvement compared to 0.8059 for mean filtering, 0.7847 for median filtering, and 0.7579 for the LSTM algorithm without matched filtering. The proposed method demonstrated effectiveness in denoising one-dimensional echo data under different visibility levels and in improving two-dimensional range profiles and three-dimensional point cloud images. In summary, the MF-LSTM algorithm achieved improvement in denoising compared to related methods by leveraging the ability of matched filtering to extract signals based on noise and signal distribution differences along with the advantages of the LSTM algorithm in processing complex time-series signals. This method exhibits superior denoising effects on cloud and fog scattering noise compared to other related methods. It has the potential to contribute not only to research on improving target imaging in cloudy and foggy scattering environments but also to provide assistance in other fields such as scattering environment imaging, target recognition, and target visualization.
It has potential applications in specific fields such as navigation or underwater exploration. By pre-collecting data under various environmental conditions, the network can be comprehensively trained and tested to ensure robust restoration performance under various scenarios. Subsequently, directly inputting real navigation data into the trained network can reduce computational complexity and ensure practicality. The time consumption for inputting test data directly into the trained MF-LSTM algorithm is 0.2395 s, meeting the real-time requirements for navigation under non-emergency situations. During actual navigation, different weather conditions may result in differences between received target signals and ideal signals in terms of shape. To enhance the accuracy and robustness of signal detection, the response function of the matched filtering in the MF-LSTM algorithm can be dynamically adjusted. Moreover, in underwater detection, regularization layers can be added to the network to randomly drop a portion of neurons, enhancing the model’s adaptability to small variations in input data and robustness in diverse environments.
Data availability statement
The raw data supporting the conclusion of this article will be made available by the authors, without undue reservation.
Author contributions
CC: Conceptualization, Data curation, Formal Analysis, Investigation, Methodology, Software, Writing–original draft. ZZ: Funding acquisition, Project administration, Supervision, Writing–review and editing. HW: Investigation, Methodology, Writing–review and editing. YZ: Validation, Visualization, Writing–review and editing.
Funding
The author(s) declare that financial support was received for the research, authorship, and/or publication of this article. This work was supported by the National Natural Science Foundation of China (Grant No. 62075049) and the Fundamental Research Funds for the Central Universities (FRFCU5710050722; FRFCU5770500522; FRFCU9803502223, and 2023FRFK06007).
Acknowledgments
The authors are grateful to the editors and referees for their valuable suggestions and comments, which greatly improved the presentation of this article. Additionally, CC thanked his Senior Brother Longzhu Cen for his support.
Conflict of interest
The authors declare that the research was conducted in the absence of any commercial or financial relationships that could be construed as a potential conflict of interest.
Publisher’s note
All claims expressed in this article are solely those of the authors and do not necessarily represent those of their affiliated organizations, or those of the publisher, the editors and the reviewers. Any product that may be evaluated in this article, or claim that may be made by its manufacturer, is not guaranteed or endorsed by the publisher.
Supplementary material
The Supplementary Material for this article can be found online at: https://www.frontiersin.org/articles/10.3389/fphy.2024.1392509/full#supplementary-material
References
1. Riviere N, Ceolato R, Hespel L. Active imaging systems to see through adverse conditions: light-scattering based models and experimental validation. J Quantitative Spectrosc Radiative Transfer (2014) 146:431–43. doi:10.1016/j.jqsrt.2014.04.031
2. Lee J, Lee K, Lee S, Kim S-W, Kim Y-J. High precision laser ranging by time-of-flight measurement of femtosecond pulses. Meas Sci Technol (2012) 23(6):065203. doi:10.1088/0957-0233/23/6/065203
3. Bosch T. Laser ranging: a critical review of usual techniques for distance measurement. Opt Eng (2001) 40(1):10. doi:10.1117/1.1330700
4. Wang Z, Xu L, Li D, Zhang Z, Li X. Online multi-target laser ranging using waveform decomposition on fpga. Ieee Sens J (2021) 21(9):10879–89. doi:10.1109/jsen.2021.3060158
5. Li ZP, Ye JT, Huang X, Jiang PY, Cao Y, Hong Y, et al. Single-photon imaging over 200 km. Optica (2021) 8(3):344–9. doi:10.1364/optica.408657
6. Hao Q, Cheng Y, Cao J, Zhang F, Zhang X, Yu H. Analytical and numerical approaches to study echo laser pulse profile affected by target and atmospheric turbulence. Opt Express (2016) 24(22):25026–42. Epub 2016/11/10. doi:10.1364/OE.24.025026
7. Chen J, Sun H, Zhao Y, Shan C. Typical influencing factors analysis of laser reflection tomography imaging. Optik (2019) 189:1–8. doi:10.1016/j.ijleo.2019.05.048
8. Pyo Y, Hasegawa T, Tsuji T, Kurazume R, Morooka K. Floor sensing system using laser reflectivity for localizing everyday objects and robot. Sensors (Basel) (2014) 14(4):7524–40. Epub 2014/04/26. doi:10.3390/s140407524
9. Wang C, Sun T, Wang T, Chen J. Fast contour torque features based recognition in laser active imaging system. Optik (2015) 126(21):3276–82. doi:10.1016/j.ijleo.2015.08.014
10. Wang Q, Wang L, Sun JF. Rotation-invariant target recognition in ladar range imagery using model matching approach. Opt Express (2010) 18(15):15349–60. doi:10.1364/oe.18.015349
11. Du P, Zhang F, Li Z, Liu Q, Gong M, Fu X. Single-photon detection approach for autonomous vehicles sensing. IEEE Trans Vehicular Technol (2020) 69(6):6067–78. doi:10.1109/tvt.2020.2984772
12. Zhang W, Fu X, Li W. The intelligent vehicle target recognition algorithm based on target infrared features combined with lidar. Comput Commun (2020) 155:158–65. doi:10.1016/j.comcom.2020.03.013
13. Zhao X, Sun P, Xu Z, Min H, Yu H. Fusion of 3d lidar and camera data for object detection in autonomous vehicle applications. Ieee Sens J (2020) 20(9):4901–13. doi:10.1109/jsen.2020.2966034
14. Li M-l, Hu Y-h, Zhao N-x, Qian Q-s. Modeling and analyzing point cloud generation in missile-borne lidar. Def Technol (2020) 16(1):69–76. doi:10.1016/j.dt.2019.10.003
15. Xue J-Y, Cao Y-H, Wu Z-S, Chen J, Li Y-H, Zhang G, et al. Multiple scattering and modeling of laser in fog. Chin Phys B (2021) 30(6):064206. doi:10.1088/1674-1056/abddab
16. Huang F, Qiu S, Liu H, Liu Y, Wang P. Active imaging through dense fog by utilizing the joint polarization defogging and denoising optimization based on range-gated detection. Opt Express (2023) 31(16):25527–44. Epub 2023/09/15. doi:10.1364/OE.491831
17. Jiang PY, Li ZP, Ye WL, Hong Y, Dai C, Huang X, et al. Long range 3d imaging through atmospheric obscurants using array-based single-photon lidar. Opt Express (2023) 31(10):16054–66. Epub 2023/05/09. doi:10.1364/OE.487560
18. Campbell JC, Itzler MA, Laurenzis M, McCarthy A, Halimi A, Tobin R, et al. Depth imaging through obscurants using time-correlated single-photon counting. In: Advanced photon counting techniques, XII (2018). doi:10.1117/12.2305369
19. Tobin R, Halimi A, McCarthy A, Laurenzis M, Christnacher F, Buller GS. Three-dimensional single-photon imaging through obscurants. Opt Express (2019) 27(4):4590–611. Epub 2019/03/17. doi:10.1364/OE.27.004590
20. Maccarone A, Drummond K, McCarthy A, Steinlehner UK, Tachella J, Garcia DA, et al. Submerged single-photon lidar imaging sensor used for real-time 3d scene reconstruction in scattering underwater environments. Opt Express (2023) 31(10):16690–708. Epub 2023/05/09. doi:10.1364/OE.487129
21. Maccarone A, McCarthy A, Ren X, Warburton RE, Wallace AM, Moffat J, et al. Underwater depth imaging using time-correlated single-photon counting. Opt Express (2015) 23(26):33911–26. Epub 2016/02/03. doi:10.1364/OE.23.033911
22. Zhang M, Li X, Wang L. An adaptive outlier detection and processing approach towards time series sensor data. Ieee Access (2019) 7:175192–212. doi:10.1109/access.2019.2957602
23. P Kowalski, and R Smyk, editors. Review and comparison of smoothing algorithms for one-dimensional data noise reduction. International interdisciplinary PhD workshop, 2018. IEEE: IIPhDW (2018).
24. Lin S-L, Wu B-H. Application of kalman filter to improve 3d lidar signals of autonomous vehicles in adverse weather. Appl Sci (2021) 11(7):3018. doi:10.3390/app11073018
25. Yu Y, Wang Z, Li H, Yu C, Chen C, Wang X, et al. High-precision 3d imaging of underwater coaxial scanning photon counting lidar based on spatiotemporal correlation. Measurement (2023) 219:113248. doi:10.1016/j.measurement.2023.113248
26. Jiao Z, Liu B, Liu E, Yue Y. Low-pass parabolic fft filter for airborne and satellite lidar signal processing. Sensors (Basel) (2015) 15(10):26085–95. Epub 2015/10/17. doi:10.3390/s151026085
27. Zhou Z, Hua D, Wang Y, Yan Q, Li S, Li Y, et al. Improvement of the signal to noise ratio of lidar echo signal based on wavelet de-noising technique. Opt Laser Eng (2013) 51(8):961–6. doi:10.1016/j.optlaseng.2013.02.011
28. Fang H-T, Huang D-S. Noise reduction in lidar signal based on discrete wavelet transform. Opt Commun (2004) 233(1-3):67–76. doi:10.1016/j.optcom.2004.01.017
29. Hou Y, Li S, Ma H, Gong S, Yu T. Weak signal detection based on lifting wavelet threshold denoising and multi-layer autocorrelation method. J Commun (2022) 890–9. doi:10.12720/jcm.17.11.890-899
30. Assmann A, Stewart B, Wallace AM. Deep learning for lidar waveforms with multiple returns. In: 28th European signal processing conference (EUSIPCO). NEW YORK: Electr Network (2021).
31. Xue H, Cui H. Research on image restoration algorithms based on bp neural network. J Vis Commun Image R (2019) 59:204–9. doi:10.1016/j.jvcir.2019.01.014
32. Mi H, Ai B, He R, Yang M, Ma Z, Zhong Z, et al. A novel denoising method based on machine learning in channel measurements. IEEE Trans Vehicular Technol (2022) 71(1):994–9. doi:10.1109/tvt.2021.3126432
33. Singh G, Sunmiao CP. Deep temporal filter: an lstm based approach to filter noise from tdc based spad receiver. In: 19th IEEE international Symposium on signal Processing and information technology (ISSPIT); 2019 dec 10-12; ajman, U ARAB EMIRATES. NEW YORK: Ieee (2019).
34. Arab H, Ghaffari I, Evina RM, Tatu SO, Dufour S. A hybrid lstm-resnet deep neural network for noise reduction and classification of V-band receiver signals. Ieee Access (2022) 10:14797–806. doi:10.1109/access.2022.3147980
35. Wang Z, Bovik AC, Sheikh HR, Simoncelli EP. Image quality assessment: from error visibility to structural similarity. IEEE Trans Image Process (2004) 13(4):600–12. Epub 2004/09/21. doi:10.1109/tip.2003.819861
36. Wang H, Sun X. Effect of laser beam on depolarization characteristics of backscattered light in discrete random media. Opt Commun (2020) 470:125971. doi:10.1016/j.optcom.2020.125971
37. Satat G, Tancik M, Raskar R. Towards photography through realistic fog. In: IEEE international conference on computational photography (ICCP). Pittsburgh, PA: Carnegie Mellon Univ (2018). NEW YORK.
38. Sang T-H, Tsai S, Yu TJISL. Mitigating effects of uniform fog on spad lidars. IEEE Sens Lett (2020) 4(9):1–4. doi:10.1109/lsens.2020.3018708
39. Kijima D, Kushida T, Kitajima H, Tanaka K, Kubo H, Funatomi T, et al. Time-of-Flight imaging in fog using multiple time-gated exposures. Opt Express (2021) 29(5):6453. doi:10.1364/oe.416365
Keywords: active laser imaging, cloud and fog environments, signal-to-noise ratio, structural similarity, matched filtering, long short-term memory neural network
Citation: Cui C, Zhang Z, Wang H and Zhao Y (2024) Enhancing signal-to-noise ratio in active laser imaging under cloud and fog conditions through combined matched filtering and neural network. Front. Phys. 12:1392509. doi: 10.3389/fphy.2024.1392509
Received: 27 February 2024; Accepted: 27 May 2024;
Published: 12 June 2024.
Edited by:
Sushank Chaudhary, Chulalongkorn University, ThailandReviewed by:
Rajan Miglani, Lovely Professional University, IndiaAbhishek Sharma, Guru Nanak Dev University, India
Copyright © 2024 Cui, Zhang, Wang and Zhao. This is an open-access article distributed under the terms of the Creative Commons Attribution License (CC BY). The use, distribution or reproduction in other forums is permitted, provided the original author(s) and the copyright owner(s) are credited and that the original publication in this journal is cited, in accordance with accepted academic practice. No use, distribution or reproduction is permitted which does not comply with these terms.
*Correspondence: Zijing Zhang, emhhbmd6aWppbmdAaGl0LmVkdS5jbg==; Yuan Zhao, emhhb3loaXRfcGh5QDE2My5jb20=
 Chengshuai Cui
 Zijing Zhang*
 Hongyang Wang