 Sajid Mahboob Alam1
 Muhammad Waheed Rasheed
95% of researchers rate our articles as excellent or good
Learn more about the work of our research integrity team to safeguard the quality of each article we publish.
Find out more
ORIGINAL RESEARCH article
Front. Phys. , 18 April 2024
Sec. Chemical Physics and Physical Chemistry
Volume 12 - 2024 | https://doi.org/10.3389/fphy.2024.1383216
Mycobacterium tuberculosis is an organism that causes tuberculosis (TB), a common infectious disease that has a high death and morbidity rate. Topological indices are mathematical tools used to describe the structural properties of molecules or networks. They provide a quantitative measure of the connectivity and complexity of a system, and play a crucial role in numerous area such as biochemistry and bioinformatics. The purpose of topological indices is to simplify complex structures into numerical values that can be easily analyzed and compared. QSPR modeling is a technique in chemistry that relates the structure of a chemical compound to its physical or chemical properties. It is used to predict properties like boiling points, solubilities, toxicities, and even biological activities of compounds. This saves time, resources, and enables researchers to make informed decisions in drug discovery, material science, and many other areas. In this study, we conducted an analysis of several drugs used for the treatment of tuberculosis. We focused on computing the reducible topological indices based on their degrees. Several techniques and approaches are employed. To perform calculations, we used edge partition methodology, analytical techniques, theoretical graph utilities, and degree counting method. Additionally, we examined six physicochemical properties of these drugs. To establish quantitative structure-property relationship models and evaluate their effectiveness, we employed linear, quadratic, and logarithmic regression analysis. By analyzing the reducible topological indices and physicochemical properties, we aimed to gain a deeper understanding of the drugs’ characteristics and their potential impact on tuberculosis treatment. This study established a significant relationship between the defined indices with two key properties: molar mass and collision cross section. The correlation coefficients for molar mass range from 0.7 to 0.9, while the collision cross section range from 0.8 to 0.9. These results demonstrate a strong association between the indices and the properties under investigation. Furthermore, it is worth noting that both molar mass and collision cross section satisfy the requirements for p-value and F-test value across all indices. This indicates the statistical significance of the observed correlations and the reliability of our findings.
A dreadful disease in which a conflict between the soul and the body is so gradual, calm, and solemn, with such a sure outcome, that the mortal half rots away day by day and grain by grain. A disease that “sometimes moves in enormous steps and sometimes at a tardy, sluggish pace, but, slow or quick, is always sure and certain.” (Nicholas Nickleby; Charles Dickens). The things Charles Dickens said are still true today [1].
Bacteria called Mycobacterium tuberculosis (MTB) are typically responsible for the infectious disease known as tuberculosis (TB). Typically, tuberculosis primarily targets the lungs; nevertheless, it has the ability to impact various other regions of the body. In cases where there are no symptoms, it is referred to as latent tuberculosis [2]. Active disease occurs in about 10 percent of latent infections and, when untreated, results in a mortality rate of approximately 50 percent among those affected. TB is a global disease, although the majority of cases occur in low and middle-income nations. There are eight countries, namely, Bangladesh, China, India, Indonesia, Nigeria, Pakistan, Philippines, and South Africa, where approximately half of all individuals with TB can be located. It is believed that approximately 25 percent of the world’s population carries a TB infection; however, the majority of individuals do not progress to acquire TB disease, and a small percentage may be able to overcome the infection. It cannot be spread by those who are infected but not (yet) unwell with the illness. The lifetime chance of developing tuberculosis is 5–10 percent for those with TB bacterium infection. Individuals with weakened immune systems, including those with HIV, diabetes, malnourishment, or tobacco use, are more susceptible to illness. People who are most likely to contract tuberculosis (TB) often fall into two distinct categories:
1. Those who have recently become infected with TB bacteria.
2. Those with weakened immune systems due to underlying medical conditions.
People who have active tuberculosis in their lungs cough, spit, speak, or sneeze can transmit the disease to others through the air. Latent tuberculosis patients do not transmit the illness. Figure 1 represented a general overview of the prevalent ways that Mycobacterium tuberculosis infections occur. In this illustration, the bacterium is released by an infected person (A) through sneezing or coughing, at which point the pathogen exits from person (A)’s body and comes as an aerosol. At B point, a healthy individual (B) inhales particles in the air containing MTB. The next stage is typically a pulmonary infection when the virus reaches the effective titre in person (B). When someone self-inoculates, the infection travels from the lung to the gastrointestinal tract. Because it occurs when person (B), who has pulmonary tuberculosis, swallows his own contaminated sputum, the term “self-inoculation” is employed.
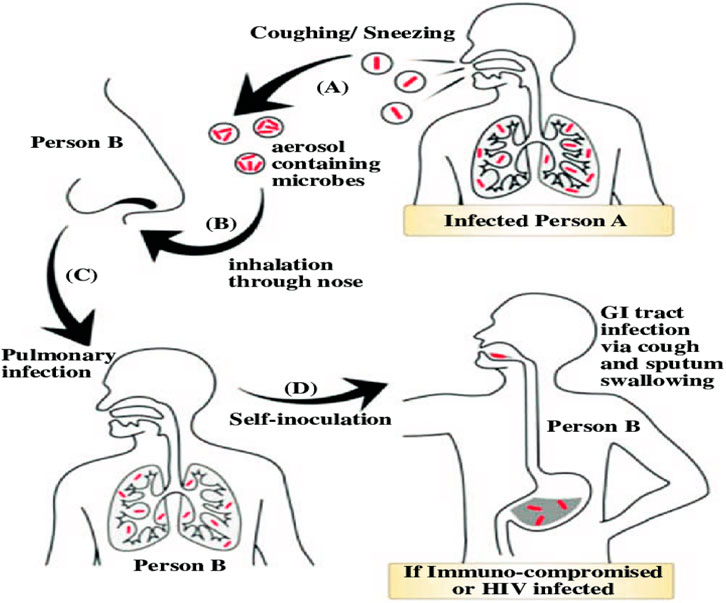
Figure 1. The common methods through which Mycobacterium tuberculosis causes infections are portrayed in the overall image.
TB illness symptoms vary depending on the location of the TB bacteria’s growth within the body. The lungs are where TB germs typically grow called pulmonary TB. Chest pain, coughing up blood or sputum (phlegm from deep inside the lungs), and a severe cough lasting 3 weeks or longer are some of the signs of tuberculosis (TB) sickness in the lungs. Additional indications of tuberculosis illness include weakness or exhaustion, appetite loss, weight loss, chills, fever, and night sweats. TB illness symptoms vary depending on the affected area of the body. Individuals with latent tuberculosis infection do not exhibit any symptoms, do not feel ill, and are unable to infect others. Other types of tuberculosis (TB) are caused when the infection travels outside the lungs in 15–20 percent of active patients. All of these conditions are referred to as extrapulmonary tuberculosis [3, 4]. Extrapulmonary tuberculosis (TB) is more common in young children and those with weaker immune systems. This affects people who possess HIV in over 50 percent of situations. Tuberculosis can affect more than just the lungs. It can spread to different parts of the body, leading to extrapulmonary infections. Notable sites of infection include the pleura, which is the lining around the lungs, resulting in tuberculous pleurisy. The central nervous system can also be affected, causing tuberculous meningitis. The lymphatic system, responsible for immune function, can be infected, leading to scrofula of the neck. The genitourinary system, involving the reproductive and urinary organs, can also be targeted, resulting in urogenital tuberculosis. Additionally, tuberculosis can affect the bones and joints, causing Pott disease of the spine. These are just a few examples of the various extrapulmonary infection sites associated with tuberculosis. Figure 2A presented the main symptoms of variants and stages of tuberculosis.
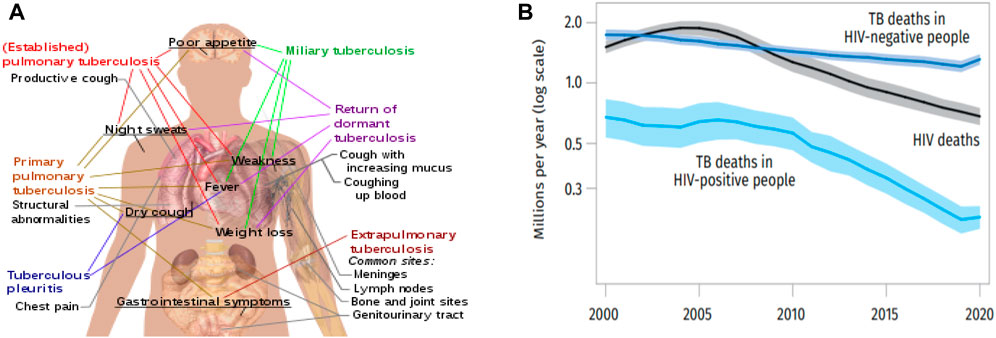
Figure 2. (A) Symptoms of Tuberculosis (B) The global chart of the death rate of TB and HIV from 2000 to 2020.
It was estimated in 2018 that 25 percent of people on the planet may be subconsciously infected with tuberculosis. Every year, approximately 1 percent of the population contracts a new infection. After COVID-19, TB is the second most common infectious disease-related cause of mortality in 2020, with an anticipated 10 million cases of active TB and 1.5 million people dying. As of 2018, the majority of tuberculosis (TB) cases were reported in three regions: South-East Asia (44%), Africa (24%), and the Western Pacific (18%). Interestingly, more than half of all cases were diagnosed in just seven countries, namely, India (27%), China (9%), Indonesia (8%), the Philippines (6%), Pakistan (6%), Nigeria (4%), and Bangladesh (4%) [5]. These statistics shed light on the global distribution of TB, highlighting the concentration of cases in specific regions and countries. By 2021, there were only about 2% more new cases per year on average. When it comes to tuberculin testing, almost 80% of individuals in several Asian and African nations test positive, compared to 5%–10% of Americans. Humans have had tuberculosis from ancient times [6]. More than 2 million people globally per year pass away from tuberculosis (TB), the most common infectious disease-related cause of mortality. Around the world, one in three people, or 2-3 billion people, are estimated to be infected with Mycobacterium tuberculosis (M. tuberculosis), with a lifetime risk of active TB disease of 5%–15%. An estimated 9.6 million individuals were diagnosed with TB in 2014, and 1.5 million died from it, including 1.1 million HIV-negative people and 400,000 people living with HIV. Although TB exists in every country, the majority of TB patients live in low- and middle-income nations, particularly in areas like Sub-Saharan Africa and South East Asia [7]. Since 2000 until 2020, Figure 2B illustrates the worldwide trends in estimated death counts attributed to TB and HIV.
Antibiotics are used in the treatment of tuberculosis. Both the illness and infection from tuberculosis should be treated. The most often prescribed antibiotics include Lumefrantrine, Mefloquine, Piperaquine, Isoniazid, and Primaquine, among others. These drugs must be used consistently for 4–6 months in order to be effective. It is risky to quit taking the drugs too soon or without consulting a doctor. This may cause TB that is still alive to develop medication resistance.
The field of mathematics known as “graph theory” is devoted to the study of graphs’ characteristics and uses. A graph is a type of mathematical structure made up of edges (links) connecting nodes (vertices). These nodes and edges can be represented a numerous real-world scenarios, including social networks, transport systems, and computer networks. Graph theory offers a structure for using graph representations to analyze and solve difficult issues. The concept of the degree of a node in graph theory identifies the quantity of edges that are connected to that node. In order to grasp the connectivity and structure of a graph, it is crucial to understand this concept. An important area of study in graph theory is graph coloring, where colors are designated to nodes within a graph to prevent neighboring nodes from sharing the same color. This concept is helpful in the realms of scheduling, resource allocation, and solving challenges related to map coloring. Graph theory plays a critical role in computer science, operations research, and biology due to its diverse range of practical applications. The idea of graph algorithms is crucial in solving problems related to network routing, social media analysis, and data visualization in computer science. Applying graph theory in operations research leads to the optimization of transportation networks, supply chains, and communication systems. The application of graph theory in the field of biology enables researchers to map out the connections among genes, proteins, and diseases, resulting in breakthroughs in network biology and personalized medicine. In general, graph theory is an effective tool that keeps discovering new uses in a variety of scientific and commercial fields.
The study of mathematical models of chemical phenomena using graph theory is known as chemical graph theory. Chemical graph theory has a subfield called topological indices that correlates specific physico-chemical characteristics of the underlying chemical molecule. Numerous publications on topological indices have been published to date, numbering in the hundreds [8]. A topological index is a function called “Top” from a set of finite simple graphs to the set of real numbers, where “” is the property that Top(G) = Top(H) if both G and H are isomorphic. A topological index is a numerical value related to chemical structure which asserts to show a relationship between chemical structure and various physico-chemical qualities, chemical reactivity, or you could say biological activity [9]. In reality, topological indices are created by converting a molecular graph into a number that describes the topology of that graph. In molecular modeling, we investigate the connection between the structure, characteristics, and activity of chemical substances. Molecular descriptors have a key part in the main chemical structure-related fields like chemistry, pharmacology, etc [10]. In 1998, the generalized Randi index was introduced independently by Bollobas et al. [11] and Amic et al. [12]. Mathematicians and chemists both studied this index [13–17]. Quantitative structure–activity/property/toxicity relationships (QSAR, QSPR, QSTR) modelling is a well-known and well-established field of study. In this type of modelling, physicochemical and molecular descriptors are associated with a bioassay of a medication that is designed to elicit a conventional pharmacological response. These connections have been recognized for a long time as an essential part of the drug discovery and development process. They provide major insights into the role that molecular characteristics play in the biological activity of compounds that are both similar to one another and unrelated to one another. The descriptor-based QSPR techniques make use of the entire structure of the compounds by modelling the property as a function of chemical descriptors. This allows for the most accurate predictions possible. These descriptors might simply be the quantity of such atoms, or they could be features that characterize the linkages between atoms or the form of the molecule in three dimensions. In this manner, a 1D descriptor is a one-dimensional linear representation of the molecule, 2D descriptors are a representation of the molecule in two dimensions on a plane, and 3D descriptors are a representation of the molecule in three dimensions of space. The majority of topological and connectivity indexes can be rearranged using two-dimensional descriptors. Three-dimensional descriptors provide a concise summary of the geometry, the surface, and the volume of the molecule. Quantitative structure-activity relationships (QSARs) are mathematical models created to correlate several types of biological activity, chemical reactivity, equilibrium, physical, and physicochemical qualities [18]. In the developing of QSAR models, twenty primary categories of mistakes have been identified by Dearden et al. They do this by utilizing bad data, overfitting, and bad training and test sets [19]. Simply see Figure 3 for the general overview of the QSPR method. Check out [20–24] for further details on QSPR analysis across various different fields.
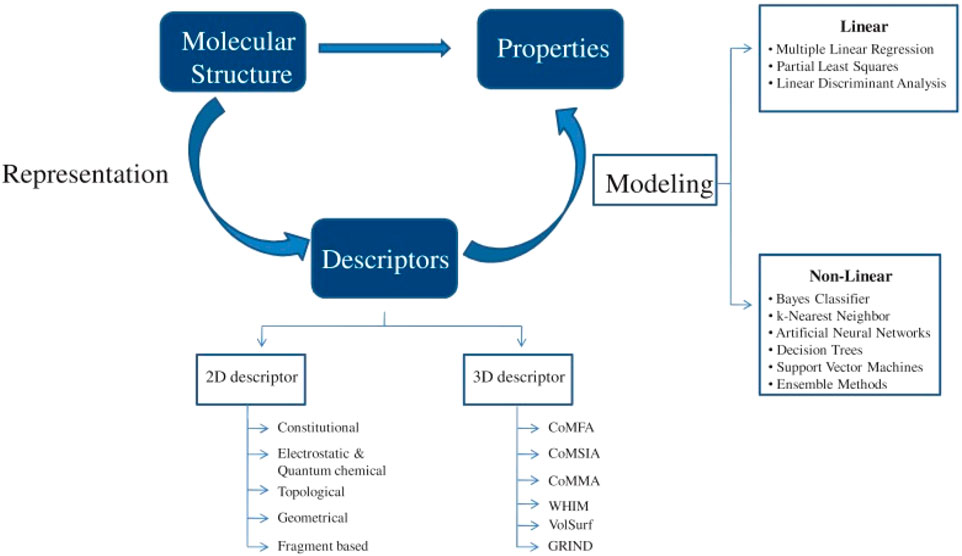
Figure 3. General methodology of a QSPR study.
The main objective of this article is to develop a quantitative structure-property relationship (QSPR) analysis for tuberculosis (TB) drugs.
• Firstly, we collected data on 13 drugs used in the treatment of TB, along with their six physicochemical properties. These properties were obtained from reputable online sources such as PubChem and ChemSpider.
• Next, we calculated the numerical results of ten degree-based reducible indices to analyze the molecular structure of the 13 TB drugs. Three techniques, namely, edge partition, vertex degree, and counting degree, were used to calculate the ten discussed reducible indices.
• The QSPR analysis was then used to establish a strong positive relationship between the indices and properties. To conduct this analysis, we employed three regression equations: linear-regression, quadratic-regression, and logarithmic-regression. These models were chosen for their strong significance in determining the relationship between the properties and indices.
• One of the statistical parameters used, known as the correlation coefficient (r), provides insight into the reliability and significance level between the physical properties and calculated the numerical values of the TB drugs.
• Finally, we utilized line graphs to visually compare all correlation coefficients based on the numerical data. This graphical representation allows for a comprehensive discussion of the relationships between the properties and indices.
In various fields, this paragraph covers the novel progress in the topic of topological indices. In 2023, Abid Mahboob et al. [25] introduced eight novel indices based on the degrees method. They determine the QSPR analysis by utilizing linear, quad, and log models to establish relationships between the novel indices and physical properties of 18 molecular structures of cancer drugs. The significance of all the results is evident as they meet the criteria of a p-value
Let G= [V(G), E(G)] be a simple graph having |V(G)| the order and |E(G)| the size of a graph, where V(G) is considered as node set and E(G) ⊆ V(G) × V(G) is a bond set. Every vertex is considered as an atom in a graph, and bonding within the two atoms is known as edge. The valency or degree of any node is the number of total edges which are incident to the node. Now, few useful reducible TI’s is explained which is given below:
Gutman and Trinajstic [32] introduced the two graph invariants known as the first Zagreb index, denoted as M1, is a graph theoretic concept used to measure the molecular size or shape of a chemical compound. It takes into account the sum of the degrees of all the vertices in a molecule. On the other hand, the second Zagreb index, denoted as M2, calculates the sum of products of degrees for pairs of adjacent vertices in a graph. This index is related to the presence and distribution of bond lengths within a compound. These indices serve as valuable tools in exploring and understanding molecular structures with significant applications across diverse fields including drug discovery, material science, and environmental monitoring. S.R. Islam and M.Pal examined the relationship between the second Zagreb index and physicochemical properties in QSPR research of fuzzy octane isomers graphs [33]. It is their conclusion that this index provides a significantly accurate estimation of the acentric factor and entropy. For instance, the value of acentric factor and entropy for octane isomers are taken from [34]. They calculate the correlation coefficient of M2 with acentric factor is −0.977966531 and the correlation coefficients of the M2 with entropy is −0.91961647. These outcomes declare the appropriateness of this index for octane isomers in chemical compounds. The Zagreb indices and their variations have been utilized to study ideas such as heterosystems, chirality, ZE-isomerism, and molecular complexity.
Abid Mehboob et al. [25] were motivated by the framework of these indices to propose the idea of reducible first and second Zagreb indices. In QSPR modeling and chemical informatics, these indices has produced outstanding outcomes by establishing links between the structural characteristics of molecules and their corresponding properties or activities. RM1 is the notation for this index, which represents the total sum of the “n” degrees of all vertices in a relevant molecular graph, while RM2 denotes the second reducible zagreb index, defined as the summation of products of the “n” degrees for pairs of adjacent vertices in a molecular graph. In which du and dv represent the degrees of the vertices while “n” indicates the order of the vertices. These indices are defined mathematically as:
Some of the most well-known topological indices in regard to chemistry and chemical graph theory was proposed by Milan Randic in 1975 [35] and is useful for evaluating the degree of branching of the carbon atom skeleton of saturated hydrocarbons. The first genuine degree-based topological index in history was the Randic index. This index can help chemists predict certain properties of molecules such as boiling points or toxicity levels. By knowing the level of complexity in a molecule using the randic index, scientists can make informed decisions about its behavior and potential uses. Mingao Yuan derived the limits of the Randic index and its variants for an inhomogeneous Erdos–Rényi random graph [36]. These results shed light on the impact of network heterogeneity on the indices and offer new insights into the Randic index and its variants.
In order to calculate the reducible randic index, you need to add up the square root of the distance between each bond. This distance is calculated by multiplying the “n” degrees of the vertices in a molecular graph. This index are defined mathematically as:
Zhou and Trinajstic [37] were the ones who initially brought the idea of the sum connectivity index. This index was developed by drawing inspiration from the Randic-index. It is a concept used in chemistry to measure how connected different atoms are within a molecule. It is a way to determine the overall structural complexity of a molecule and its ability to interact with other molecules. This index is takes into account factors like bond lengths, angles, and types of bonds between atoms to calculate a numerical value. Muhammad Hussain et al. [38] have conducted a comprehensive analysis to determine the sum connectivity index for three subdivisions of the H3BO3 layer structure. These subdivisions include the subdivision S(H3BO3), the line graph L(H3BO3), and the caged chain C(H3BO3). The researchers employed various mathematical and computational methods to accurately calculate the sum connectivity index for each subdivision. The correlation between this index and the straight line graph is significant [39].
A novel index known as the reducible sum connectivity index has been introduced. It is calculated by summing the square root of each bonds distance, where the distance is obtained by summing the “n” degrees of the connecting vertices, and has a mathematical definition as:
Shirdel et al. [40] presented the concept of the hyper Zagreb index, which is a molecular descriptor referred to as distance-based Zagreb index. These indices are numerical values that provide important information about a molecule’s structure. The first hyper Zagreb index is obtained by summing up the squares of the degrees of all vertices in a molecule. On the other hand, the second hyper Zagreb index is calculated by multiplying the degrees of adjacent vertices and then summing them all up. By examining both indices, researchers can gain insight into the complexity of a molecule and make predictions about its chemical properties. Ishita Sarkar and Manjunath Nanjappa [41] conducted a study on the combinatorial inequalities related to edges, vertices, and their corresponding neighborhood notions. They also incorporated other molecular descriptors in their calculations to determine the exact expressions of the second hyper-Zagreb index for specific corona products involving the semi-total point graph. Abdul Hakeem et al. [42] studied the QSPR analysis on heart attack disease using degree-based indices. The researchers found that the first hyper Zagreb index exhibited a robust correlation with molecular weight and boiling point within the range of 0.9. Similarly, the second hyper Zagreb index demonstrated a strong correlation with boiling point within the same range.
In the molecular graph, the reducible first hyper Zagreb index is obtained by summing up the squares of the “n” degrees of all vertices. On the other hand, the reducible second hyper Zagreb index is calculated by multiplying the “n” degrees of adjacent vertices and then summing them all up. Mathematically these indices is defined as:
The concept of Albertson index served as motivation for Gutman, leading him to propose the idea of the Sigma index [43]. His paper explores the inverse problem concerning the sigma index, demonstrating that an even value will always be obtained for this index in any given graph. Merve and Ismail conducting a calculation of the sigma index for various graphs, adding the subdivision of the cycle graph Cn, the graph of S(G), and the r-subdivision graph of Sr(G) [44]. Additionally, they provide examples of well-known graph cycles. Ozge Colakoglu Havare [45] studied the QSPR analysis with curvilinear regression model by using various molecular descriptors including Sigma index for the monocarboxylic acids.
The reducible sigma index can be obtained by subtracting the squares of the “n” degrees of each vertex in a molecule. This index is mathematically defined as:
Furtula and Gutman conducted an analysis on the latest version of Zagreb indices, referred to as the Forgotten index [46]. Its definition lies in using the sum of cubes of degrees in molecular graphs to examine the influence of structure dependency on different properties. The purpose of presenting this index is to demonstrate its numerous significant features and emphasize its exceptional effectiveness in enhancing the chemical attributes of the original Zagreb index. This index plays a crucial role in significantly enhancing the physico-chemical applicability of the first Zagreb index. Some upper bounds for the F-index and certain applications were computed by Hosamani [47]. The precise formulas for the graph operations with regards to the F-index were calculated by Nilanjan and other authors [48]. Recently, the reducible forgotten index is introduced which is mathematically defined as:
The first and second Gourava indices were introduced by V.R. Kulli [49], who drew inspiration from the definition of the Zagreb indices and their extensive usage. In calculating this index, Kulli applies the equation’s definition to both armchair and zigzag edge polyhex nanotubes, with a particular focus on a few well-known graph types. Ying Wang et al. [50] prove the graphs uniqueness on trees with given independence numbers with maximum both 1st and 2nd Gourava indices. The mathematical definition of the reducible first and second Gourava indices was recently introduced, which is stated as:
Topological indices are derived from various mathematical approaches, and one of the most popular methodologies is based on vertex degrees. The degree of a vertex in a graph represents the number of edges connected to it. By analyzing the distribution of degrees in a system, we can obtain valuable information about its structural features and properties. Degree-based topological indices are calculated using mathematical formulas that take into account the degrees of vertices in a graph. We took several steps to get at the results, including gathering data on the pharmaceutical properties of medications used to treat tuberculosis disease. The data for these properties has been collected from the PubChem website. The numerical values of the molecular descriptors are determined by employing the techniques of vertex degree and edge division. This method involves grouping or bundling the edges and vertices based on their specific attributes. To develop the QSPR analysis, a three regression-equation (linear-regression, quadratic-regression, and logarithmic-regression) and eight statistical parameters (including p-value and F-test value) were employed. Analyzing and predicting data patterns is made easier with the use of these valuable models. The coefficient correlation r results of these three regression-model are determined through the use of the SPSS software. The illustration of the 2D molecular structures of these medications is achieved through the use of software applications like Chem-Draw and Chem-Doodle. By visually representing the intricate structures, these software enable a deeper understanding of the chemical properties of various compounds. Bar graphs have been employed to visually represent the comparisons of all correlation values. These graphs are created through Microsoft Excel. All indices can be calculated using software like Matlab, whereas Maple has been exclusively designed for graph sketching purposes. This methodology has the advantage that all the indices can be computed rapidly. This manuscript presents a concise and comprehensible flowchart of the work, using Figure 4 to make it easy and understandable for readers.

Figure 4. Flowchart of this manuscript.
This section provides an overview of the structural information and computational analysis of reducible indices for the treatment of tuberculosis (TB) disease. The article primarily focuses on the planar and 2D forms of drugs, disregarding their actual 3D structures. Within this context, the discussion revolves around thirteen prominent anti-tuberculosis drugs, namely, Isoniazid, Pyrazinamide, Ethionamide, Levofloxacin, Amikacin, Ofloxacin, Cycloserine, 4-aminosalicyclic acid, Ethambutol, Ciprofloxacin, Bedaquiline, Kanamycin, and Streptomycin. The thirteen anti-tuberculosis drugs mentioned have been extensively studied and utilized in the treatment of TB. Each drug possesses unique characteristics and mechanisms of action, making them valuable tools in combating this infectious disease. Figure 5 visually displays the chemical structures of these medicine, which are commonly used to treat tuberculosis disease. Additionally, this section provides a comprehensive overview of both the experimental data and the calculation of reducible indices. The six physicochemical properties: molar mass, XLOGP3, Complexity, LOGP, melting point and collision cross section were obtained from the PubChem website and are presented in Table 2. The values of the ten degree-based reducible topological indices were computed using the formulas illustrated in Table 1. All the indices considered in this study are based on vertex and edge degrees. It is noting that a total of thirteen structures were analyzed, each exhibiting eight distinct types of edge bundles. In addition, the maximum vertex degree is restricted to four, and thus the node degree varies between one and four. Therefore, these eight edge bundles are:
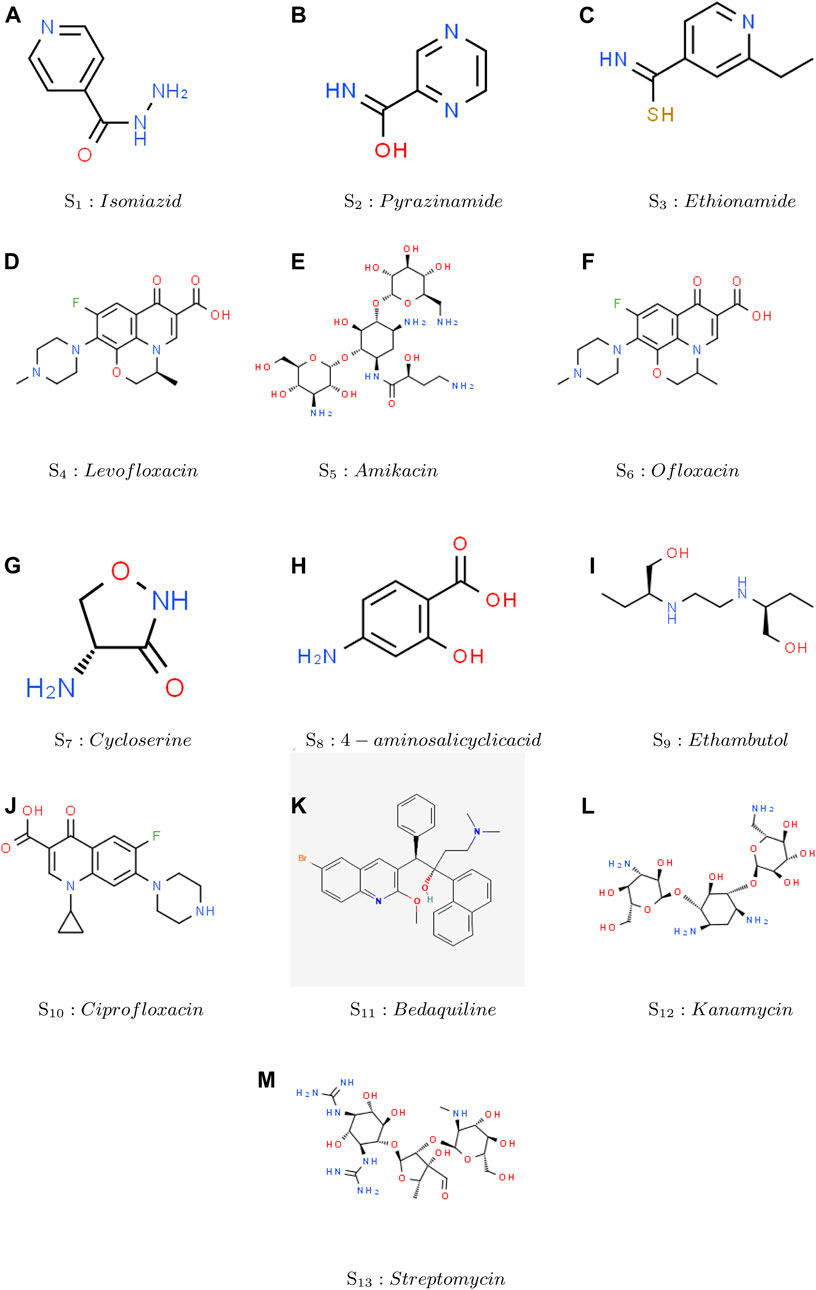
Figure 5. Thirteen Chemical structure of drugs used to treat Tuberculosis disease.
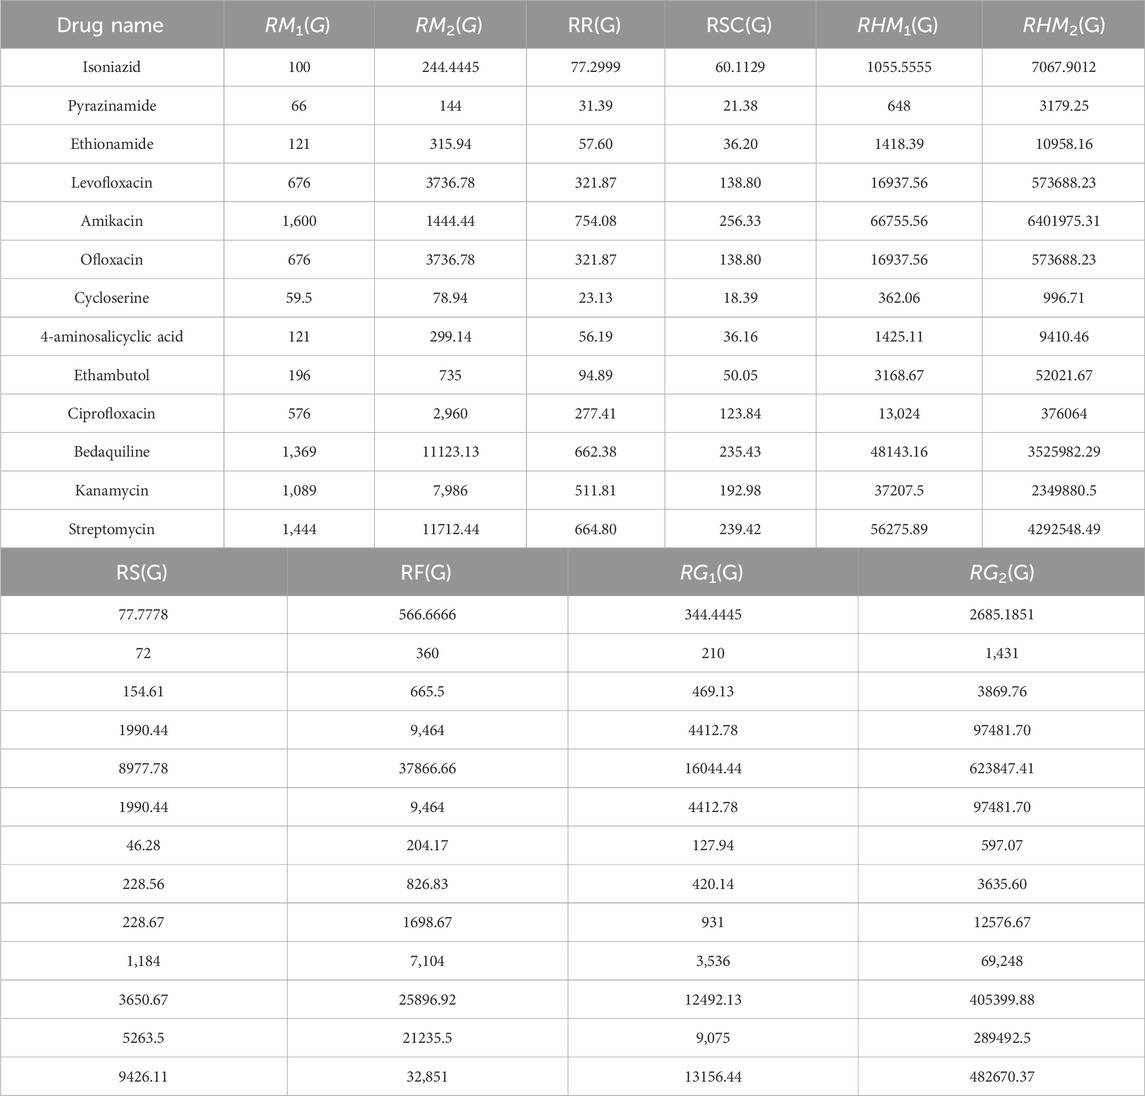
Table 1. Thirteen drugs related to tuberculosis disease with their calculated reducible topological indices.
The use of isoniazid, along with other medications, is necessary to treat active tuberculosis (TB) infections. Additionally, when an individual tests positive for TB through a skin test and is suspected of having the infection, isoniazid is administered alone to prevent the development of active TB infections. As an antibiotic, isoniazid functions by preventing bacterial growth. Only bacterial illnesses are treated by this antibiotic. Conversely, it proves ineffective against viral illnesses such as the flu or the common cold. The molecular formula of isoniazid is C6H7N3O. It consists of carbon (C), hydrogen (H), nitrogen (N), and oxygen (O) atoms. Figure 6 illustrates the 2D molecular structure of Isoniazid. The molecular structure of Isoniazid, denoted as G, is composed of 10 vertices (dots) and 10 edges (lines). To analyze this structure, a technique of degree-based has been employed. The vertex set of this structure, V(Isoniazid), consists of vertices Vv, where v ranges from 1 to 10. Similarly, the edge set, E(Isoniazid), is formed by the edges {v1v2, v2v3, v3v4, … , v9v10}. There are three vertex partitions, namely, V1, V2, and V3, that can be identified within this structure. In the given graph G, V1 represents the set of vertices that have a degree of 1. These vertices are connected to only one other vertex in the graph. On the other hand V2, consists of vertices that have a degree of 2, meaning they are connected to two other vertices in the graph. Lastly, V3 represents the set of vertices that have a degree of 3, indicating that they are connected to three other vertices in the graph. Therefore, five edge bundles of this structure is obtained. The cardinalities of these bundles are as follows: |E(1,2)| = 1, |E(1,3)| = 1, |E(2,3)| = 3, |E(3,3)| = 1, and |E(2,2)| = 4. These edge bundles are utilized to compute all ten defined reducible indices of the isoniazid structure, which will be discussed below. The same methodology can be applied to determine the remaining indices of other drug structures.
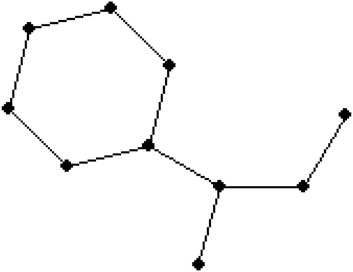
Figure 6. Molecular structure of the Isoniazid drug.
Regression models are fundamental tools in statistics that allow us to understand and analyze the relationship between variables. By fitting a regression model to a dataset, we can make predictions, uncover patterns, and gain insights into the underlying factors that influence a particular outcome. Regression analysis is like playing matchmaker for numbers. It helps us understand the relationship between different variables and predicts how they interact with each other. Basically, it is a statistical method to find patterns and connections within data. Regression models come in different types, Some popular types include linear regression, non-linear regression, and multiple regression analysis. This article covering three regression models such as linear-regression, quadratic-regression and logarithmic-regression.
Linear regression is like a good old-fashioned straight line. It is the simplest type of regression where we try to fit a line that best represents the relationship between an independent variable and a dependent variable. The variable used for prediction is referred to as the dependent variable (Y), while the term used to predict the value of another variable is known as the independent variable (TI). The linear regression equation is in the form:
Quadratic regression is a statistical modeling technique that allows us to analyze the relationship between a dependent variable and one or more independent variables. It is an extension of linear regression, where the relationship between variables is assumed to be quadratic rather than linear. Quadratic regression allows us to model relationships with a curved pattern, capturing more complexity than linear regression. The quadratic regression equation is a fancy way of expressing a curved relationship between variables. In quadratic equation (Y) is the dependent variable, (TI) is the independent variable, and a, b, and c are coefficients that determine the shape of the curve. The quadratic regression model comprises three important components: the intercept (a), the linear coefficient (b), and the quadratic coefficient (c). These components determine the position, slope, and curvature of the curve, respectively. The quadratic regression equation is in the form:
One commonly used type of regression model is logarithmic regression. Logarithmic regression offers a unique approach to exploring a relationships by fitting a logarithmic function to the data. Logarithmic regression is a type of regression analysis where the relationship between the dependent variable (Y) and the independent variable (TI) is modeled using a logarithmic function. Unlike linear regression, which assumes a linear relationship between the variables, logarithmic regression acknowledges that the relationship may not be linear and allows for a more flexible curve. The logarithmic regression equation is in the form:
The ten reducible indices mentioned above serve as models for six physical properties: molar mass, XLOGP3, Complexity, LOGP, melting point, and collision cross section of the thirteen molecular structures of the anti-tuberculosis drugs. Eqs 5.1–5.3, presented above, are employed to determine the regression equations for degree-based reducible TIs. These equations represent the linear model, quadratic model, and logarithmic model. All three models have been derived using SPSS statistical software. These models are widely used in various fields, including economics, finance, marketing, and social sciences. They provide a quantitative approach to understand the relationships between variables and make predictions based on the available data. By examining the patterns and trends in the data, these regression models help us gain valuable insights and make informed decisions.
QSPR (Quantitative Structure-Property Relationship) modeling has emerged as a powerful tool in the field of computational chemistry to predict the properties and behaviors of chemicals and materials. In order to build reliable and accurate QSPR models, it is crucial to understand and utilize statistical parameters effectively. Statistical parameters play a crucial role in model selection. They help us identify the model that best captures the underlying relationship between chemical structure and property. By comparing statistical parameters across different models, we can determine which one is more accurate, precise, and reliable for making predictions. This ensures that we choose the most appropriate model for our specific needs. In QSPR modeling, several statistical parameters are used to assess model performance. These include correlation coefficient (R and R2), F-test value and p-value. By examining these parameters, we can determine whether our models are dependable and can consistently provide accurate predictions. This study delves into the discussion of eight statistical parameters for reducible topological indices within three regression models of QSPR. The variable “N” represents the size of the data set, which can vary from 9, 12, and 13. In correlation (r), there are three possible cases. The first case occurs when r
The F-test is a statistical test used to compare the variances of two populations. In simpler terms, it helps determine if the means of two groups are significantly different from each other, by comparing the variation within the groups to the variation between the groups. The p-value associated with the F-test indicates the probability of observing the data if the null hypothesis (usually that there is no difference between the groups) is true. A low p-value (typically below 0.05) suggests that there is strong evidence against the null hypothesis, meaning the difference between the groups is unlikely to be due to random chance alone. The evaluation of our model’s reliability is greatly enhanced by the utilization of two test values: the p-value and the F-test value. These values help us determine whether the relationship between properties and indices is significant or not.
In statistical analysis, a p-value ⩽0.05 and an F-test value
Bar graphs are a popular and effective way to visually represent data. The use of rectangular bars of different lengths to show the magnitude of data points and make comparisons between different categories or groups for numerous drugs. By presenting data in a graphical format, bar graphs make it easier for people to understand and interpret information quickly. In bar graphs, the x-axis and the y-axis are commonly known as the two axes used. The horizontal axis (x-axis) represents the all reducible indices, while the vertical axis (y-axis) showcases the values of all correlation related to properties. These vertical or horizontal rectangles represent the magnitude or value of each category. The length or height of the bars is proportional to the data which are represent. In each graph, the squared symbol denotes data points associated with the linear, quadratic, and logarithmic model. Microsoft excel has been used to create these graphs. In Figure 7, there is a visual representation of the compared correlation graph showing the relationship between various reducible degree-based indices and characteristics of tuberculosis drugs. Every single graph was created using the data from Tables 13–15. Figure 7 reveals a clear visualization of the range of r values.
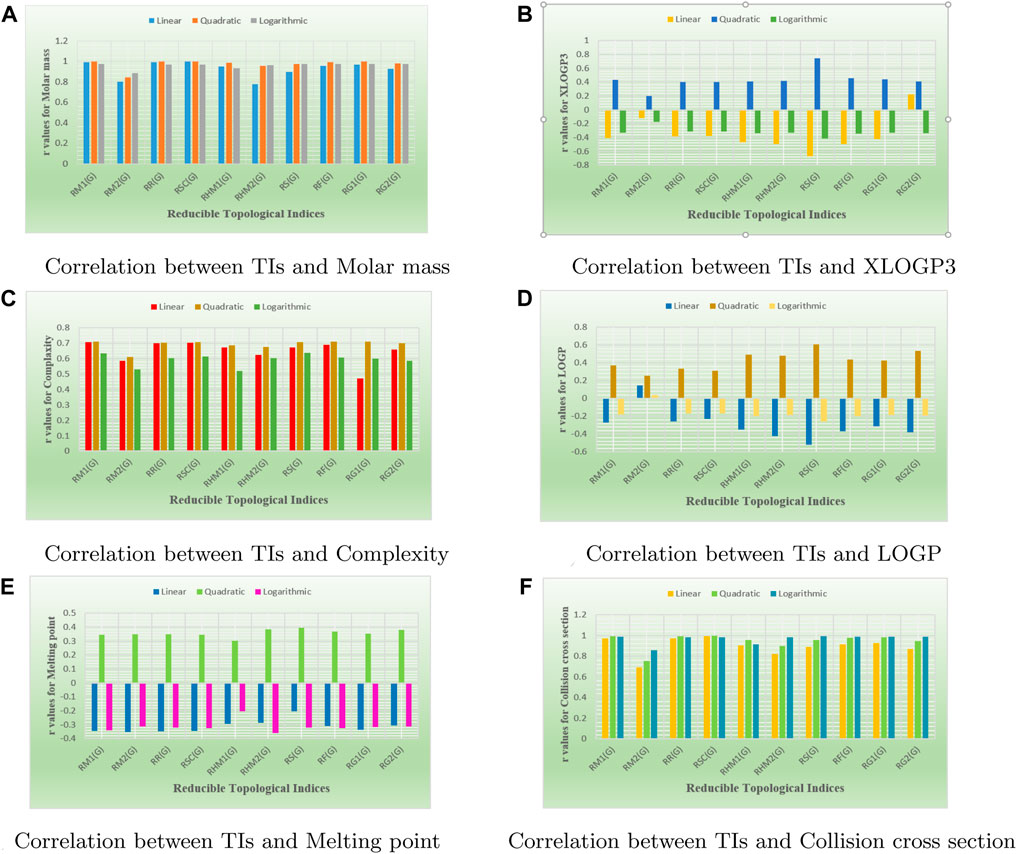
Figure 7. Bar graphs visually compared the r values between properties and reducible TIs.
Figure 7A illustrates the comparison of correlation values with blue, orange, and grey bars representing the linear-model, quadratic-model, and logarithmic-models, respectively. The correlation values between reducible indices and molar mass range from 0.77 to 0.99. In Figure 7B, the inverse correlation values for the linear and quadratic models lie between −0.1 and −0.6. However, only RG2(G) does not exhibit an inverse relationship in the linear model, as its correlation value is 0.2256. On the other hand, the range of positive correlation values for the quadratic model lies between 0.1 and 0.7. The correlation r results for the three models in Figure 7C are all positive and range from 0.4 to 0.7. In Figure 7D, the inverse correlation values for the linear and quadratic models lie between −0.1 and −0.5. However, only RG2(G) does not show an inverse relationship in the linear and quadratic models, as its correlation values are 0.1487 and 0.0358. On the other hand, the range of positive correlation values (r) for the quadratic model lies between 0.2 and 0.6. In Figure 7E, both the linear and quadratic models exhibit an inverse relationship due to their negative correlation values, which fall to −0.3. However, the quadratic model demonstrates positive correlation values ranging from 0.30 to 0.39. Lastly, in Figure 7F, all models exhibit a positive relationship, ranging from 0.6 to 0.9.
The main objective of this portion is to discuss a QSPR analysis that focuses on ten specified reducible topological indices (TIs) and six distinct properties associated with tuberculosis disease. The mentioned properties comprise molar mass, XLOGP3, Complexity, LOGP, melting point, and collision cross section. The data for these properties has been sourced from the PubChem website and is presented in Table 2. Vertex partitions and edge partitions, which are degree-based TIs techniques, have been employed to compute the numerical values corresponding to the reducible molecular descriptors. The values obtained through calculation for all indices are present in Table 1. The association between reducible topological descriptors and physicochemical characteristics for anti-tuberculosis drugs has been determined in the three QSPR models that were examined. The statistical parameters were computed to obtain these results. Tables 3–12 presents the summarized values of eight statistical parameters that were calculated. All the results in the table include information on the p-values and F-test values for the ten reducible TIs associated with anti-tuberculosis drugs. As a result, some outcomes hold significant and strong value. For instance, Table 3 represents the statistical analysis for the reducible first Zagreb index. In this table, the linear model shows the F-test value with the highest and lowest significance values as (647.5515, 0.8791), with corresponding p-values of (0.0000, 0.3686). The correlation r values for this model are (0.9916, −0.272). In the quadratic model, the F-test value is (139.5896, 0.6068) with a p-value of (0.0000, 0.566). The correlation r values for this model are (0.9981, 0.3446). Lastly, in the logarithmic model, the F-test value is (94.6245, 1.5637) with p-values of (0.0003, 0.5241). The correlation r values for this model are (0.9861, −0.3301). This analysis provides valuable insights into the relationship between the reducible first Zagreb index and the different models. Figure 7, represents the bar graphs which are visually compared the r values between characteristics and reducible indices for anti-tuberculosis drugs. The graphs clearly illustrate the positive correlation r values observed in Figures 7A, C, F. Interestingly, Figures 7A, F exhibit a stronger positive correlation compared to Figure 7C. On the other hand, Figures 7B, D, E demonstrate that among the three models (linear, logarithmic, and quadratic), only the quadratic model displays a positive correlation value. Below the results with discussion for all indices that is based on Tables 13–15 are presented.
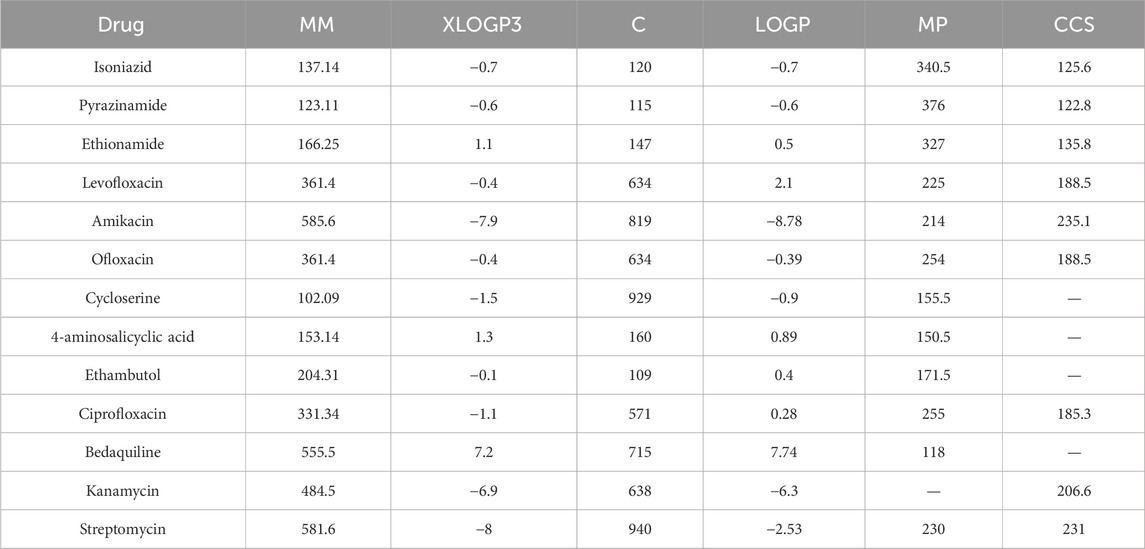
Table 2. Six physicochemical properties of anti-tuberculosis drugs.
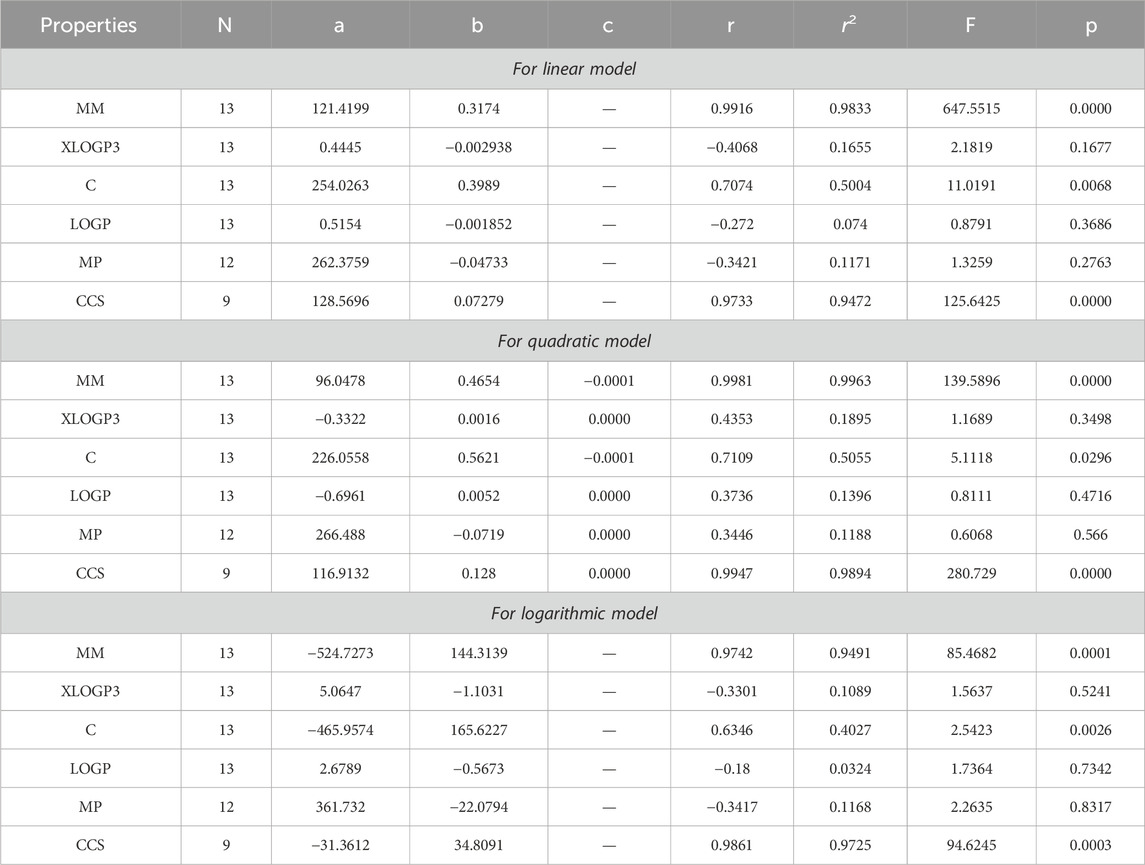
Table 3. Statistical analysis for the reducible first Zagreb index.
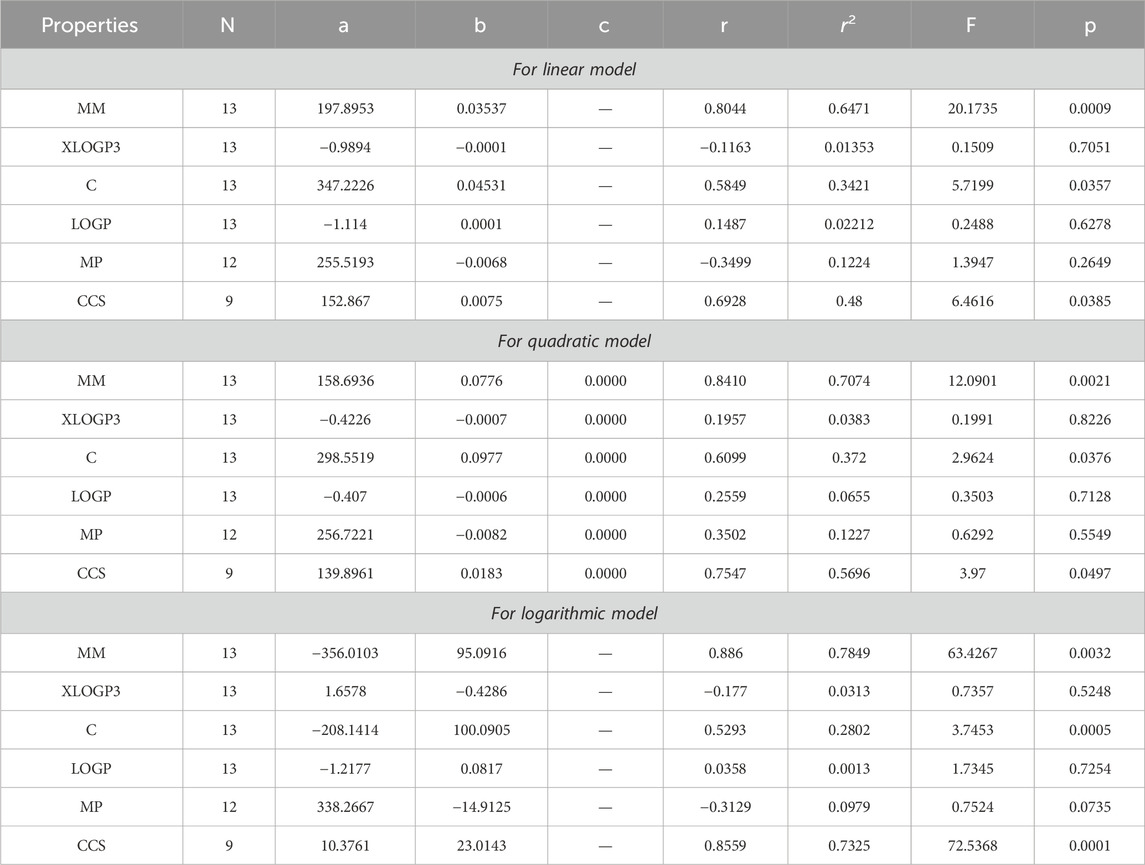
Table 4. Statistical analysis for the reducible second Zagreb index.
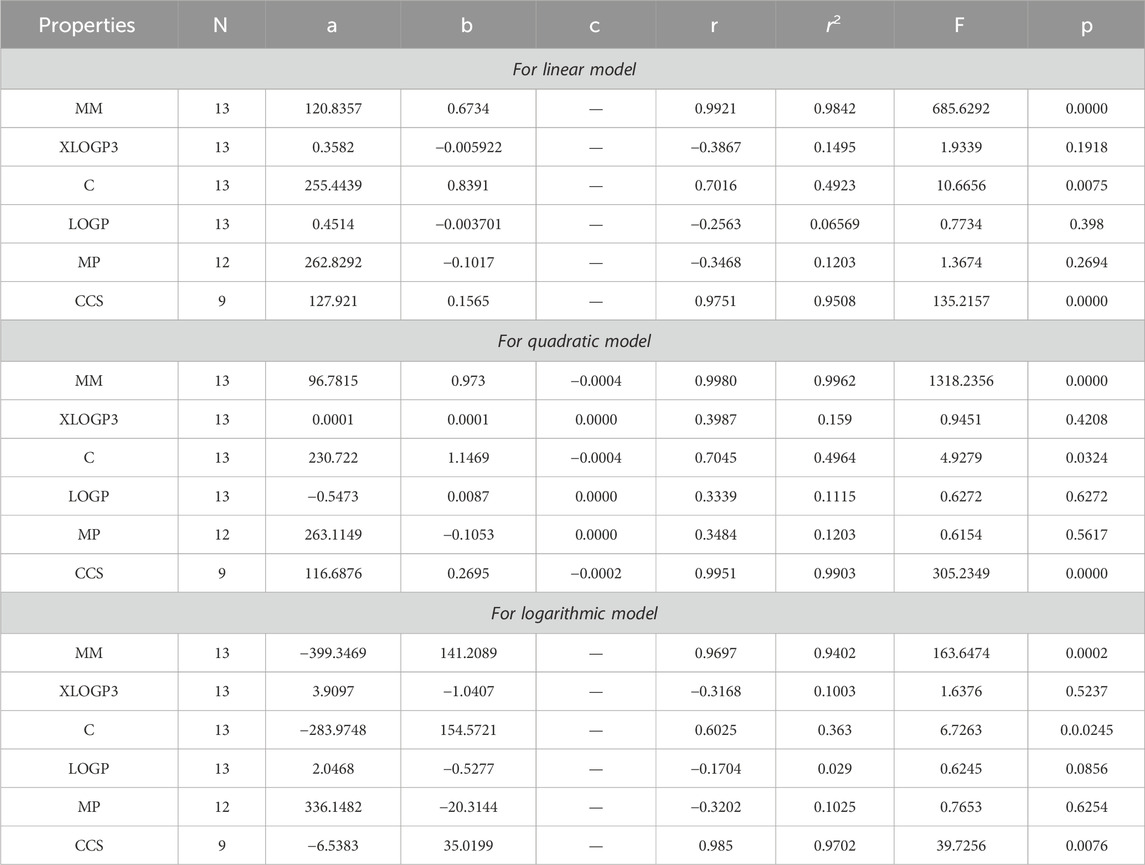
Table 5. Statistical analysis for the reducible reciprocal Randic index.
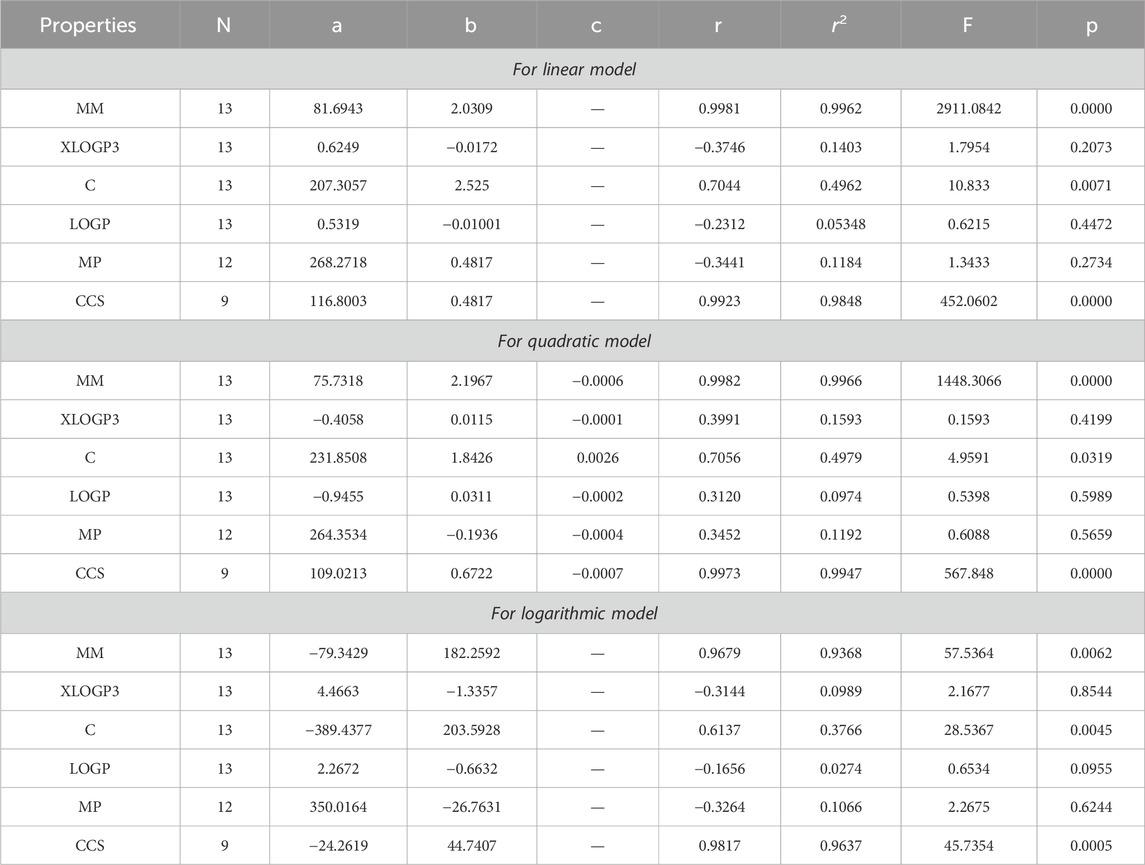
Table 6. Statistical analysis for the reducible reciprocal sum connectivity index.
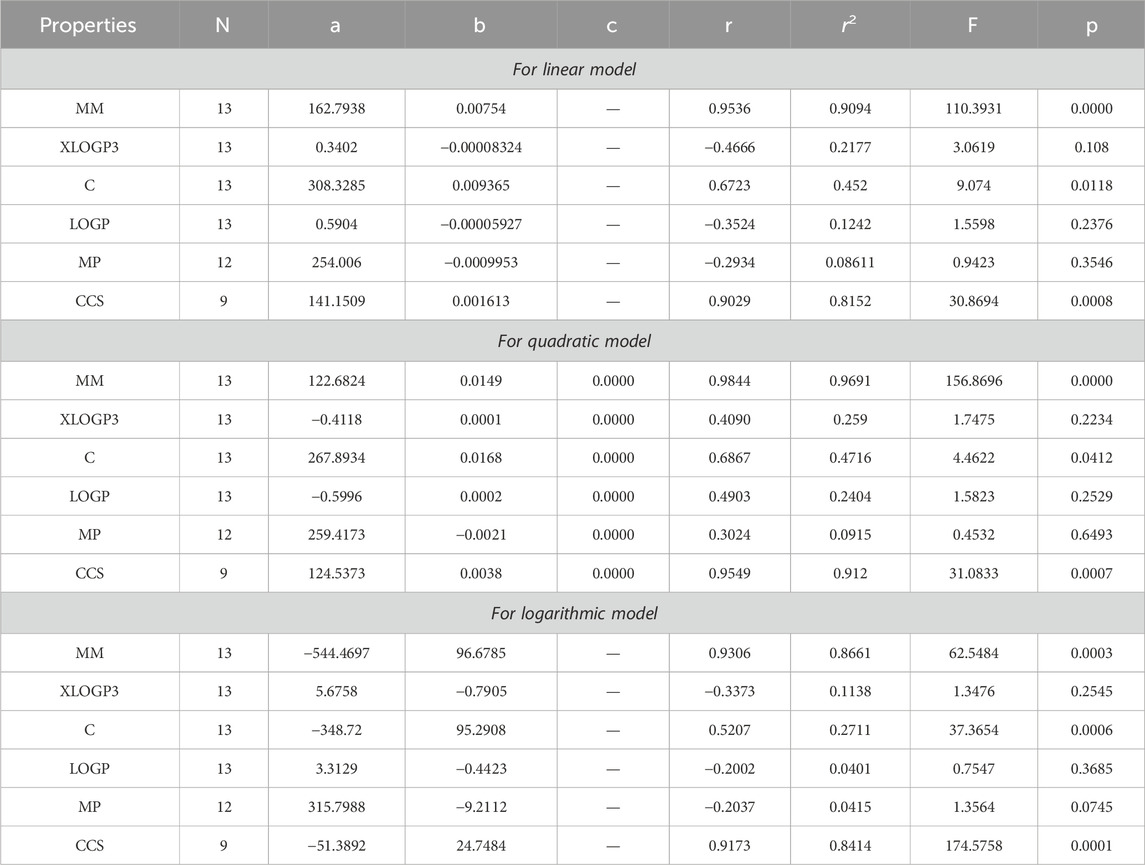
Table 7. Statistical analysis for the reducible first hyper Zagreb index.
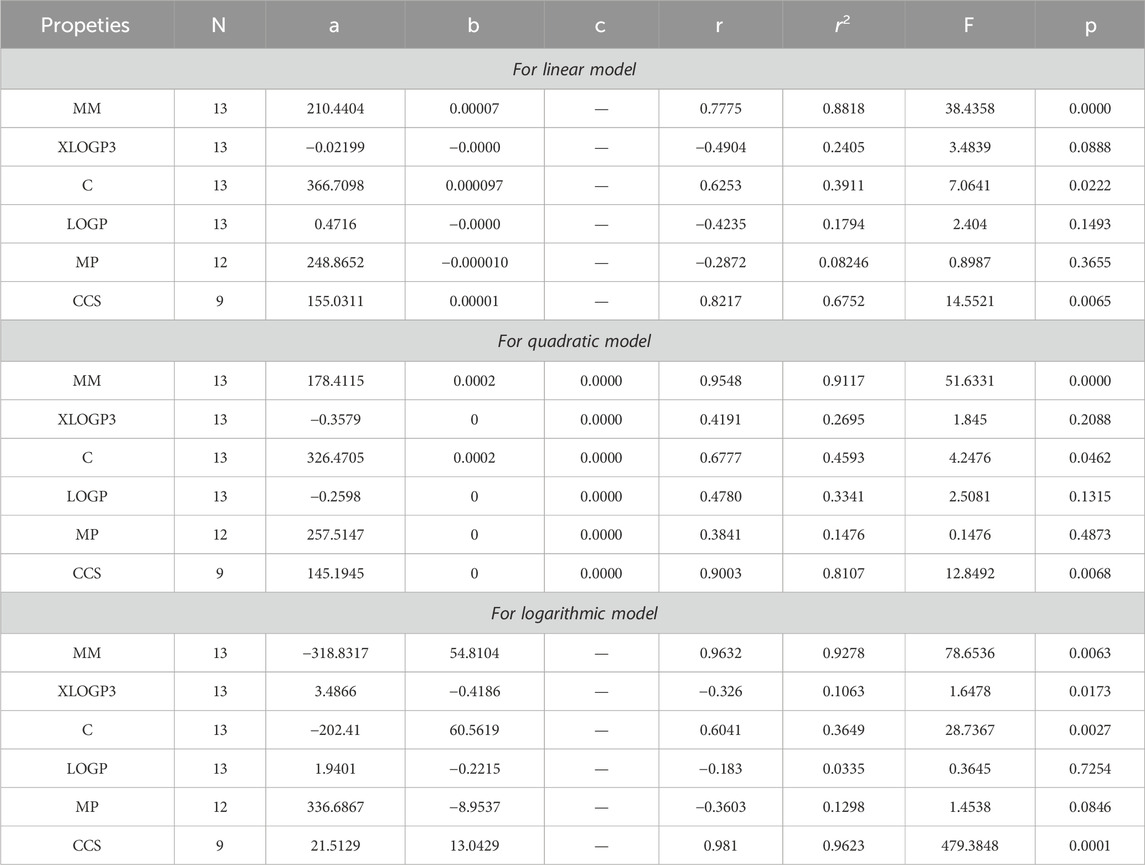
Table 8. Statistical analysis for the reducible second hyper Zagreb index.
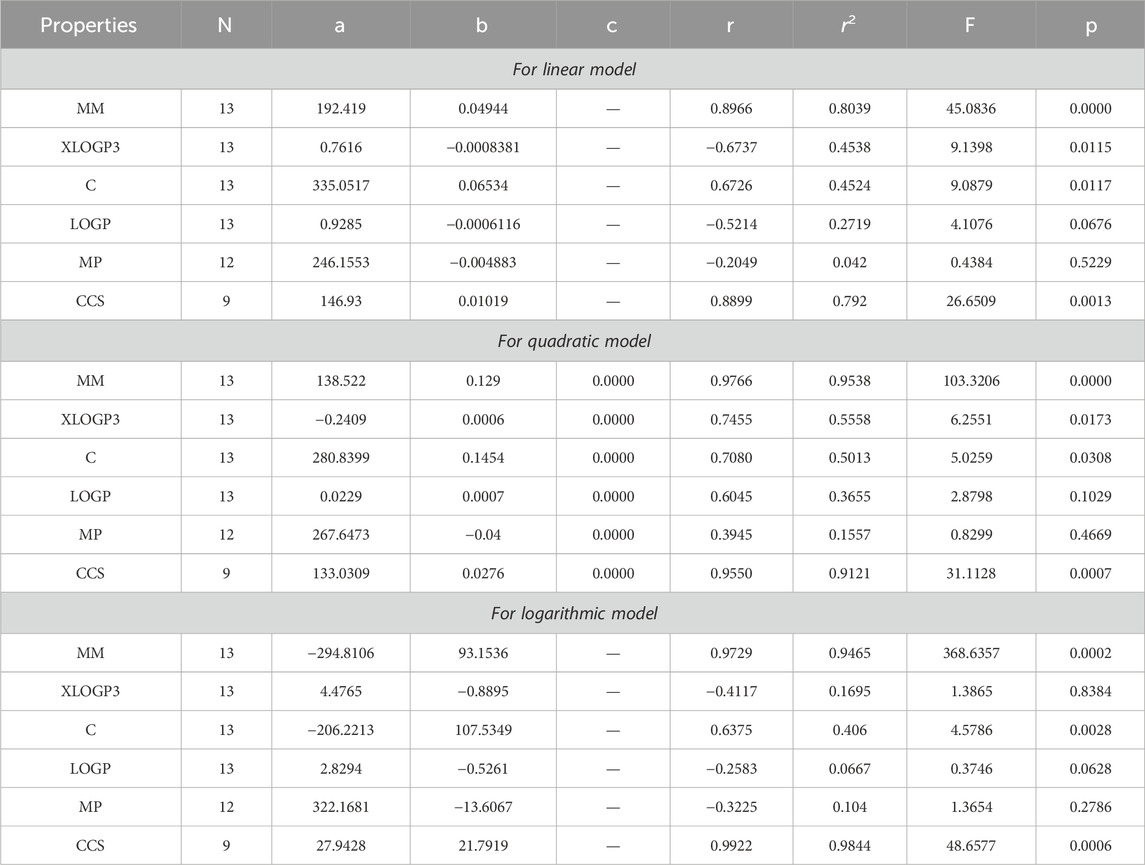
Table 9. Statistical analysis for the reducible sigma index.
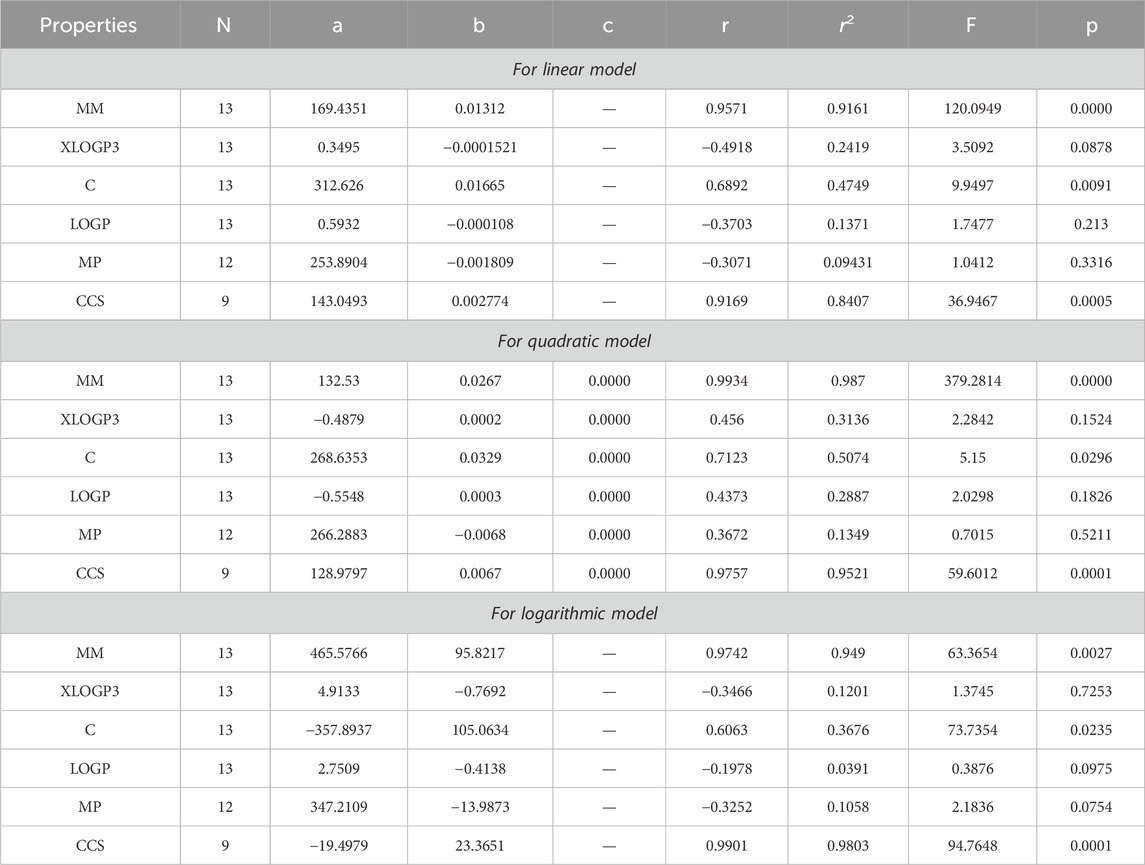
Table 10. Statistical analysis for the reducible forgotten index.
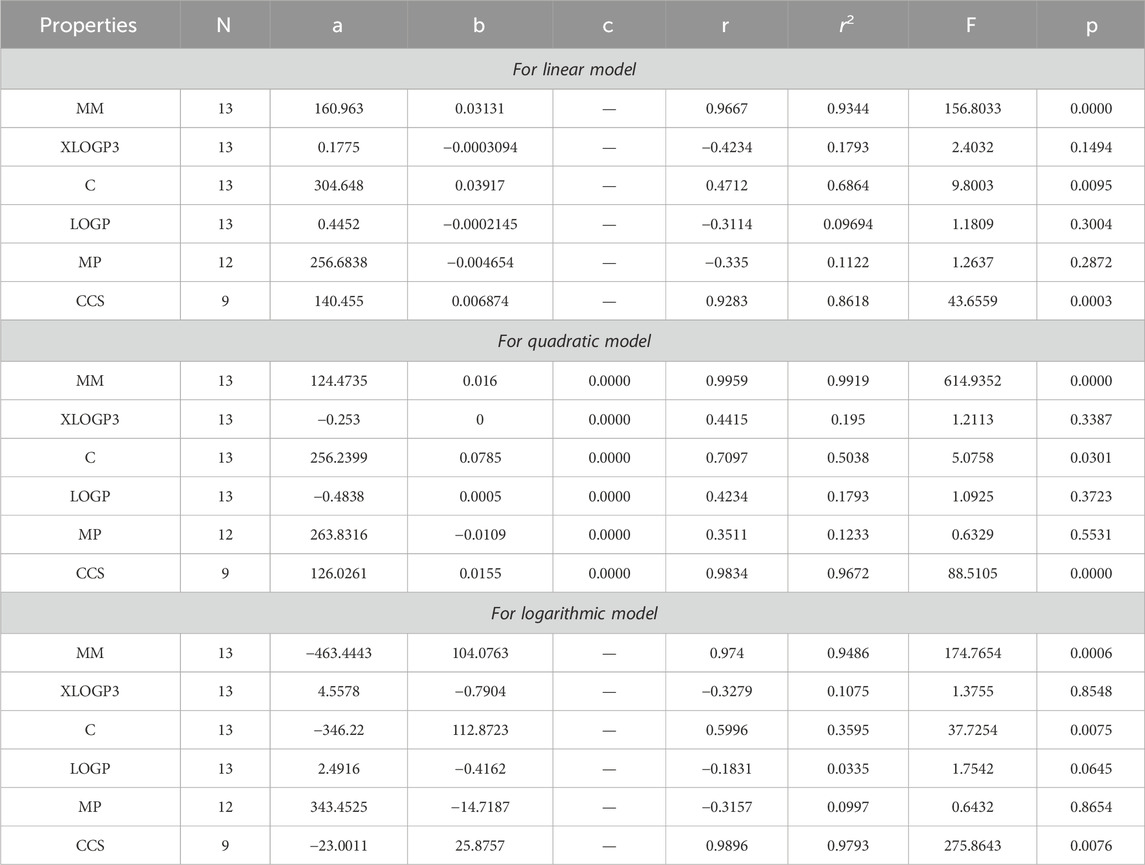
Table 11. Statistical analysis for the reducible first Gourava index.
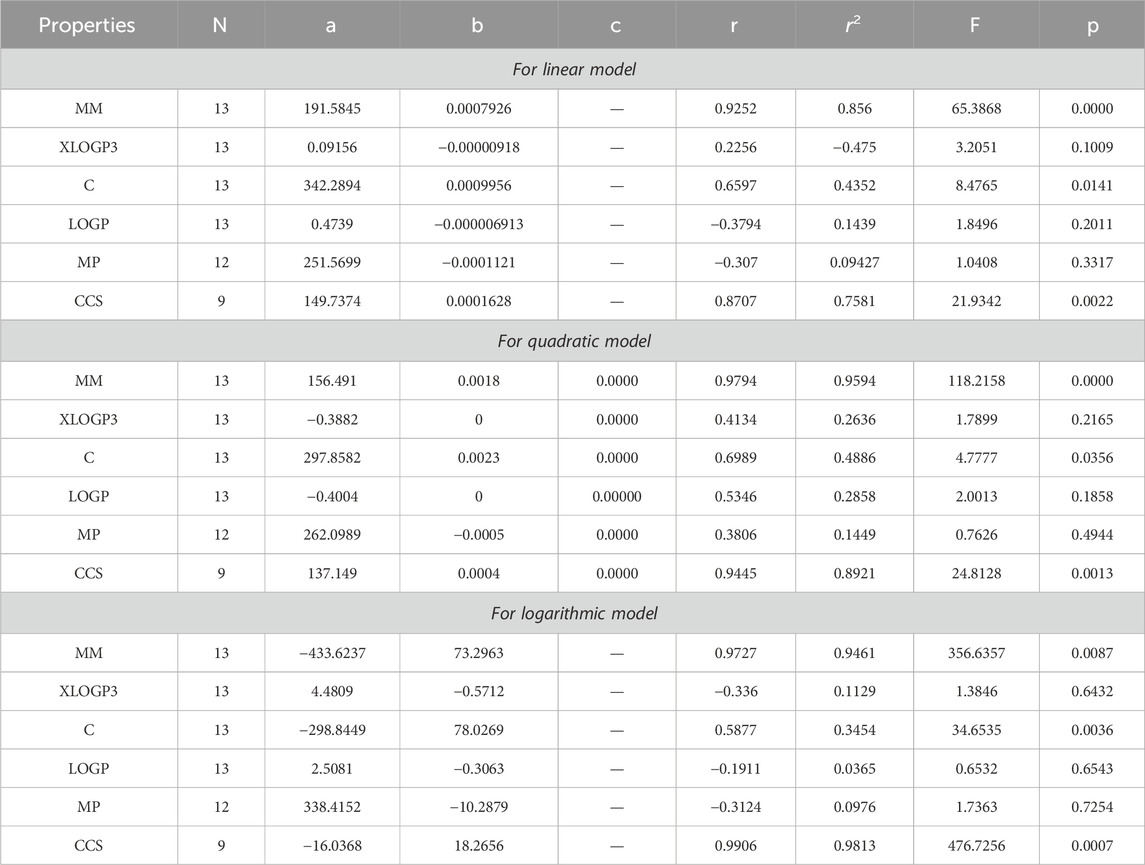
Table 12. Statistical analysis for the reducible second Gourava index.
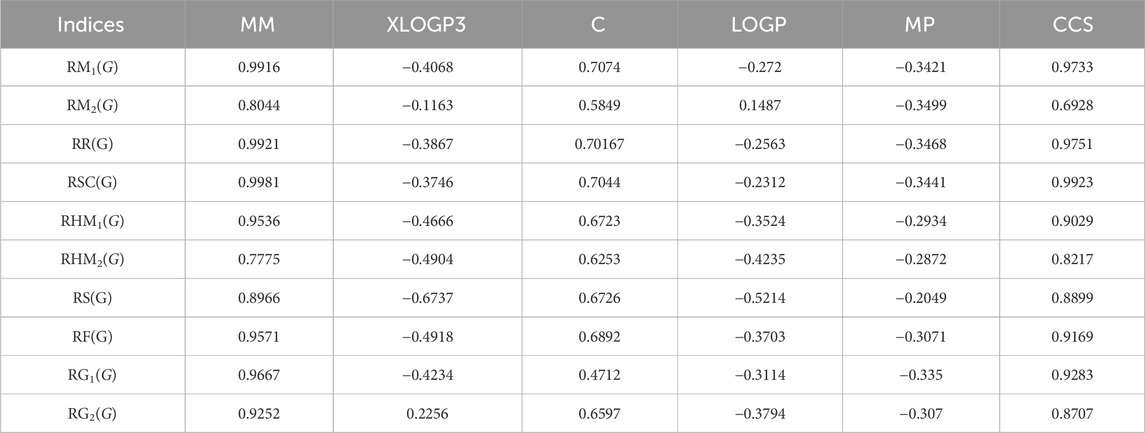
Table 13. Comparison table of correlation coefficient of linear regression.
By using Tables 3–13, we conclude that all of the defined reducible indices show a robust positive connection with molar mass within the range of r = 0.7 to 0.9 with r2 = 0.6 to 0.9 having F-value, grater and lower value is (685.6292 and 20.1735) with p-value is less than 0.05, as well as with collision cross section within the range of r = 0.6 to 0.9 with r2 = 0.4 to 0.9 having F-value, grater and lower value is (452.0602 and 6.4616) with p-value is less than 0.05. The complexity property demonstrates a significant correlation with RM1(G) at r = 0.7074, with r2 = 0.5004 having F-value is 11.0191, RR(G) at r = 0.7016 with r2 = 0.4923 and F-value is 10.6656, and RSC(G) at r = 0.7044 and r2 = 0.4962 having F-value is 10.833. These three properties display a strong positive correlation with the indices. On the other hand, the remaining three properties, namely, XLOGP3, LOGP, and MP, do not exhibit a strong correlation with any of the indices, as their correlation r values range from −0.1 to −0.5 with r2 = −0.4 to 0.2 having very low F-value and p-value which is greater than 0.05. These values indicate an inverse relationship, and have a very low significance level. Only XLOGP3 demonstrates a moderate inverse relationship with RS(G) at r = −0.6737 with r2 = 0.4538 and F-value is 9.1398. Consequently, the properties of molar mass and collision cross section offer valuable insights into the relationship with all of the indices.
Based on the results obtained from Tables 3–12, 14, it is clear that there exists a robust positive correlation between molar mass and all the specified indices, falling within the range of r = 0.8 to 0.9 with r2 = 0.7 to 0.9 having F-value, highest and lowest value is (1448.3066 and 12.0901) with p-value is less than 0.05. Additionally, a similar association is observed with collision cross section, ranging from r = 0.7 to 0.9 and r2 = 0.5,0.8 and 0.9 with F-value which is greater and lower is (567.848 and 3.97) having p-value which is less than 0.05. These intriguing findings have a profound impact on the advancement of anti-tuberculosis drugs, as they provide remarkably valuable insights into the development process. Only one index, namely, the reducible sigma index at r = 0.7455 with r2 = 0.5558 and F-value is 6.2551, demonstrates a good association with XLOGP3. The relationship between complexity with RM1(G), RR(G), RSC(G), RS(G), RF(G), and RG1(G) demonstrates a strong correlation, with r values exceeding 0.7 with r2 = 0.4 to 0.5. At a r = 0.6, this index demonstrates only a mediocre correlation with RM2(G), RHM1(G), RHM2(G), and RG2(G). LOGP show a mediocre correlation with only reducible sima index at r = 0.6045 with r2 = 0.3655.
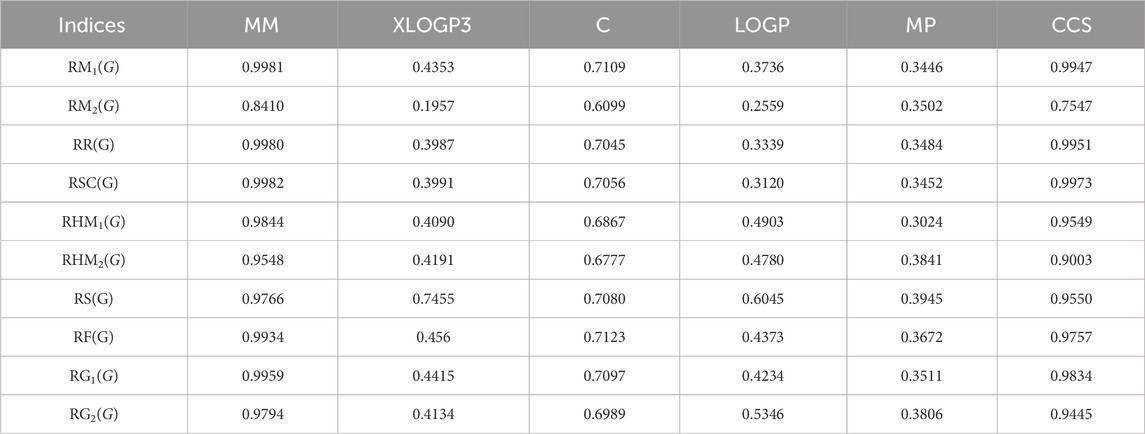
Table 14. Comparison table of correlation coefficient of quadratic regression.
After analyzing the data presented in Tables 3–12, 15, we have reached the conclusion that all the reducible indices demonstrate a very high positive correlation with molar mass within the range of r = 0.8 to 0.9 with r2 varies from to 0.7 to 0.9 having F-value, greater and lower is (368.6357 and 57.5364) with p-value which is less than 0.05, as well as with collision cross section within the same r and r2 range having F-value greater and lower is (479.3848, 39.7256) and p-values which is less than 0.05. This analysis reveals a noteworthy relationship between the defined indices and both molar mass and collision cross section. The data clearly indicates a consistent and significant positive correlation within the specified range. The range of r = 0.6 with r2 varies from 0.4 to 0.3 reveals a mediocre connection between the complexity property with six reducible indices, namely, RM1(G), RR(G), RSC(G), RHM2(G), RS(G), and RF (G). It can be observed that there is no strong correlation and significance level between LOGP and melting point across all defined indices due to the fact that the value of r falls between −0.1 and −0.3 with r2 = 0.0 to 0.1.

Table 15. Comparison table of correlation coefficient of logarithmic regression.
Degree-based topological indices prove exceptionally valuable in modeling and characterizing the molecular structure of medications, allowing for the best prediction of physicochemical properties without conducting time-consuming experiments. These indices, derived from the principles of graph theory, serve as numerical descriptors for molecular structures. When analyzing drugs using QSPR, degree-based reducible topological indices serve as important tools for predicting drug properties by providing molecular descriptors. This knowledge is vital for the development of effective treatments and the optimization of drug design. The selected drugs such as Isoniazid, Pyrazinamide, Ethionamide, Levofloxacin, Amikacin, Ofloxacin, Cycloserine, 4-aminosalicyclic acid, Ethambutol, Ciprofloxacin, Bedaquiline, Kanamycin and Streptomycin have been widely used in the treatment of tuberculosis. By calculating the degree-based reducible topological indices for these compounds, we can better understand their structural features and how they contribute to their pharmacological properties. Furthermore, we have developed a three-regression model to investigate the correlation between these calculated values and experimental properties, including molar mass, XLOGP3, Complexity, LOGP, melting point, and collision cross-section. Based on the statistical parameters and topological indices employed in the three QSPR model, we can conclude that both molar mass and collision cross section exhibit a highly significant association with all the specified indices. As an example, when examining the relationship between molar mass and collision cross section with RM1(G) index, we observe varying correlation coefficients (r values) across different models. In the linear model, the correlation coefficient ranges from 0.9916 to 0.9733. Meanwhile, the quadratic model yields a higher correlation coefficient, ranging from 0.9981 to 0.9947. Lastly, the logarithmic model shows a correlation coefficient ranging from 0.9742 to 0.9861. There is a good correlation between complexity and RM1(G), RR(G), and RSC(G) indices in the linear model at the value of r exceeds from 0.7. Similarly, in the quadratic model, the relationship between complexity and the RM1(G), RR(G), RSC(G), RS(G), RF(G), and RG1(G) indices also demonstrates a good correlation, with r values exceeding from 0.7. Furthermore, within the three discussed models, it can be observed that there is no strong correlation or significance level between LOGP and melting point across all defined indices. This research indicates that theoretical assessment could allow chemists and other professionals in the pharmaceutical sector to predict the characteristics of tuberculosis medications without the need for conducting experiments. The analysis revealed a wide range of reducible topological indices, suggesting that alternative formulations of these drugs could potentially be used to treat a variety of disorders. The research also determined the correlation coefficient for several reducible topological indices, providing chemists with valuable information to develop new medications by combining existing ones with high correlations. We aspire for this research to create a pathway for future breakthroughs in drug design and therapy, ultimately resulting in enhanced results for individuals afflicted with this incapacitating illness. Before ending this paper, we present the following open problem for further examination.
The analysis of QSPR focused on the correlation between different topological indices that is based on distance-based methodology, and physicochemical properties of anti-tuberculosis drugs through the use of exponential regression model and multi linear regression model.
The original contributions presented in the study are included in the article/supplementary material, further inquiries can be directed to the corresponding author.
SA: Conceptualization, Data curation, Formal Analysis, Funding acquisition, Investigation, Methodology, Project administration, Resources, Software, Supervision, Validation, Visualization, Writing–original draft, Writing–review and editing. NN: Conceptualization, Data curation, Formal Analysis, Funding acquisition, Investigation, Methodology, Project administration, Resources, Software, Supervision, Validation, Visualization, Writing–original draft, Writing–review and editing. MR: Conceptualization, Data curation, Formal Analysis, Funding acquisition, Investigation, Methodology, Project administration, Resources, Software, Supervision, Validation, Visualization, Writing–original draft, Writing–review and editing. LA: Conceptualization, Data curation, Formal Analysis, Funding acquisition, Investigation, Methodology, Project administration, Resources, Software, Supervision, Validation, Visualization, Writing–original draft, Writing–review and editing.
The authors declare that no financial support was received for the research, authorship, and/or publication of this article.
The authors declare that the research was conducted in the absence of any commercial or financial relationships that could be construed as a potential conflict of interest.
All claims expressed in this article are solely those of the authors and do not necessarily represent those of their affiliated organizations, or those of the publisher, the editors and the reviewers. Any product that may be evaluated in this article, or claim that may be made by its manufacturer, is not guaranteed or endorsed by the publisher.
1. Natarajan A, Beena PM, Devnikar AV, Mali S. A systemic review on tuberculosis. Indian J Tuberculosis (2020) 67(3):295–311. doi:10.1016/j.ijtb.2020.02.005
2. Jasmer RM, Nahid P, Hopewell PC. Latent tuberculosis infection. New Engl J Med (2002) 347(23):1860–6. doi:10.1056/nejmcp021045
3. Ramirez-Lapausa M, Menendez-Saldana A, Noguerado-Asensio A. Extrapulmonary tuberculosis: an overview. Rev Esp Sanid Penit (2015) 17(1):3–11. doi:10.4321/s1575-06202015000100002
4. Sharma SK, Mohan A, Kohli M. Extrapulmonary tuberculosis. Expert Rev Respir Med (2021) 15(7):931–48. doi:10.1080/17476348.2021.1927718
5. Mirzayev F, Viney K, Linh NN, Gonzalez-Angulo L, Gegia M, Jaramillo E, et al. World Health Organization recommendations on the treatment of drug-resistant tuberculosis, 2020 update. Eur Respir J (2021) 57(6):2003300. doi:10.1183/13993003.03300-2020
6. Griffith DE, Kerr CM. Tuberculosis: disease of the past, disease of the present. J Perianesthesia Nurs (1996) 11(4):240–5. doi:10.1016/s1089-9472(96)80023-2
7. Agyeman AA, Ofori-Asenso R. Tuberculosis-an overview. J Public Health Emerg (2017) 1(7):7–11. doi:10.21037/jphe.2016.12.08
8. Hayat S, Imran M. On degree based topological indices of certain nanotubes. J Comput Theor Nanoscience (2015) 12(8):1599–605. doi:10.1166/jctn.2015.3935
9. Siddiqui MK, Naeem M, Rahman NA, Imran M. Computing topological indices of certain networks. J Optoelectronics Adv Mater (2016) 18:884–92.
10. Hayat S, Imran M. Computation of topological indices of certain networks. Appl Math Comput (2014) 240:213–28. doi:10.1016/j.amc.2014.04.091
12. Amic D, Bešlo D, Lucic B, Nikolic S, Trinajstic N. The vertex-connectivity index revisited. J Chem Inf Comput Sci (1998) 38(5):819–22. doi:10.1021/ci980039b
13. Hu Y, Li X, Shi Y, Xu T, Gutman I. On molecular graphs with smallest and greatest zeroth-order general Randic index. MATCH Commun Math Comput Chem (2005) 54(2):425–34.
14. Caporossi G, Gutman I, Hansen P, Pavlovi? L. Graphs with maximum connectivity index. Comput Biol Chem (2003) 27(1):85–90. doi:10.1016/s0097-8485(02)00016-5
15. Li X, Gutman I. Mathematical chemistry monographs no. 1. Kragujevac, Macedonia: University of Kragujevac (2006).
16. Kier LB, Hall LH. Molecular connectivity VII: specific treatment of heteroatoms. J Pharm Sci (1976) 65(12):1806–9. doi:10.1002/jps.2600651228
18. Shafiei F. Relationship between topological indices and thermodynamic properties and of the monocarboxylic acids applications in QSPR. Iranian J Math Chem (2015) 6(1):15–28.
19. Sepehri B. A review on created QSPR models for predicting ionic liquids properties and their reliability from chemometric point of view. J Mol Liquids (2020) 297:112013. doi:10.1016/j.molliq.2019.112013
20. Hosamani SM, Kulkarni BB, Boli RG, Gadag VM. QSPR analysis of certain graph theocratical matrices and their corresponding energy. Appl Math Nonlinear Sci (2017) 2(1):131–50. doi:10.21042/amns.2017.1.00011
21. Mondal S, Dey A, De N, Pal A. QSPR analysis of some novel neighbourhood degree-based topological descriptors. Complex Intell Syst (2021) 7:977–96. doi:10.1007/s40747-020-00262-0
22. Miyao T, Kaneko H, Funatsu K. Inverse QSPR/QSAR analysis for chemical structure generation (from y to x). J Chem Inf Model (2016) 56(2):286–99. doi:10.1021/acs.jcim.5b00628
23. Huang R, Mahboob A, Rasheed MW, Alam SM, Siddiqui MK. On molecular modeling and QSPR analysis of lyme disease medicines via topological indices. The Eur Phys J Plus (2023) 138(3):243. doi:10.1140/epjp/s13360-023-03867-9
24. Hasani M, Ghods M. Topological indices and QSPR analysis of some chemical structures applied for the treatment of heart patients. Int J Quan Chem (2024) 124:e27234. doi:10.1002/qua.27234
25. Mahboob A, Rasheed MW, Amin L, Hanif I. A study of novel molecular descriptors and quantitative structure–property relationship analysis of blood cancer drugs. Eur Phys J Plus (2023) 138(9):856. doi:10.1140/epjp/s13360-023-04499-9
26. Mahboob A, Rasheed MW, Hanif I, Amin L, Alameri A. Role of molecular descriptors in quantitative structure-property relationship analysis of kidney cancer therapeutics. Int J Quan Chem (2024) 124:e27241. doi:10.1002/qua.27241
27. Husin MN, Ariffin A. On the edge version of topological indices for certain networks. Ital J Pure Appl Math (2022) 47:550–64.
28. Liu JB, Ali H, Shafiq MK, Dustigeer G, Ali P. On topological properties of planar octahedron networks. Polycyclic Aromatic Comp (2023) 43(1):755–71. doi:10.1080/10406638.2021.2022726
29. Sardar MS, Ali MA, Ashraf F, Cancan M. On topological indices of double and strong double graph of silicon carbide Si2 C3-I [p, q]. Eurasian Chem Commun (2023) 5:37–49. doi:10.22034/ecc.2023.356160.1519
30. Raza Z, Akhter S, Shang Y. Expected value of first Zagreb connection index in random cyclooctatetraene chain, random polyphenyls chain, and random chain network. Front Chem (2023) 10:1067874. doi:10.3389/fchem.2022.1067874
31. Nadeem I, Siddique S, Shang Y. Some inequalities between general randic-type graph invariants. J Math (2024) 2024:1–7. doi:10.1155/2024/8204742
32. Gutman I, Trinajstic N. Graph theory and molecular orbitals. Total φ-electron energy of alternant hydrocarbons. Chem Phys Lett (1972) 17(4):535–8. doi:10.1016/0009-2614(72)85099-1
33. Islam SR, Pal M. Second Zagreb index for fuzzy graphs and its application in mathematical chemistry. Iranian J Fuzzy Syst (2023) 20(1):119–36. doi:10.22111/IJFS.2023.7350
34. Mondal S, De N, Pal A. On neighborhood Zagreb index of product graphs. J Mol Struct (2021) 1223:129210. doi:10.1016/j.molstruc.2020.129210
35. Randic M. Characterization of molecular branching. J Am Chem Soc (1975) 97(23):6609–15. doi:10.1021/ja00856a001
36. Yuan M. On the Randic index and its variants of network data. TEST (2023) 1–25. doi:10.1007/s11749-023-00887-6
37. Zhou B, Trinajstic N. On general sum-connectivity index. J Math Chem (2010) 47:210–8. doi:10.1007/s10910-009-9542-4
38. Hussain M, ur Rehman A, Iqbal MS, Muhammad A. Computation of randic and sum-connectivity indices for H3BO3 layer. Structure’s Derivatives (2022). doi:10.21203/rs.3.rs-2124344/v1
39. Carballosa W, Pestana D, Sigarreta JM, Tour E. Relations between the general sum connectivity index and the line graph. J Math Chem (2020) 58:2273–90. doi:10.1007/s10910-020-01180-9
41. Sarkar I, Nanjappa M. On second hyper-zagreb index of corona products related to R-graphs. Int J Appl Math (2023) 36(3):301. doi:10.12732/ijam.v36i3.1
42. Hakeem A, Muhammad Katbar N, Muhammad F, Ahmed N. QSPR analysis of some important drugs used in heart attack treatment via degree-based topological indices and regression models. Polycyclic Aromatic Comp (2023) 1–10. doi:10.1080/10406638.2023.2262697
43. Gutman I, Togan M, Yurttas A, Cevik AS, Cangul IN. Inverse problem for sigma index. MATCH Commun Math Comput Chem (2018) 79(2):491–508.
44. Ascioglu M, Cangul IN. Sigma index and forgotten index of the subdivision and r-subdivision graphs. Proc Jangjeon Math Soc (2018) 21(3):375–83. doi:10.17777/pjms2018.21.3.375
45. Havare OC. QSPR analysis with curvilinear regression modeling and topological indices. Iranian J Math Chem (2019) 10(4):331–41. doi:10.22052/ijmc.2019.191865.1448
46. Furtula B, Gutman I. A forgotten topological index. J Math Chem (2015) 53(4):1184–90. doi:10.1007/s10910-015-0480-z
47. Hosamani SM. A upper bound for the F 1-index and its applications to fullerenes. MATCH Commun Math Comput Chem (2015) 74(1):97–101.
48. De N, Nayeem SMA, Pal A. F-index of some graph operations. Discrete Math algorithms Appl (2016) 8(02):1650025. doi:10.1142/s1793830916500257
49. Kulli VR. The Gourava indices and coindices of graphs. Ann Pure Appl Math (2017) 14(1):33–8. doi:10.22457/apam.v14n1a4
Keywords: tuberculosis drugs, degree-based reducible topological indices, QSPR analysis, regression models, correlation coefficients (r)
Citation: Alam SM, Nigar N, Rasheed MW and Amin L (2024) Analyzing the role of reducible molecular descriptors and thermodynamic aspects of anti-tuberculosis drugs via QSPR study. Front. Phys. 12:1383216. doi: 10.3389/fphy.2024.1383216
Received: 07 February 2024; Accepted: 22 March 2024;
Published: 18 April 2024.
Edited by:
Vickramjeet Singh, Dr. B. R. Ambedkar National Institute of Technology Jalandhar, IndiaReviewed by:
Yilun Shang, Northumbria University, United KingdomCopyright © 2024 Alam, Nigar, Rasheed and Amin. This is an open-access article distributed under the terms of the Creative Commons Attribution License (CC BY). The use, distribution or reproduction in other forums is permitted, provided the original author(s) and the copyright owner(s) are credited and that the original publication in this journal is cited, in accordance with accepted academic practice. No use, distribution or reproduction is permitted which does not comply with these terms.
*Correspondence: Muhammad Waheed Rasheed, d2FoZWVkcmFzaGVlZDQ2MUBnbWFpbC5jb20=
Disclaimer: All claims expressed in this article are solely those of the authors and do not necessarily represent those of their affiliated organizations, or those of the publisher, the editors and the reviewers. Any product that may be evaluated in this article or claim that may be made by its manufacturer is not guaranteed or endorsed by the publisher.
Research integrity at Frontiers
Learn more about the work of our research integrity team to safeguard the quality of each article we publish.