 Hisashi Hayashi*
 Kaho Yamada
- Department of Chemical and Biological Sciences, Faculty of Science, Japan Women’s University, Tokyo, Japan
We describe a new class of the periodic banding of Ag2O precipitates through reaction–transport–reaction processes in an agarose-hydrogel column; the gel contains NaNO3 as an additive and is inserted between Ag and Ti rods with an applied constant voltage of 4.0–7.0 V. Submillimeter-scale periodic dark-brown precipitation bands were transiently generated with high reproducibility in this system, in which (i) electrochemical reactions at the metal rods to generate Ag+ and OH−, (ii) transportation of the reactant ions by the electric field, and (iii) reactions to produce Ag2O are expected to couple. The bands successively emerged mainly toward the cathode, accompanied by substantial changes in the electric current through the gel. The periodic banding depended on the applied voltage, duration of application, and concentration of NaNO3 initially loaded in the gel. The banding was most clearly observed in a 2.0 mass% agarose gel column containing 0.005 M NaNO3 under a constant applied voltage of ∼5.5 V for ∼3 h. This optimal condition resulted in more than ten periodic bands, of which the bandwidth (w) and the distance between the adjacent bands (d) were randomly distributed around the average values: for the bands formed up to 2 h, w = 0.25 ± 0.04 mm and d = 0.42 ± 0.05 mm; for the bands formed after 2 h, w = 0.42 ± 0.11 mm and d = 0.68 ± 0.07 mm. The generated periodic bands were gradually painted out with time to form an almost continuous broad band, even after the applied voltage was discontinued, although immersion of the gel in deionized water for 3 h could suppress this uniformization. Observations using optical and scanning electron microscopes with an energy-dispersive X-ray detector suggested that the periodic bands were composed of gelatinous Ag2O and micrometer-scale (1–50 μm) clusters, which comprised Ag-abundant nanoparticles with considerable size dispersion (10–500 nm). The relationship between the periodic banding and inhomogeneous distribution of the reactant ions and potential applications of the observed banding phenomena are discussed.
1 Introduction
Periodic precipitation, known as Liesegang banding [1–5], is one of the oldest and most studied self-organizing pattern formation phenomena [6, 7]. In Liesegang-banding systems, the diffusion of the constituent ions and their reactions are coupled in a gel to spontaneously form parallel precipitation bands with spacings ranging from a few tens of micrometers to a few centimeters [2–6]. Liesegang banding has provided insights into various research fields, including chemistry, geology, biology, and physics [3], and has attracted considerable scientific interest, partially because it offers a new strategy for rationally designing complex micro- and nano-sized materials and functional devices [8–10]. Nevertheless, Liesegang banding has only been observed for relatively few combinations of co-precipitating ions and supporting gels [4]. Hence, to develop new applications for periodic-banding phenomena in materials science and engineering (e.g., for designing ionic skin [11]), it is necessary to extend the scope of periodic precipitation systems beyond that of classical Liesegang-banding systems. This extension has been attempted extensively [12–16].
Recently, we discovered a new class of periodic-banding systems in which the following coupled processes (reaction-transport-reaction (RTR) processes) are expected to occur in the gel: electrochemical reactions to generate reactant ions, transportation of the ions by the electric field and thermal diffusion in the gel, and reactions of the ions to form precipitates. Specifically, Cu–Fe-based Prussian blue analogs (Cu–Fe PBA) [17, 18] and Fe(OH)3 [19] precipitate with the stochastic formation of periodic bands in agarose gel by applying cyclic alternating voltages (e.g., 4 and 1 V, for 1 and 4 h, respectively, per cycle). RTR processes have been overlooked throughout the long research history of periodic (Liesegang) banding, although similar processes such as Liesegang banding under electric fields [4, 20–23] have been examined.
Previously studied RTR systems [17–19] differ from that presented in this paper−the Ag2O precipitation system via RTR processes−because Ag2O periodic precipitation bands are generated by applying constant voltage. This property can broaden the range of practical applications of periodic precipitation banding. Notably, Ag2O is a functional material with photocatalytic [24] and oxidative activities [25], and new synthesis methods thereof have been intensively explored [25, 26]. Note also that the precipitation bands of AgOH (the precursor of Ag2O) in gel generated by the conventional Liesegang-banding approach are not periodic but continuous [27].
As illustrated in Figure 1, the RTR system of Ag2O studied here is similar to that of Fe(OH)3 [19]. Agarose-hydrogel containing NaNO3 as an additive is inserted in a plastic straw between two metal rods (Ag for the anode and Ti for the cathode) across which voltage is applied. In this system, Ag+ and OH− ions are generated at the anode and cathode, respectively.
The generated Ag+ ions form an aqua complex [Ag(H2O)4]+ in the hydrogel:
A side reaction forming H+ ions is also possible at the anode:
The addition of a strong electrolyte, NaNO3, is expected to enhance Reactions 1, 2, and 4 by easily forming the electric double layer and/or thickening the diffuse double layer near the electrodes, similar to water electrolysis (note that electrolytes generating poorly soluble Ag compounds, such as chlorides and sulfates, are unsuitable for this purpose). The ions thus generated, [Ag(H2O)4]+, H+, and OH−, are transported under the influence of the electric field (and thermal diffusion) and react with each other to form AgOH precipitates and H2O in the hydrogel.
White AgOH that precipitates in Reaction 5 spontaneously yields thermodynamically more stable brown Ag2O:
Under visible-light irradiation, Ag2O decomposes into metallic Ag [24].
Thus, the precipitates generated in this system are mixtures of AgOH, Ag2O, and Ag, and are expected to be AgOH abundant at the initial stages and Ag2O (and/or Ag) dominant at the later stages.
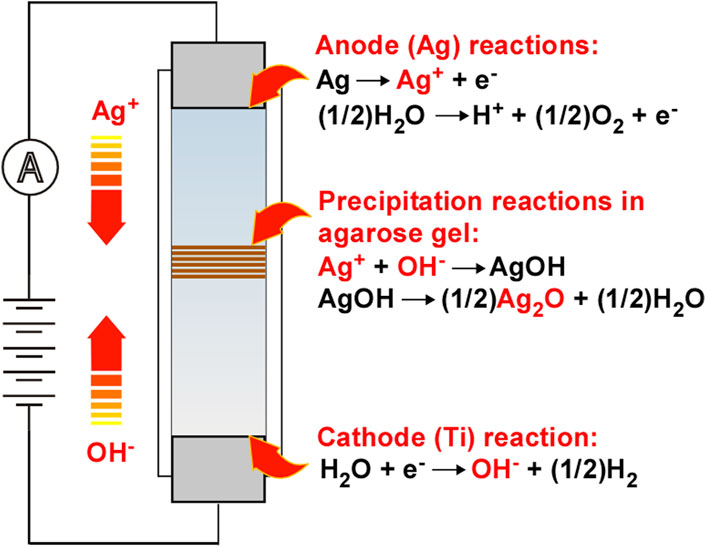
FIGURE 1. Schematic illustration of the experimental setup, wherein the (i) electrochemical reactions to generate reactant Ag+ and OH− ions, (ii) transportation of the ions by an electric field, and (iii) reactions to form AgOH and Ag2O are coupled to generate precipitation patterns in the agarose-hydrogel. The arrows indicate the direction of the movement of the reactant ions in the electric field.
2 Materials and methods
2.1 Materials
Round bars of Ti (≥99.5%) and Ag (≥99.99%) were obtained from the Nilaco Corporation (Tokyo, Japan) and used as electrodes. Analytical reagent-grade NaNO3 and agarose required for electrophoresis (gel strength: 1,800–2,300 g/cm2) were purchased from Fujifilm Wako Pure Chemical Corporation (Osaka, Japan) and Kanto Chemical Co., Inc. (Tokyo, Japan), respectively. All the chemicals were used as received without further purification. All aqueous solutions were prepared using deionized water that had been obtained by purifying tap water using a cartridge water purifier (G-10, Organo, Tokyo, Japan).
2.2 Sample preparation
Four plastic straws, filled to a length of 50 mm with agarose gel that contained NaNO3 as an additive (termed “sample tubes”), were prepared under the same experimental conditions. Specifically, appropriate amounts of NaNO3 powder were dissolved in deionized water at 25°C to form NaNO3 solutions (30 cm3) with concentrations in the range of 0.000–0.010 M. After adding 2.0 mass% agarose, the mixture was stirred vigorously at 98°C for 45 s to produce a uniform NaNO3–agarose sol. Using a Pasteur pipette, the prepared sol was transferred to the plastic straws (4 mm in diameter and 65 mm in length), the bottom ends of which were plugged with a Ti rod (4 mm in diameter and 20 mm in length) for use as the cathode. The hot sol in each straw was left to cool to 25°C to form a solidified gel. After solidification, a Ag rod (3 mm in diameter and 22 mm in length) was placed on top of the gel as the anode. The cathode and anode were connected to a programmable power supply (PPS303; AS ONE, Osaka, Japan). During the application of constant voltage at 25°C, the electric current through the sample tube and the precipitation patterns formed therein were monitored using a digital multimeter (BDM521, AS ONE) and a digital camera (Tough TG-6, Olympus, Tokyo, Japan), respectively. Once voltage application was discontinued, the sample tubes were laid on white paper (backlit by an LED flashlight) with a ruler with 0.5 mm increments to zoom in on the photo at a magnification of approximately ten times. The zoomed images of the sample tubes (and the ruler) were analyzed in a graphic software (Canvas X, Canvas GFX, Inc., Boston, MA, United States) to measure the width of the precipitation bands (w) and the distances between adjacent bands (d) with an uncertainty of ±0.005 mm. Several gel columns were removed from the sample tubes and immersed in deionized water (200 cm3) for 3 h to remove any unreacted ions.
2.3 Microscopic observation
After immersion, some gel columns were cut into ∼1 mm thick sections for microscopic observation. An optical microscope (SKM-S31C-PC, Saitoh Kougaku, Japan) was used to observe micrometer-scale particles in the sections, whereupon they were allowed to dry for 3 weeks in a calm laboratory environment at 25°C while adhered to double-sided adhesive carbon tape and mounted on the aluminum stub of a scanning electron microscope (SEM; SU8220, Hitachi, Tokyo, Japan). This simple drying procedure required 3 weeks to suppress the movement of the precipitate particles under irradiation by SEM electron beams. Scanning electron microscopy with energy dispersive X-ray analysis (SEM-EDX) measurements were conducted at 15 kV at a working distance of 14.9 mm using an X-ray fluorescence (XRF) detector installed in an SU8220 series instrument (EMAX X-MaxN, Oxford Instruments, Tokyo, Japan) in combination with analysis software (AZtec Live, Oxford Instruments).
3 Results
3.1 Periodic banding of Ag2O precipitates through RTR processes
Figures 2, 3, respectively, show the typical time dependence of the electric current flowing through the sample tube and the spatiotemporal evolution of the precipitation pattern formed therein. The sample tube was prepared with an initial NaNO3 concentration (Cadd) of 0.005 M, and a constant voltage (E) of 5.5 V was applied. As described in Sections 3.2, 3.3, these experimental conditions are optimal for observing the periodic bands clearly.
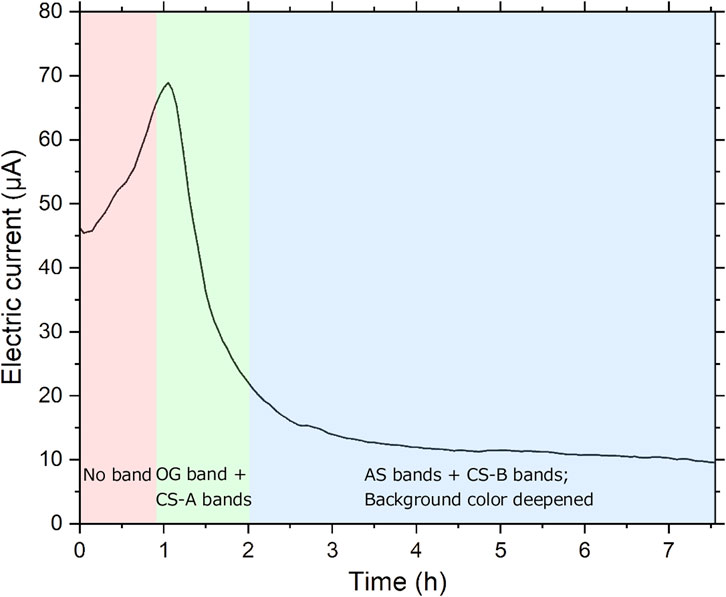
FIGURE 2. Time dependence of the electric current through the sample tube at 25°C under Cadd = 0.005 M, E = 5.5 V, and tapp = 7.5 h. The period during which each characteristic pattern was observed in the tube is distinguished by changing the background color of the figure.
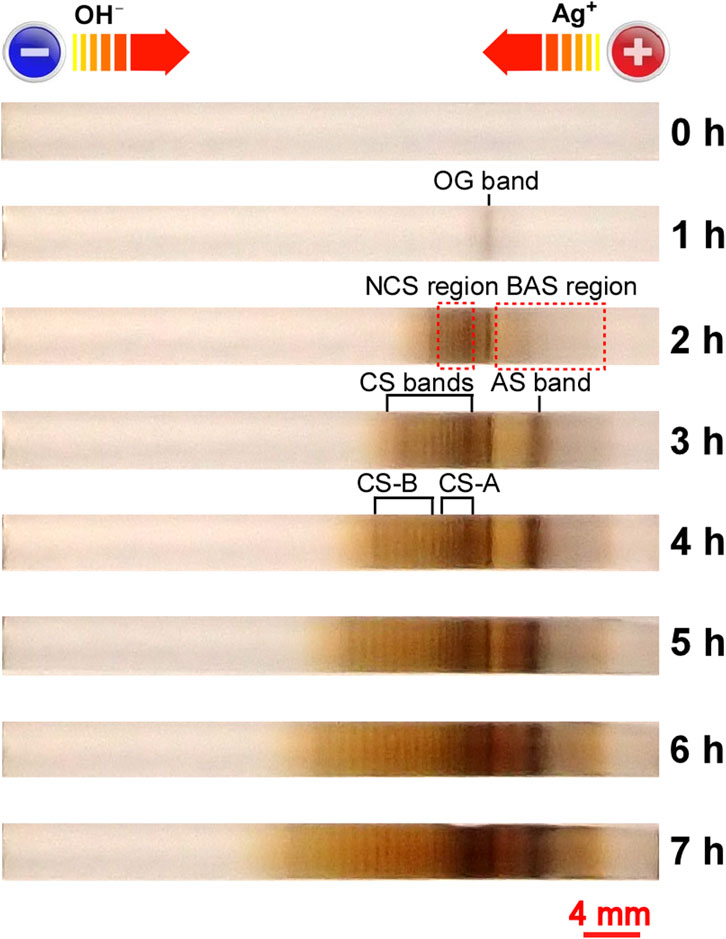
FIGURE 3. Spatiotemporal evolution of typical periodic bands formed in the sample tube at 25°C under Cadd = 0.005 M and E = 5.5 V. The tapp values and designations defined in the text are also indicated. A scale bar and charges on the electrodes are provided at the bottom and top of the image, respectively.
As shown in Figure 2, up to the elapsed time after applying the voltage (tapp) of 1 h, the electric current increased almost monotonically with tapp, suggesting a continuous increase in the reactant ions generated by Reactions 1–4. No marked precipitation was observed in the sample tube during this period.
After tapp = 0.9 h, a discrete, brown band (w ≈ 0.4 mm) gradually became visible at ∼10 mm from the center of the sample tube on the anode side (Figure 3). The emergence of this original precipitation band (named “OG band” (OriGinal band)) decreased the electric current, suggesting the substantial consumption of reactant ions by forming AgOH precipitates. The time at which the electric current through the sample tube reaches its maximum is designated as tp hereafter: currently, tp = 1 h.
After tapp = 1.2 h (1.2tp), the OG band deepened its brown color, and another discrete band emerged on the cathode side of the OG band, accompanied by a further decrease in the electric current. Hereafter, we refer to the discrete bands generated on the cathode side of the OG band “CS bands” (Cathode Side bands). Up to tapp = 1.5 h, relatively narrow CS bands were successively generated in a similar manner within a considerably limited (∼3 mm wide) region (named “NCS region” (Narrow CS band region)). Furthermore, the relatively broad (∼7 mm wide) region on the anode side of the OG band (named “BAS region” (Broad Anode Side region)) browned gradually.
After tapp = 2 h (2tp), the electric current weakened to approximately 1/3 of the peak value, and relatively broad bands gradually emerged (i) between the OG and the first CS band, (ii) on the cathode side out of the NCS region, and (iii) on the anode side of the OG band. Hereafter, we refer to the broad bands generated on the anode side of the OG band “AS bands” (Anode Side bands). The w value of the AS band was ∼0.7 mm. Furthermore, the BAS region, which contained the first AS band, expanded toward the anode, deepening in color to a darker brown. Meanwhile, on the cathode side, beyond the NCS region, light and broad bands were successively generated with increasing tapp; the background brown color within the NCS region deepened gradually. We classify the CS bands into two types: dark and narrow CS bands that formed before 2tp and were located within the NCS region (named “CS-A bands”) and light and broad CS bands that mainly formed after 2tp and were not located within the NCS region (named “CS-B bands”). The average w values were 0.25 ± 0.04 mm (CS-A bands) and 0.42 ± 0.11 mm (CS-B bands); the average d values were 0.42 ± 0.05 mm (CS-A bands) and 0.68 ± 0.07 mm (CS-B bands). Thus, both w and d of the CS-B bands were ∼1.6 times larger than those of the CS-A bands.
After tapp = 3 h (3tp), the electric current became less than 1/5 of the peak value and had little dependence on tapp. At this stage, as tapp increased, the first AS band became distinct, and the CS-B bands continued to emerge successively. The number of CS-B bands was not limited and occasionally exceeded 10 for tapp > 5 h, whereas that of CS-A bands was limited (≤6). At the same time, the dark-brown color of the background in the NCS and BAS regions continued to deepen; consequently, both the CS and AS bands were gradually painted out by the background color to form an approximately continuous band. These gradual changes continued until tapp = 7.5 h.
Notably, the painting-out continued even after discontinuation of the voltage application (compare Figures 4A, B), suggesting that the rate of Reaction 7 is sufficiently slow to cause a considerable time lag until the AgOH crystallites in the gel transform into macroscopic Ag2O precipitates. As a result, the observed periodic bands were occasionally painted out 1 day after the applied voltage was discontinued (Figure 4B). However, the painting-out effect could be suppressed by pulling the sample out of the straw and immersing it in deionized water of 200 cm3 for 3 h; even after 3 h of immersion, the periodic bands became partially blurred with a dark-brown background, but they could be clearly observed by backlighting the sample tube with an LED flashlight (Figure 4C). The observed suppression suggests that unreacted [Ag(H2O)4]+ and OH− ions, as well as AgOH crystallites smaller than the micropores in the agarose gel, remained in the sample tube to cause the painting-out effect, and the 3 h immersion is effective for their removal, as expected.
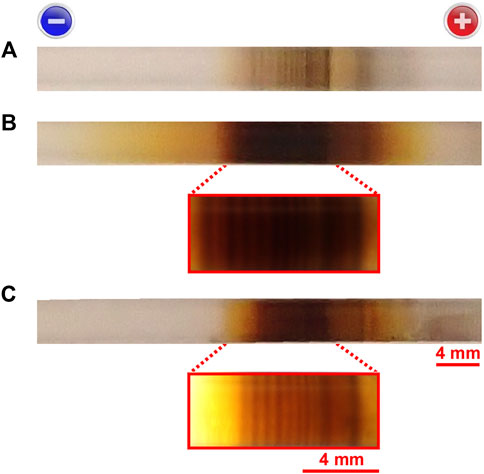
FIGURE 4. Temporal changes in precipitation patterns in the sample tube after discontinuation of the applied voltage. Precipitation pattern (A) immediately after and (B) 20.5 h after discontinuing the 5.5 V that was applied for 2.7 h. (C) Precipitation pattern 20.5 h after discontinuing the 5.5 V; this sample was immersed in 200 cm3 of deionized water for 3 h at 25°C immediately after discontinuing the application of 5.5 V and subsequently re-packed in the sample tube. Enlargements of the images of the sample tube in (B, C), backlit by an LED flashlight, are also shown. The scale bars for the normal and enlarged images are provided below the corresponding images in (C). The charges on the electrodes are indicated at the top.
As reported previously [19], while voltage was being applied, the agarose gel gradually shrunk and/or became distorted with tapp, possibly owing to the consumption of water in the sample tube by Reaction 4. After tapp ≈ 7.5 h at E = 5.5 V, this distortion became evident, particularly around the NCS region, suggesting that voltage application would have to be discontinued. Thus, gel distortion by voltage application, as well as the paining-out effect mentioned above, is a factor that limits the observation of periodic banding in the current RTR system. These limiting factors can be alleviated by introducing water into the sample tube during voltage application, which would be interesting to investigate in future.
Figure 5 compares the precipitation patterns of the four sample tubes that were prepared under the same experimental conditions: E = 5.5 V, tapp = 2.7 h, and Cadd = 0.005 M. These patterns exhibited the following common features, demonstrating their high reproducibility: (i) the periodic bands (both CS and AS bands) maintained their positions during the observation time; (ii) the color of the CS-A bands was darker than that of the CS-B bands; (iii) the CS-A bands had smaller w (≈0.25 mm) and d values (≈0.42 mm) than the CS-B bands (w ≈ 0.42 mm and d ≈ 0.68 mm); (iv) the distance between the OG and AS bands (∼3 mm) was considerably longer than the distances between adjacent CS bands. These features were maintained throughout eight additional replications that were prepared under the same experimental conditions.
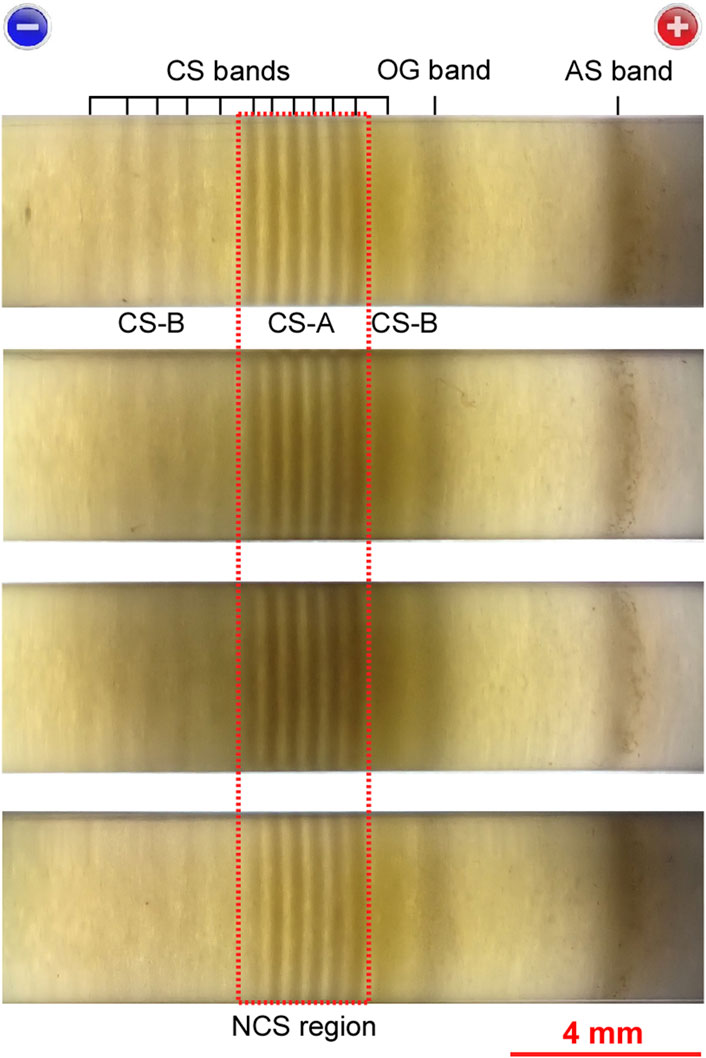
FIGURE 5. Comparison of the precipitation patterns of the four sample tubes (backlit by an LED flashlight) prepared under the same experimental conditions: Cadd = 0.005 M, E = 5.5 V, and tapp = 2.7 h. The short black bars serve as guides for the band positions and the designations defined in the text are also shown. A scale bar and charges on the electrodes are provided at the bottom and top of the image, respectively. The dashed red rectangle encloses the NCS region.
In general, owing to the inherent stochastic properties of RTR processes, the precipitation patterns of multiple samples are not completely similar even if the experimental conditions are the same. Nevertheless, as demonstrated in Figure 5, the periodic banding of the current system was much less stochastic with higher reproducibility than that of previously reported RTR systems [17–19]. As mentioned in the Introduction, the periodic banding of the current system (which occurred upon application of a constant and relatively high voltage) is fundamentally different from the banding of previously reported systems (which occurred under application of alternating and relatively low voltages). The high reproducibility shown in Figure 5 is partially attributable to the fact that the random thermal motion of the reactant ions tends to be more substantially suppressed by a larger potential gradient; the potential gradient of the current system under constant application of 5.5 V must be larger than that of previously reported systems when alternating the applied voltage between 3–4 V (1 h) and 1 V (4 h) [17–19] (note that the lengths of all the gel columns were ∼50 mm).
Notably, the abovementioned features were also different from those of classic Liesegang banding, reflecting the differences in the mechanisms that form periodic bands. For instance, in typical Liesegang-banding systems, the distance between adjacent bands (d) increases monotonically, obeying the so-called spacing law Xi+1/Xi = 1 + p, where Xi is the position of the ith band from the gel interface and p > 0 for most systems [2, 4–6, 10]. Conversely, the d values of the adjacent CS bands were randomly distributed around the average values within considerably limited ranges: 0.42 ± 0.05 mm for CS-A bands and 0.68 ± 0.07 mm for CS-B bands. Furthermore, classic Liesegang bands are successively generated in one direction (from the gel interface to the bottom of the test tube) over time [28]; conversely, current periodic bands are successively generated in two directions (both the cathode and anode directions) over time, although the cathode side was the main direction for band development.
3.2 Effect of NaNO3 concentration
Figure 6 compares typical precipitation patterns of three sample tubes that were prepared with Cadd = 0.003 M, 0.005 M, and 0.010 M (E = 5.5 V and tapp = 3tp). Periodic bands were observed for all the Cadd conditions. Although these banding patterns are similar to one another, the following Cadd dependencies are noticeable.
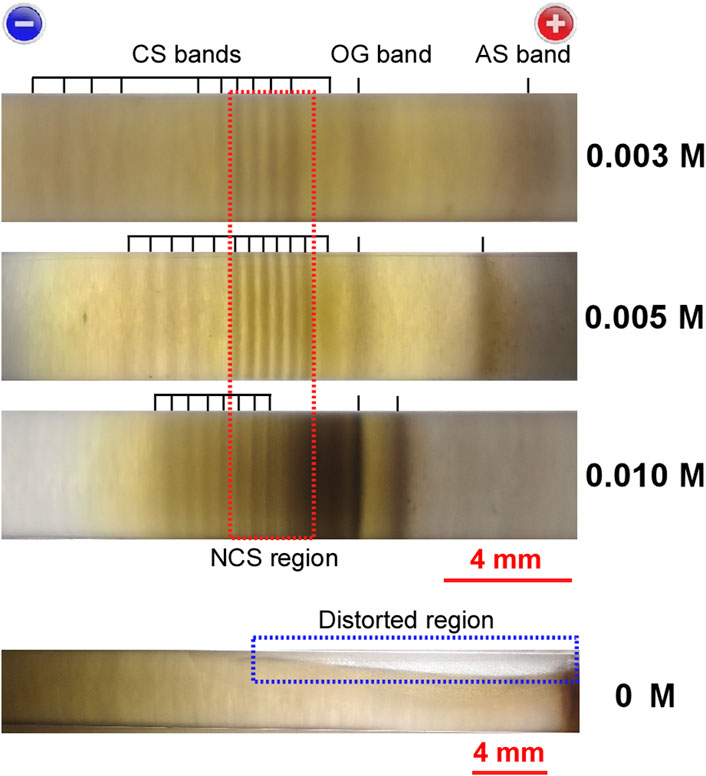
FIGURE 6. Comparison of the precipitation patterns of three sample tubes (backlit by an LED flashlight) prepared under E = 5.5 V, tapp = 3tp, and Cadd = 0.003 M, 0.005 M, and 0.010 M. The corresponding Cadd values are indicated to the right of the images. For comparison, the precipitation pattern of a sample tube that was prepared without the NaNO3 additive under E = 5.5 V and tapp = 6.5 h is shown. The short black bars serve as guides for band positions, and the band designations are also shown. Scale bars for the 0 M and 0.003–0.010 M images are provided below the corresponding images. Charges on the electrodes are provided at the top of the images. The red and blue dashed rectangles enclose, respectively, the NCS region and the region in which the gel column was distorted.
First, the brown color of the precipitates darkened with increasing Cadd, suggesting that the addition of NaNO3 promoted Ag2O precipitation, possibly through the enhancement of Reactions 1 and 2, as expected. In accordance with this suggestion, the electric current through the sample tube increased with increasing Cadd: e.g., the electric currents at tp were 39 μA, 68 μA, and 120 μA for Cadd = 0.003 M, 0.005 M, and 0.010 M, respectively. Notably, owing to the increase in Ag2O precipitates in the NCS region, the CS-A bands of the 0.010 M sample were mostly painted out to form an approximately continuous band.
Second, w and d decreased with increasing Cadd. For instance, the average w values of the CS-B bands were ∼0.5 mm (0.003 M), ∼0.4 mm (0.005 M), and ∼0.3 mm (0.010 M), and the average d values were ∼1.0 mm (0.003 M), ∼0.7 mm (0.005 M), and ∼0.5 mm (0.010 M). The distance between the OG and AS bands also decreased (∼5 mm (0.003 M), ∼4 mm (0.005 M), and ∼1 mm (0.010 M)). In accordance with these decreases, the range in which the periodic bands (including the OG and AS bands) appeared narrowed (∼19 mm (0.003 M), ∼11 mm (0.005 M), and ∼8 mm (0.010 M)). These results suggest that the addition of NaNO3 promoted the consolidation of Ag2O precipitates around the OG band and NCS region.
In summary, as Cadd increased, the widths of the periodic bands and the entire range wherein the periodic bands formed became narrower, and the distances between the adjacent bands shortened. This was accompanied by a deepening of the brown color of the Ag2O precipitates, occasionally causing the painting-out of the CS-A bands. Consequently, the intermediate concentration, Cadd = 0.005 M, was the most suitable for observing periodic banding.
For comparison, Figure 6 also shows the precipitation pattern of a sample tube that was prepared without the NaNO3 additive (Cadd = 0; E = 5.5 V and tapp = 6.5 h). Importantly, no periodic band was observed at Cadd = 0 at any time up to tapp = 6.5 h and anywhere in the sample tube, whereas the brown background gradually deepened with increasing tapp, and the gel column began to distort mainly on the anode side after tapp ≈ 4 h. These findings demonstrate that the addition of small amounts of NaNO3 is crucial for the generation of periodic bands in the current system. The development of theoretical models that could account for the observed Cadd effects would be an interesting topic for future research.
3.3 Effect of applied voltage
Figure 7 compares the typical precipitation patterns of three sample tubes that were prepared under the following conditions: E = 4.0 V, 5.5 V, and 7.0 V (Cadd = 0.005 M and tapp = 3tp). Periodic precipitation bands were observed under all the E conditions. Although these banding patterns are similar to one another, the following E dependencies are noticeable.
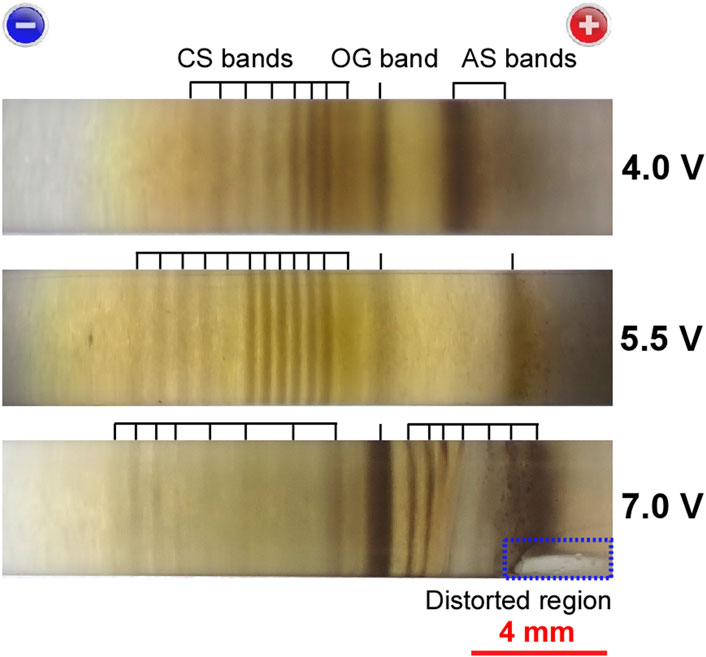
FIGURE 7. Comparison of the precipitation patterns of three sample tubes (backlit by an LED flashlight) prepared under Cadd = 0.005 M, tapp = 3tp, and E = 4.0 V, 5.5 V, and 7.0 V. The corresponding E values are indicated to the right of the images. The short black bars serve as guides for band positions, and the band designations are also shown. A scale bar and charges on the electrodes are provided at the bottom and top of the image, respectively. The blue dashed rectangle encloses the region in which the gel column was distorted.
Most impressively, the range in which the periodic bands appeared widened with increasing E (∼9 mm (4.0 V), ∼11 mm (5.5 V), and ∼15 mm (7.0 V)). This result suggests that high voltages promoted the dispersion of Ag2O precipitates throughout the sample tube.
The effect of E on the number of bands is not straightforward. As E increased under tapp = 3tp, the number of CS bands increased up to E ≈ 5.5 V but decreased beyond 6 V (8 (4.0 V), 12 (5.5 V), and 8 (7.0 V)). This is partially because tp, accordingly tapp (set at 3tp), decreased as E increased: tp = 1.5 h (4.0 V), 1.0 h (5.5 V), and 0.8 h (7.0 V). Beyond 6 V, the number of AS bands increased (2 (4.0 V), 1 (5.5 V), and 7 (7.0 V)); however, these bands were moderately distorted. The distortion of the AS bands may be partially due to the distortion of the gel column on the anode side (Figure 7), which began to occur after tapp ≈ 1.5 h.
The brown color of the precipitates did not change considerably with increasing E, implying that the Ag2O content in the precipitates was less dependent on E under the current conditions. The E stability of the brown color might be partially attributable to the aforementioned decrease in tapp for the high-E observations. The influence of the Ag2O content of the gel (closely related to the background color) on periodic banding, as well as its dependence on E, is currently unclear. For instance, at higher levels of E such as 7.0 V, the brown background caused most of the CS-A bands to become smeared, thereby preventing their clear observation, although the brown color did not substantially deepen with E.
Overall, the intermediate voltage levels, E ≈ 5.5 V, were the most suitable for observing periodic banding. The effects of the applied voltages on patterning, particularly at high voltages, have not yet been well rationalized.
3.4 Microscopic features
Figure 8 shows optical-microscopy images of the AS, OG, and CS-A bands formed under Cadd = 0.005 M, E = 5.5 V, and tapp = 2.7 h, obtained after immersion of the gel column in deionized water for 3 h. The positions where the images were acquired are indicated in the uppermost panel of the figure.
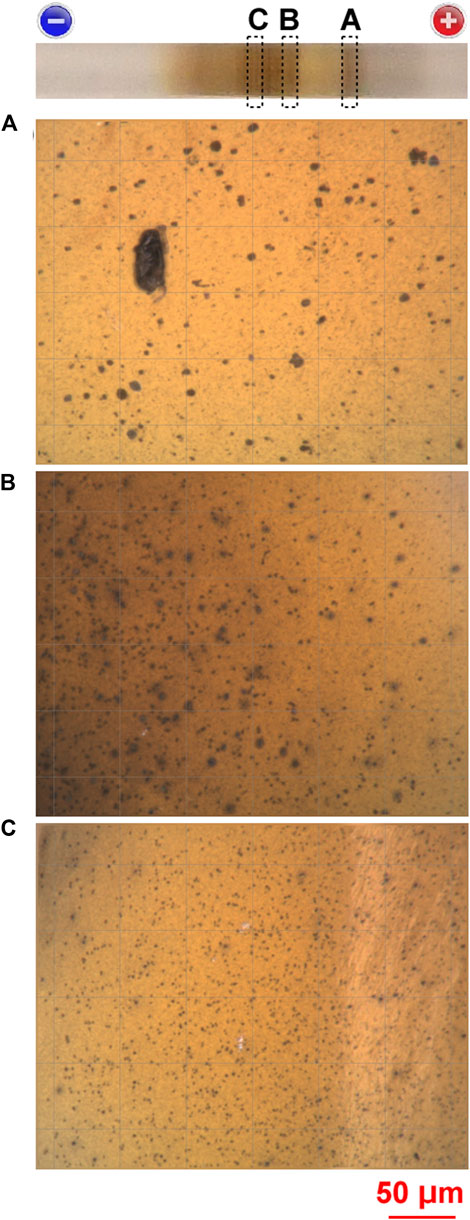
FIGURE 8. Microscopic images (×1,000) of (A) the AS, (B) OG, and (C) CS-A bands formed at 25°C under Cadd = 0.005 M, E = 5.5 V, and tapp = 2.7 h, obtained after immersion of the gel column in deionized water for 3 h. The positions at which these microscopic images were acquired are indicated in the uppermost panel. The size of the grid boxes in each microscopic image (used to estimate the size of the crystallites) is 50 μm. A scale bar and the charges on the electrodes are provided at the bottom and top of the figure, respectively.
In Figure 8, many dark brown particles (1–50 μm in size) are visible against the brown background. This finding suggests that the periodic bands comprised micrometer-scale Ag2O particles as well as gelatinous Ag2O mixed with agarose gel to form the brown background. Interestingly, the sizes of the particles in the NCS region (Figure 8C), where many CS-A bands appeared, were generally smaller than those around the BAS region, where few periodic bands appeared (Figures 8A, B). Notably, the tendency of smaller precipitates (including crystallites) to form finer periodic bands has also been reported in the classic Liesegang-banding system of Mn−Fe-based Prussian blue analogs [14].
Figure 9 shows a typical SEM image of the CS-A bands formed under Cadd = 0.005 M, E = 5.5 V, and tapp = 2.7 h, obtained after immersion of the gel column in deionized water for 3 h and subsequent drying for 3 weeks. This micrograph depicts the morphology of the micrometer-scale particle formed in the CS-A bands (Figure 8C). The particle was composed of many nanometer-scale particles with a considerable size dispersion (10–500 nm) and irregular shapes. The agglomeration of such nanoparticles was commonly observed for micrometer-scale particles in the AS, OG, and CS bands, implying that this is a basic feature of the current RTR system. Unfortunately, the requirement of a 3-week drying period for SEM measurements makes it challenging to determine the exact origin of the nanoparticles; for instance, the disintegration of the micrometer-scale precipitates while drying could also generate nanoparticles.
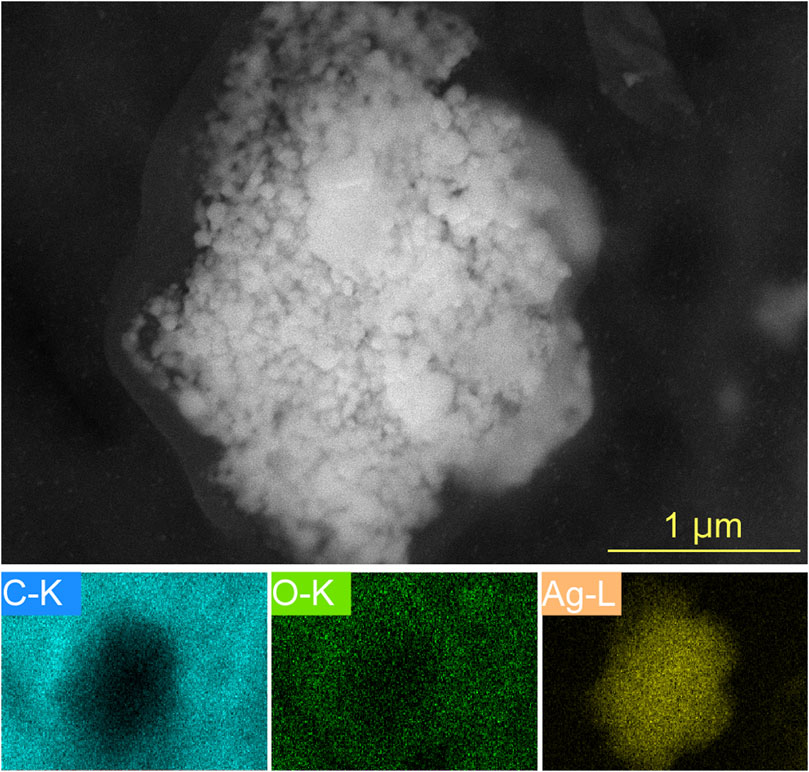
FIGURE 9. (Top) Scanning electron microscope (SEM) image (×30,000) of the CS-A bands formed at 25°C under Cadd = 0.005 M, E = 5.5 V, and tapp = 2.7 h, captured after immersion of the gel column in deionized water for 3 h and subsequent drying for 3 weeks. A scale bar is provided in the lower right corner of the image. (Bottom) Intensity maps of the C Kα, O Kα, and Ag L emission lines.
The intensity maps of the C Kα, O Kα, and Ag L emission lines appear below the SEM image. These XRF maps clearly show that the micrometer-scale particle (or the cluster of nanoparticles) contains far more Ag atoms than C atoms (which originated from the agarose gel and carbon tape employed). This result confirmed that the particle/cluster was derived from the precipitation of Ag compounds rather than from the gelation of agarose. Notably, in the particle area of these maps, the O Kα intensity was considerably lower than the Ag L-emission intensity. This finding suggests that the Ag2O in the particle/cluster was reduced by Reaction 8 during the 3-week drying period to stabilize the precipitates in the SEM-EDX experiments. The experimental conditions that would enable the Ag2O precipitates in the agarose gel to be rapidly and firmly fixed, as well as the introduction of a grating spectrometer to measure soft X-ray emission spectra in the microscope for chemical state analysis [29], are worth pursuing.
4 Discussion
4.1 Inhomogeneous distribution of reactant ions
In the current RTR system, the [Ag(H2O)4]+ and OH− ions are expected to be nonuniformly distributed throughout the sample tube. For instance, at an early stage, [Ag(H2O)4]+ ions should be relatively abundant near the anode, which continuously produces Ag+ ions via Reaction 1. Similarly, OH− ions should be relatively abundant near the cathode, which continuously produces OH− ions via Reaction 2, and relatively poor near the anode, which produces H+ ions via Reaction 4 to reduce OH− ions via Reaction 6. The inhomogeneous distribution of the reactant ions can be multifariously related to precipitation pattern formation, as described below. For instance, the suppression of the OH− concentration near the anode can account for the cathode-oriented development of precipitation bands up to tapp ≈ 2 h (Figure 3).
Importantly, the OH− ions can generate Ag(OH)2‒ ions under high-pH conditions [30], which can hinder the precipitation of AgOH and, consequently, Ag2O. Notably, Ag(OH)2‒ ions are produced from [Ag(H2O)4]+ and OH− ions:
and moved toward the anode in the presence of an electric field. Hence, the formation and subsequent transportation of this anion are practically identical to the removal of [Ag(H2O)4]+ and OH− ions from the cathode side. Such removal can generate a depletion zone for the reactant ions on the cathode side of the precipitation bands.
To consider the influence of the depletion zone on periodic banding, models of Liesegang bands may be helpful, even though their formation mechanism is different from the mechanism in the current RTR system (Section 3.1). According to the prenucleation models in classic Liesegang banding [2, 4–6], it is essential for periodic banding that a depletion zone exists in the vicinity of the precipitation band. Because of the depletion of reactant ions, the precipitates do not grow homogeneously; instead, the transportation of the reactant ions creates supersaturation conditions at a farther location (currently on the cathode side), leading to the formation of another precipitation band. Thus, the formation of Ag(OH)2‒ ions can not only suppress the extension of the precipitation bands but also promote the formation of periodic bands. Furthermore, Ag(OH)2‒ ions can contribute to the evolution of the precipitation bands on the anode side at a later stage (tapp > 5 h), as described below.
Figure 3 (particularly, the image at tapp = 2 h) shows that the [Ag(H2O)4]+ and OH− ions in the current RTR system tend to be focused near or in the NCS region by an electric field of ∼5.5 V to readily precipitate AgOH/Ag2O by Reactions 5 and 7. This finding suggests that the number of [Ag(H2O)4]+ and OH− ions decreased considerably when passing through the NCS region owing to precipitation. This suggestion is supported by the result of the electric current measurement (Figure 2); the current dwindled to less than 1/3 of the peak value after the formation of the OG and CS-A bands near or in the NCS region (tapp > 2 h). The decrease in reactant ions may reduce the amount of precipitates to lighten the color of the precipitation bands. Furthermore, the decrease may widen the distances between the precipitation bands and increase the stochasticity of the precipitate position, thereby increasing the d and w values of the formed precipitation bands. These expected properties with a decrease in the number of reactant ions have been observed in many precipitation systems in gels [2], including Liesegang banding systems [28], and account for the differences in the basic features (Section 3.1) of the (reactant ion-abundant) CS-A and (reactant ion ([Ag(H2O)4]+)-poor) CS-B bands. Similarly, the suggested low concentration of OH− ions near the anode could account for the lack of brown precipitates around this electrode (Figure 3). Note also that the low concentration of [Ag(H2O)4]+ ions near the cathode contributes to suppress possible side reactions at this electrode, such as
In contrast to the CS bands, the AS bands tended to be broad and continuous (Figures 3–7), unless the applied voltages was higher. This tendency can be explained as follows. On the anode side (where the pH is expected to be relatively low), the generation and subsequent transportation of Ag(OH)2‒ ions are less expected; therefore, the formation of a depletion zone of reactant ions and periodic banding are less likely, (basically) in accordance with current observations.
The (expected) low-pH condition on the anode side can promote the reverse reaction of Reaction 9. Activation of this reverse reaction would result in the additional supply of [Ag(H2O)4]+ and OH− ions to the anode side. The formation of Ag(OH)2‒ ions on the cathode side and their decomposition on the anode side (that is, the transportation of the reactant ions from the cathode side to the anode side), as well as the formation of the reactant ions themselves, can be accelerated under high-voltage conditions. Such acceleration can increase the inhomogeneities in the concentrations of the reactant ions and may trigger the periodic banding on the anode side (Figure 7), although the detailed mechanism is currently unclear.
The above discussion suggests that the inhomogeneous distribution of the reactant ions and their time dependence are key factors for further understanding the periodic banding in the current RTR system, and the experimental measurements of these factors are an important future challenge.
4.2 Potential applications
Currently, periodic-banding phenomena have limited practical applications, although several new potential applications, such as Cs adsorption [31], have recently been suggested. The periodic banding of Ag2O (possibly containing metallic Ag) through the RTR processes reported here has the potential to change the status quo because it is readily applicable to hydrogel systems in which other compounds (with functionalities) already precipitate. Such applications can produce position-dependent conglomerates of multiple types of precipitates and, consequently, induce layering and complications to enhance the functionality of the original system. Additionally, the amount of metallic Ag in the precipitates could be controlled by irradiation with light. These possibilities are of technological interest for the preparation of heterogeneous Ag-related catalysts and their precursors. Specifically, the application to hydrogels containing CeO2 precipitates seems to be one of the future directions of current RTR patterning because the heterojunction of Ag2O and CeO2 has been reported to improve the photocatalytic activity of CeO2 [32].
5 Conclusion
Submillimeter-scale (w ≈ d ≈ 0.4 mm) periodic bands of Ag2O precipitates were transiently generated with high reproducibility via the RTR processes upon application of a constant voltage. The experimental conditions of Cadd ≈ 0.005 M, E ≈ 5.5 V, and tapp ≈ 3 h were most suitable for observing the periodic bands clearly. The bands were suggested to contain micrometer-scale clusters of Ag-abundant nanoparticles with considerable size dispersions. As tapp increased, the banding patterns were gradually painted out to form an almost continuous broad band, even after discontinuation of the applied voltage. However, immersion of the gel column in deionized water for 3 h suppressed this uniformization. The observed banding properties are substantially different from those of classic Liesegang bands and have the potential to be used for the preparation of heterogeneous Ag-related catalysts, which could be expected to stimulate further theoretical and experimental studies.
Data availability statement
The original contributions presented in the study are included in the article/Supplementary material, further inquiries can be directed to the corresponding author.
Author contributions
HH: Conceptualization, Data curation, Formal Analysis, Funding acquisition, Investigation, Methodology, Project administration, Resources, Software, Supervision, Validation, Visualization, Writing–original draft, Writing–review and editing. KY: Data curation, Formal Analysis, Investigation, Methodology, Writing–review and editing.
Funding
The author(s) declare that no financial support was received for the research, authorship, and/or publication of this article.
Acknowledgments
The authors are grateful to Dr. T. Takagi of the Laboratory of Electron Microscopy, Japan Women’s University for operation of the SEM-EDX instrumentation.
Conflict of interest
The authors declare that the research was conducted in the absence of any commercial or financial relationships that could be construed as a potential conflict of interest.
Publisher’s note
All claims expressed in this article are solely those of the authors and do not necessarily represent those of their affiliated organizations, or those of the publisher, the editors and the reviewers. Any product that may be evaluated in this article, or claim that may be made by its manufacturer, is not guaranteed or endorsed by the publisher.
References
1. Liesegang RE. Ueber einige eigenschaften von gallerten. Naturwiss Wochenschr (1896) 11:353–62. doi:10.1007/BF01830142
2. Henisch HK. Crystals in gels and Liesegang rings. Cambridge, UK: Cambridge University Press (1988). p. 116–75.
3. Sadek S, Sultan R. Liesegang patterns in nature: a diverse scenery across the sciences. In: I Lagzi, editor. Precipitation patterns in reaction–diffusion systems. Kerala, India: Research Signpost (2010). p. 1–43.
4. Nabika H. Liesegang phenomena: spontaneous pattern formation engineered by chemical reactions. Curr Phys Chem (2015) 5:5–20. doi:10.2174/187794680501150908110839
5. Nabika H, Itatani M, Lagzi I. Pattern formation in precipitation reactions: the Liesegang phenomenon. Langmuir (2020) 36:481–97. doi:10.1021/acs.langmuir/9b03018
6. Nakouzi E, Steinbock O. Self-organization in precipitation reactions far from the equilibrium. Sci Adv (2016) 2:1601144. doi:10.1126/sciadv.1601144
7. Arango-Restrepo A, Barragán D, Rubi JM. Self-assembling outside equilibrium: emergence of structures mediated by dissipation. Phys Chem Chem Phys (2019) 21:17475–93. doi:10.1039/C9CP01088B
8. Grzybowski BA, Bishop KJM, Campbell CJ, Fialkowski M, Smoukov SK. Micro- and nanotechnology via reaction–diffusion. Soft Matter (2005) 1:114–28. doi:10.1039/B501769F
9. Grzybowski BA, Campbell CJ. Fabrication using ‘programmed’ reactions. Mater Today (2007) 10:38–46. doi:10.1016/S1369-7021(07)70131-1
10. Grzybowski BA. Chemistry in motion: reaction–diffusion systems for micro- and nanotechnology. Chichester, UK: John Wiley and Sons (2009). p. 1–163.
11. Qiao H, Sun S, Wu P. Non-equilibrium-growing aesthetic ionic skin for fingertip-like strain-undisturbed tactile sensation and texture recognition. Adv Mater (2023) 35:2300593. doi:10.1002/adma.202300593
12. Lagzi I, Kowalczyk B, Grzybowski BA. Liesegang rings engineered from charged nanoparticles. J Am Chem Soc (2010) 132:58–60. doi:10.1021/ja906890v
13. Nabika H, Sato M, Unoura K. Liesegang patterns engineered by a chemical reaction assisted by complex formation. Langmuir (2014) 30:5047–51. doi:10.1021/la5003786
14. Hayashi H, Aoki S, Suzuki T. Spontaneous precipitation pattern formation by crystallites of Mn-Fe-based Prussian blue analogues in agarose gel. RSC Adv (2019) 9:36240–7. doi:10.1039/c9ra07960b
15. Ackroyd AJ, Holló G, Mundoor H, Zhang H, Gang O, Smalyukh , et al. Self-organization of nanoparticles and molecules in periodic Liesegang-type structures. Sci Adv (2021) 7:eabe3801. doi:10.1126/sciadv.abe3801
16. Farkas S, Fonyi MS, Holló G, Német N, Valletti N, Kukovecz Á, et al. Periodic precipitation of zeolitic imidazolate frameworks in a gelled medium. J Phys Chem C (2022) 126:9580–6. doi:10.1021/acs.jpcc.2c02371
17. Hayashi H, Suzuki T. A reaction‒diffusion‒reaction system for forming periodic precipitation bands of Cu–Fe-based Prussian blue analogues. Appl Sci (2021) 11:5000. doi:10.3390/app11115000
18. Hayashi H. Precipitation patterns in reaction–diffusion–reaction systems of Prussian blue and Cu‒Fe-based Prussian blue analogs. Front Phys (2022) 10:828444. doi:10.3389/fphy.2022.828444
19. Hayashi H. Periodic band formation of Fe(OH)3 precipitate through reaction–diffusion–reaction processes. Front Phys (2023) 11:1114106. doi:10.3389/fphy.2023.1114106
20. Das I, Pushkarna A, Chand S. Electrical field effect on periodic precipitation and chemical waves in gel media in batch and continuous-flow reactors. J Colloid Interf Sci (1992) 150:178–86. doi:10.1016/0021-9797(92)90278-T
21. Lagzi I. Formation of Liesegang patterns in an electric field. Phys Chem Chem Phys (2002) 4:1268–70. doi:10.1039/B109835G
22. Bena I, Droz M, Lagzi I, Martens K, Rácz Z, Volford A. Designed patterns: flexible control of precipitation through electric currents. Phys Rev Lett (2008) 101:075701. doi:10.1103/PhysRevLett.101.075701
23. Karam T, Sultan R. Effect of an alternating current electric field on Co(OH)2 periodic precipitation. Chem Phys (2013) 412:7–12. doi:10.1016/j.chemphys.2012.11.008
24. Wang X, Li S, Yu H, Yu J, Liu S. Ag2O as a new visible-light photocatalyst: self-stability and high-photocatalytic activity. Chem Eur J (2011) 17:7777–80. doi:10.1002/chem.201101032
25. Sullivan KT, Wu C, Piekiel NW, Gaskell K, Zachariah MR. Synthesis and reactivity of nano-Ag2O as an oxidizer for energetic systems yielding antimicrobial products. Combust Flame (2013) 160:438–46. doi:10.1016/j.combustflame.2012.09.011
26. Wei W, Mao X, Ortiz LA, Sadoway DR. Oriented silver oxide nanostructures synthesized through a template-free electrochemical route. J Mater Chem (2011) 21:432–8. doi:10.1039/C0JM02214D
27. Badr L, Epstein I. Propagation behavior of silver hydroxide precipitate bands. Chem Phys Lett (2022) 800:139681. doi:10.1016/j.cplett.2022.139681
28. Hayashi H, Abe H. X-ray spectroscopic analysis of Liesegang patterns in Mn-Fe-based Prussian blue analogs. J Anal Spectrom (2016) 31:1658–72. doi:10.1039/C6JA00173D
29. Terauch M, Hatano T, Koike M, Pirozhkov AS, Sasai H, Nagano T, et al. Recent developments in soft X-ray emission spectroscopy microscopy. IOP Conf Ser Mater Sci Eng (2020) 891:012022. doi:10.1088/1757-899X/891/1/012022
30. Cotton FA, Wilkinson G. Advanced inorganic chemistry, A comprehensive text. New York, USA: John Wiley and Sons (1972). p. 1047.
31. Hayashi H. Cs sorption of Mn–Fe based Prussian blue analogs with periodic precipitation banding in agarose gel. Phys Chem Chem Phys (2022) 24:9374–83. doi:10.1039/D2CP00654E
32. Wen XJ, Niu CG, Zhang L, Liang C, Zeng GM. A novel Ag2O/CeO2 heterojunction photocatalytic degradation of enrofloxacin: possible degradation pathways, mineralization activity and an in depth mechanism insight. Appl Catal B (2018) 221:701–14. doi:10.1016/j.apcatb.2017.09.060
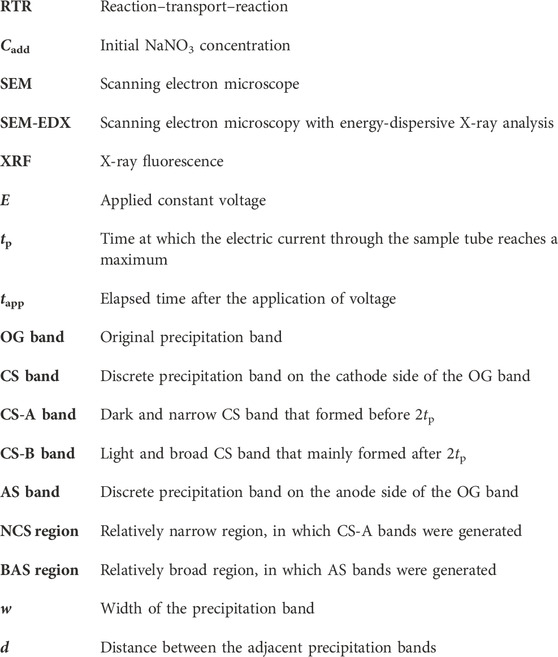
Nomenclature
Keywords: precipitation pattern, periodic banding, Ag2O, reaction-transport system, electrochemical reaction, nanoparticle, OH– distribution
Citation: Hayashi H and Yamada K (2024) Transient submillimeter-scale periodic banding of Ag2O precipitate through reaction–transport–reaction processes. Front. Phys. 12:1365863. doi: 10.3389/fphy.2024.1365863
Received: 05 January 2024; Accepted: 20 February 2024;
Published: 01 March 2024.
Edited by:
Hideki Nabika, Yamagata University, JapanReviewed by:
Sunil Kulkarni, Sir Parshurambhau College, IndiaFabio David Alves Aarão Reis, Fluminense Federal University, Brazil
Bilge Baytekin, Bilkent University, Türkiye
Copyright © 2024 Hayashi and Yamada. This is an open-access article distributed under the terms of the Creative Commons Attribution License (CC BY). The use, distribution or reproduction in other forums is permitted, provided the original author(s) and the copyright owner(s) are credited and that the original publication in this journal is cited, in accordance with accepted academic practice. No use, distribution or reproduction is permitted which does not comply with these terms.
*Correspondence: Hisashi Hayashi, aGF5YXNoaWhAZmMuand1LmFjLmpw