 Khouloud Issa
 Rabih Sultan
- Department of Chemistry, American University of Beirut, Beirut, Lebanon
We carry out an evolutionary study of the COVID-19 pandemic, focusing on the case of Lebanon. The disease spread exhibits four eruption phases or waves. Chaos theory tools point toward a correlation of events, essentially obeying a quasi-deterministic chaotic regime. The analysis of the time series yields a largest Lyapunov exponent of 0.263, indicative of a chaotic trend. The review of past and recent analyses and modeling of pandemics could assist in the predictabilty of their course of evolution, effective management and decision making for health authorities.
1 Introduction
The Coronavirus Disease (COVID-19) pandemic has emerged as one of the most global health crises in recent history [1]. Caused by the Severe Acute Respiratory Syndrome Coronavirus 2 (SARS-COV-2), the disease was first identified in December 2019 in Wuhan, China. Due to close human-to-human contacts, the transmission of SARS-COV-2 occurred and extended swiftly to cross geographical boundaries, resulting in a global outbreak [2]. Since then, COVID-19 has been affecting every region around the globe, inducing viral pneumonia with distinct symptoms [3]. Unfortunately, infectious diseases continue to pose a substantial risk to the entire human population [4]. For this, almost all countries have enforced serious preventive measures among their citizens in a hope to mitigate the spread of the emerging SARS-COV-2 outbreak [5]. These included, but were not limited to, travel restrictions and complete or partial national lockdowns, in addition to mandatory wearing of face masks, social distancing, and quarantining after exposure to a suspected or confirmed case of COVID-19 [1]. Last but not least, the pandemic has imposed a lengthy chain of online classes and online meetings throughout the world.
Focusing on Lebanon, the first confirmed case of COVID-19 was announced on 21 February 2020 [4]. Up till 31 December 2022, the number of cases in Lebanon had already reached a total confirmed cases surpassing 1,222,808, and a total of 10,747 lives lost due to this infectious disease [6]. The Lebanese Government announced a state of emergency in the country and implemented stringent health and social measures to reduce the transmission of SARS-COV-2 and its variants. Additionally, the national vaccine campaign was successfully launched in due time, leading to a gradual reduction in the number of reported cases and rates of incidence [1].
To better understand the pandemic, researchers usually analyze aspects of COVID-19 in terms of pathology behavior and sociology perspectives. Besides, they also study its method of infection, propagation, and the estimation of future outcomes. While observing the complex network of the disease spread, researchers identify approaches for prediction and modeling purposes [7]. More specifically, chaos theory has been a powerful approach used to define an ongoing pandemic through analyzing its propagating dynamics and extracting its major deterministic components [8]. Recently, chaotic behavior of pandemics have been extensively reported in literature such as the Plague epidemic in Bombay, India [9], and the Ebola Virus epidemic in West Africa [10]. Consequently, developing an efficient mathematical model will help predicting the future outcomes of an emerging virus outbreak, and will also contribute to create prompt control strategies [8].
In the present research, we aim to investigate the spread of COVID-19 in Lebanon, as a case study covering a considerable period of time, to detect eventual chaos from real-time data provided by the Lebanese Ministry of Public Health (LMOPH). For this objective, we extracted publicly accessible data about COVID-19 from the LMOPH Epidemiologic Surveillance Unit’s up until 31 December 2022. These data include daily confirmed new cases and new deaths across the period from the month of February 2020 till the last day of year 2022 [11]. To address the missing data in MOPH’s online portal, we sought information from the World Health Organization (WHO) data sources for COVID-19 in Lebanon [12].
Through daily visualizations of case variations over the mentioned period of time, especially after introducing vaccination to the community, we attempt to assess the burden of the COVID-19 pandemic on the Lebanese population. Subsequently, the purpose of this research relies on underlining the chaotic course of COVID-19 epidemic in Lebanon to understand its complex behavior and better predict effective measures for the future.
2 The pandemic in Lebanon
Lebanon received its first batch of COVID-19 vaccines on Saturday, 13 February 2021 with aid from the World Bank, which said it would monitor the inoculation drive to ensure the shots go to those most in need. About 28,500 doses of the Pfizer-BioNTech vaccine landed at Beirut airport, the first of 2.1 million doses set to arrive in stages throughout the year. A truck carrying the first batch of doses of the Pfizer/BioNTech vaccine against the COVID-19 arrives at Rafik Hariri University Hospital, in Beirut, Lebanon, on 13 February 2021 [13].
We start by depicting the variation of the positive cases and deaths from February 2020 until December 2022. Figure 1A, shows the variation of the number of cases with time (in days) from February 2020 until December 2022. The evolution of the disease spread shows four essential phases (labeled 1-4 on the graph), referred to here as waves. Figure 1B displays the graph of the number of deaths over the same period, showing an obvious correlation.
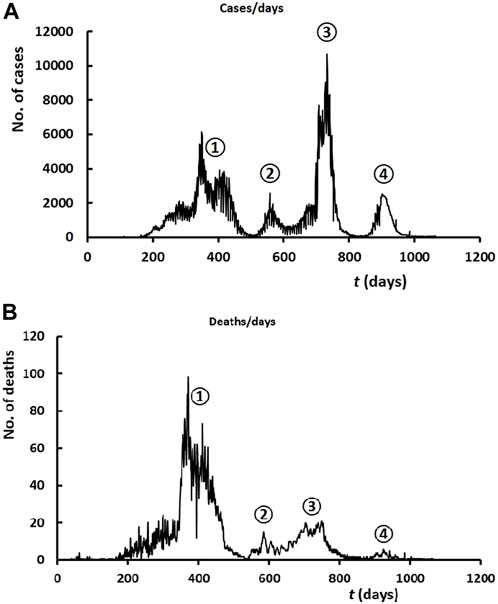
FIGURE 1. (A) Time evolution of the COVID-19 cases in Lebanon, over the period 2020–2022. (B) Time evolution of the number of deaths.
The minimum reached after the first wave on day 507 (21 June 2021, with 43 cases and 3 deaths) clearly reveals the effect of the vaccination, started on day 378 (13 February 2021; recall that day 1 falls on 1 February 2020). On the scale of months, we also see that the month of June shows the least number of cumulative cases; please refer to the blue curve in Figure 2A, again reflecting the effect of the vaccination operation. It is interesting to remark here that the beginning of the alarming increase in the number of deaths in 2020 (green curve in Figure 2B) coincides with the minimum number of cases in 2021 (the month of July), following the effect of the vaccines. Thus, we conclude that the panic era of the pandemic spanned almost exactly 1 year. The second minimum after the inevitable eruption of the second wave occurs on day 633 (25 October 2021). Both the second and the third wave peaks (maxima at days 558 and 733) are attributed to the increase in socialization gatherings, and hence the lack of observation of social distancing during the months of August 2021 (summer break) and February 2022 (Christmas and end-of-year break). Finally the third minimum appears on day 836 (16 May 2022). The epidemic has then subsided, after a mild fourth and last wave.
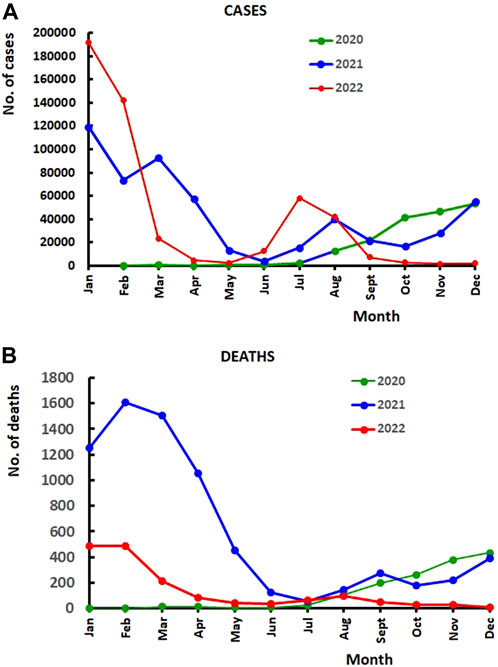
FIGURE 2. (A) Monthly variation of the COVID-19 cases in Lebanon, over the years 2020, 2021, and 2022. (B) Monthly variation of the number of deaths over the years 2020, 2021 and 2022.
3 Nonlinear dynamical analysis
We now present an analysis of the dynamical evolution of the pandemic and investigate the deterministic nature of the disease spread.
3.1 Return maps
Figure 3 displays the point scatter of a return map with a time delay of 1 day. The scatter is clearly distributed around a central correlation line with slope 0.97 ± 0.04.
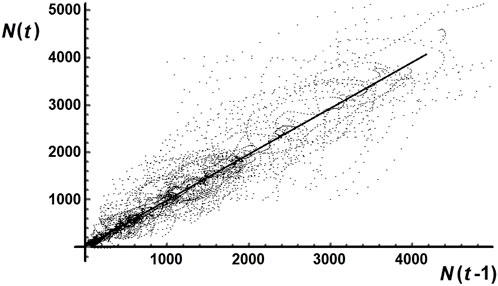
FIGURE 3. Return map for the entire set of data, with time delay of 1 day.
We now aim at studying the dynamics within a given wave, and select wave 1 for that purpose. Figure 4A shows the time evolution of the number of cases N over the wave-1 time span (first 500 days). We notice three eruption phases (labeled A, B, and C). To select the time lag T, we construct the autocorrelation function C(T) as follows [14]:
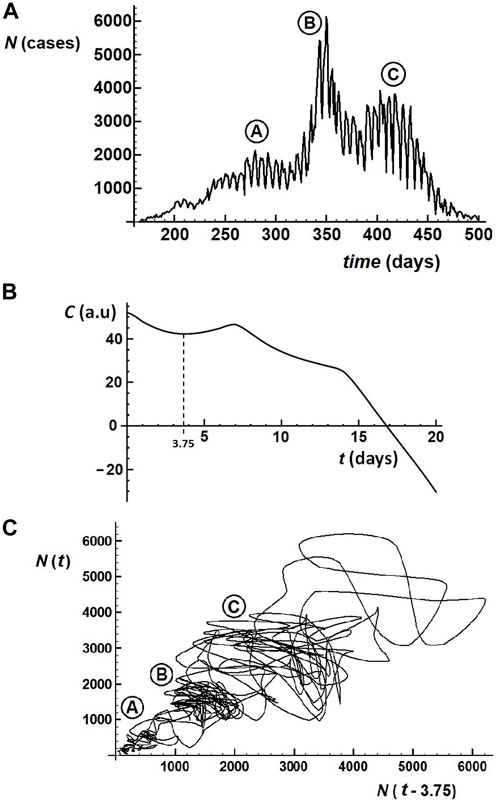
FIGURE 4. (A) Time evolution of the SARS-COV-2 cases during the first wave (days 1–500). (B) Plot of the autocorrelation function (Eq. 1) for the determination of the minimum time delay. (C) Return map with a time delay of 3.75 days.
where:
By applying this protocol to the first wave, we determine that the first minimum occurs at a value of T = 3.75 days, as depicted in Figure 4B. We therfore construct the first wave return map by plotting N(t) versus N (t–3.75). The corresponding plot is shown in Figure 4C. The three phases of frame 4A are visibly separated as clear, independent phases, yet having a correlative character.
3.2 Phase portraits
We now seek another assessment of the dynamical evolution of the pandemic, by constructing phase portraits. Figure 5 displays a phase portrait for the entire set of data.
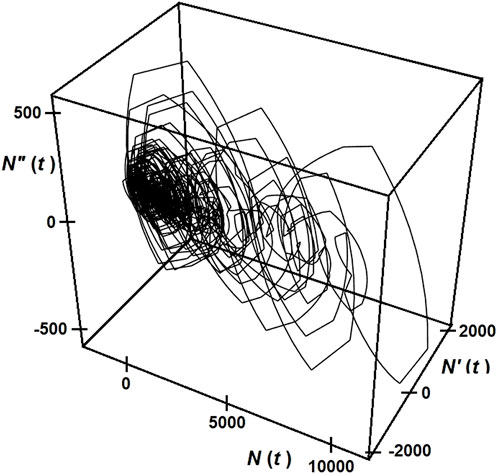
FIGURE 5. Phase portrait over the entire two-years duration of the disease caused by the COVID-19 virus.
For convenience, we focus our attention on wave 1 (see Figures 1, 4A), and examine the phase portraits. Figure 6A shows the phase portrait, restricted to the first wave data. It clearly indicates quasi chaotic behavior, revealing a kind of deterministic correlation between the successive days of the pandemic. In parallel, a correlation relation with the evolution of the enire set (Figure 5) is discerned. Figure 6B displays the cross section of the latter portrait with the plane N (x) = 0, shown here as disjoined points. We notice a trajectory reminiscent of that for a strange attractor.
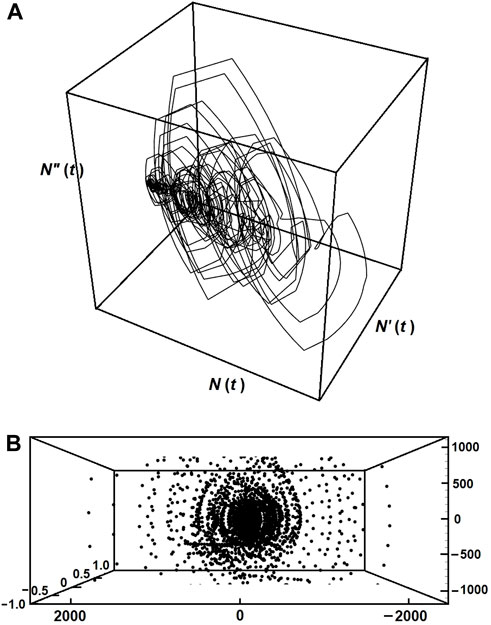
FIGURE 6. (A) Phase portrait for the first wave spread of the COVID-19 cases in Lebanon. (B) Cross section plane at N(t) = 0, yielding a strange attractor trajectory.
3.3 Lyapunov exponents
Given any two trajectories N (t), separated by a distance δN(t), the deviation between the two trajectories is described by the expression |δN(t)| = eλt|δN0|, where δN0 is the separation at time t = 0. The exponent λ is the Lyapunov exponent, which measures the rate of separation (convergence/divergence) of the two infinitesimally close trajectories [15, 16]. Hence, the Lyapunov exponent can be defined as:
It can be shown [16] that, for a discrete time system (map or fixed point iterations) with an interpolation function f (Nt), the Lyapunov exponent reduces to:
Here, we choose to calculate the Lyapunov exponent for the first wave with a time interval of 1 day. The points N (t) are interpolated into a function f (Nt), then the derivative is evaluated, and λ is calculated from Eq. 3. The resulting Lypunov exponent is plotted at increments of 0.028 in Figure 7.
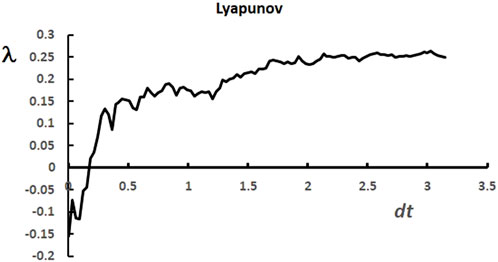
FIGURE 7. Lyapunov exponent for the first wave of COVID-19 cases. The positive value of 0.263 for the largest Lyapunov exponent is indicative of correlative chaos.
Here again, we reobtain the behavior of a chaotic evolution, indicated by a positive Lyapunov exponent over the near early and long time evolution of the series. The largest Lyapunov exponent is found to be equal to 0.263 ± 0.083.
4 Conclusion
The present study showed that the spread of the COVID-19 disease obeys a quasi chaotic dynamical evolution, in spite of the sudden, unpredictable outburst of the pandemic. The disease spread featured essentially four main waves, interrupted by minima attributed to various factors such as vaccination, lockdowns, distancing, and face mask protection. Each wave (exemplified here by the study of wave 1) exhibits a series of correlated dynamical oscillations.
The current analysis, coupled to other existing dynamical studies on past and recent pandemics, no doubt correlates to the predictability and evolution of future pandemics, and hence helps in the management and decision making by health authorities. Research studies conducted on the COVID-19 pandemic in a number of countries including China, Japan, South Korea and Italy [17] have demonstrated chaotic behavior. The intensive research campaign launched worldwide to release the vaccines as early as possible was a breakthrough and helped speed up the attenuation, subsiding and eventual extinction of the pandemic, as well as increase the immunity to the disease. As pointed out in Section 2, and illustrated in Figures 1, 2, the tremendous decrease indicated by the minima in the evolution of the pandemic reveals the effect of the aggressive vaccination campaign.
As a whole, we can confidently say that the vaccination campaign in Lebanon has been well managed. The sharp increase in the number of cases (up to
Data availability statement
Publicly available datasets were analyzed in this study. This data can be found here: https://www.moph.gov.lb/en/Pages/9/1024/the-ministry.
Author contributions
KI: Data curation, Investigation, Resources, Writing–review and editing. RS: Conceptualization, Formal Analysis, Methodology, Writing–original draft.
Funding
The author(s) declare financial support was received for the research, authorship, and/or publication of this article. University Research Board (URB)–American University of Beirut (AUB) AUB-URB Award: 104391, Project: 26771, Organization: 11140.
Acknowledgments
The authors thank the University Research Board (URB) at the American University of Beirut (AUB), for partial funding of the project.
Conflict of interest
The authors declare that the research was conducted in the absence of any commercial or financial relationships that could be construed as a potential conflict of interest.
The handling editor IL declared a past collaboration with the author RS.
Publisher’s note
All claims expressed in this article are solely those of the authors and do not necessarily represent those of their affiliated organizations, or those of the publisher, the editors and the reviewers. Any product that may be evaluated in this article, or claim that may be made by its manufacturer, is not guaranteed or endorsed by the publisher.
References
1. Abou Hassan FF, Bou Hamdan M, Ali F, Melhem NM. Response to COVID-19 in Lebanon: update, challenges and lessons learned. Epidemiol Infect (2023) 151:e23. doi:10.1017/S0950268823000067
2. Mangiarotti S, Peyre M, Zhang Y, Huc M, Roger F, Kerr Y. Chaos theory applied to the outbreak of COVID-19: an ancillary approach to decision making in pandemic context. Epidemiol Infect (2020) 148:e95. doi:10.1017/S0950268820000990
3. Postavaru O, Anton SR, Toma A. COVID-19 pandemic and chaos theory. Mathematics Comput Simulation (2021) 181:138–149. doi:10.1016/j.matcom.2020.09.029
4. Bizri AR, Khachfe HH, Fares MY, Musharrafieh U. COVID-19 Pandemic: an insult over injury for Lebanon. J Community Health (2021) 46:487–493. doi:10.1007/s10900-020-00884-y
5. Chen H, Shi L, Zhang Y, Wang X, Jiao J, Yang M, et al. Response to the COVID-19 Pandemic: comparison of strategies in six countries. Front Public Health (2021) 9:708496. doi:10.3389/fpubh.2021.708496
6. MOPH. Epidemiological surveillance program of COVID-19 (2023). Retrieved from/2/24870/novel-coronavirus-2019 https://www.moph.gov.lb/en/Pages (Accessed January 2, 2023).
7. He S, Peng Y, Sun K. SEIR modeling of the COVID-19 and its dynamics. Nonlinear Dyn (2020) 101:1667–1680. doi:10.1007/s11071-020-05743-y
8. Borah M, Gayan A, Sharma JS, Chen Y, Wei Z, Pham V-T. Is fractional-order chaos theory the new tool to model chaotic pandemics as Covid-19? Nonlinear Dyn (2022) 109:1187–1215. doi:10.1007/s11071-021-07196-3
9. Mangiarotti S. Low dimensional chaotic models for the plague epidemic in Bombay (1896-1911). Chaos, Solitons and Fractals (2015) 81:184–196. doi:10.1016/j.chaos.2015.09.014
10. Mangiarotti S, Peyre M, Huc M. A chaotic model for the epidemic of Ebola virus disease in West Africa (2013–2016). Chaos (2016) 26:113112. doi:10.1063/1.4967730
11. MOPH. MOPH website (2023). https://www.moph.gov.lb/en/Pages/9/1024/the-ministry (Accessed August 23, 2023).
12. WHO. Coronavirus disease (COVID-19) dashboard with vaccination data (2023). Retrieved from: Lebanon: WHO Coronavirus Disease (COVID-19) Dashboard With Vaccination Data | WHO Coronavirus (COVID-19) Dashboard With Vaccination Data https://www.france24.com/en/middle-east/20210214-lebanon-starts-covid-19-vaccination-campaign (Accessed July 27, 2023).
13. Mohamed A, Azakir M. Reuters (2021). https://www.reuters.com/world/middle-east/lebanon-restricts-cafes-beaches-vaccinated-or-covid-tested-2021-07-30/ (Accessed September 8, 2022).
15. Wolf A, Swift J, Swinney HL, Vastano J. Determining Lyapunov exponents from a time series. Physica D (1985) 16:285–317. doi:10.1016/0167-2789(85)90011-9
16. Lopéz Jiménez AM, Camacho Martínez Vara de Rey C, García Torres AR. Effect of parameter calculation in direct estimation of the Lyapunov exponent in short time series. Discrete Dyn Nat Soc (2002) 7:41–52. doi:10.1080/10260220290013507
Keywords: coronavirus, COVID-19, dynamics, chaos, Lebanon
Citation: Issa K and Sultan R (2024) Dynamics of the COVID-19 pandemic in Lebanon between 2020 and 2022. Front. Phys. 12:1363918. doi: 10.3389/fphy.2024.1363918
Received: 31 December 2023; Accepted: 31 January 2024;
Published: 19 February 2024.
Edited by:
Istvan Lagzi, Budapest University of Technology and Economics, HungaryReviewed by:
Federico Rossi, University of Siena, ItalyIstván Szalai, Eötvös Loránd University, Hungary
Copyright © 2024 Issa and Sultan. This is an open-access article distributed under the terms of the Creative Commons Attribution License (CC BY). The use, distribution or reproduction in other forums is permitted, provided the original author(s) and the copyright owner(s) are credited and that the original publication in this journal is cited, in accordance with accepted academic practice. No use, distribution or reproduction is permitted which does not comply with these terms.
*Correspondence: Rabih Sultan, cnN1bHRhbkBhdWIuZWR1Lmxi