 Wang Dangshu
 Yang Likang1,2
- 1School of Electrical and Control Engineering of Xi’an University of Science and Technology, Xi’an, Shanxi, China
- 2Xi’an Key Laboratory of Electrical Equipment Condition Monitoring and Power Supply Security, Xi’an, Shanxi, China
- 3School of Science of Xi’an University of Science and Technology, Xi’an, Shanxi, China
Capacitors short-circuit discharge in an explosive environment can ignite and detonate the surrounding explosive media, causing dangerous accidents. At low voltages, this kind of discharge constitutes a micro-nano discharge; because the discharge gaps here are of the order of only microns to nanometers, the discharge process, electrode energy consumption, explosive media ignition energy, and other energy relationships are unclear. To study the relationships between the capacitor storage energy and various kinds of dissipation energies under short-circuit discharge, a model comprising conical and spherical cylinder microbumps is proposed based on the cathode surface morphology obtained by three-dimensional profiling and scanning electron microscopy, respectively. Then, the second-order non-chi-squared differential equations were established based on the principle of energy conservation and heat balance to deduce the relationships between the cathode surface temperature and height of the microbump, conical angle, and spherical radius; further, the energy consumed by the anode surface is calculated based on the theory of heat transfer. Using heat conduction theory, the energy consumed by the microbumps on the cathode surface is calculated, and the energy consumed on the anode surface is deduced using the surface heat source as the loading heat source. The residual energy of the capacitor is calculated from the discharge time and voltages before and after discharge, and the effective energy of the gas is calculated using the law of conservation of energy. Finally, the discharge channel energy, electrode energy consumption, and end residual energy of the discharge capacitor are used to derive the effective ignition energy of the explosive gas. This research is of great significance for the design of intrinsically safe circuits with high power.
1 Introduction
Switched power supply energy storage components, such as capacitors and inductors, can produce spark or arc discharges in the event of failure caused by capacitance short-circuit discharge or inductance fracture. Here, the discharge time is short, discharge energy density is high, and surrounding hazardous media are easily ignited, resulting in casualties and property damage. The Chinese national standards require that power supplies used in explosive environments should meet the explosion-proofing requirements [1]. An intrinsically safe circuit is the best form of explosion proofing, which is achieved through device parameter calculations and related circuit design, such that the cutoff discharge of the energy generated in the event of a short-circuit discharge is not sufficient to ignite the surrounding explosive media. Intrinsically safe power supplies are free from bulky explosion-proof housings and have the advantages of small size and high power density. However, because of the energy of the discharge process, the lack of awareness regarding the roles of the explosive medium energy, electrode energy consumption, and end residual energy of the discharge circuit during circuit design as well as conservative component parameter calculations have resulted in excessive explosion proofing and suppression; these have also resulted in lower values of the intrinsically safe switching converter outputs of only 20 W or so, hindering the design and application of high-power switching converters.
To increase the output power of an intrinsically safe power supply, researchers have investigated various aspects. A short circuit in the output of a switching converter, which is a core part of a switched power supply, can be equated to a short circuit in the output of a capacitor [2]. Scholars have carried out many studies on capacitive short-circuit discharge, such as the discharge characteristic curve segmentation model [3], numerical fitting of the discharge curve for minimum ignition voltage [4], and analysis of the characteristics of discharge ignition [5]. These studies provide only qualitative descriptions and not quantitative calculations. A particle evolution analysis of the discharge process is also provided from a microscopic perspective, but the energy is not discussed [5]. There is a study from the perspective of the protection circuit when the output current is greater than the operating current cutoff output, such as the cutoff-type output short-circuit protection under a capacitive equivalent circuit model [6], which requires extremely high switching speeds of the electronic components and cannot solve the problem essentially.
The energy stored in the capacitor during a spark discharge process consists of three components: the first part is the energy released in the explosive medium through thermal radiation and thermal conduction; the second part is the energy consumed by the electrode; the third part is the residual energy at the end of capacitance discharge [7–10]. The energy of the capacitor discharge process only accounts for 8%–14% of the capacitor release energy [11], but this is mainly applicable to long-gap high-voltage discharges, and the conclusions obtained are not suitable for low-voltage short-gap micro-nano discharges. To determine the proportion of discharge energy consumption, scholars have used different trigger methods to measure the spark discharge energy [12]. By measuring the pressure change inside a closed vessel, it was found that about 45% of the energy released by the arc caused the pressure inside the vessel to increase [13]. By measuring the temperatures at different points along the axis of the electrodes, curves were fitted with respect to parameters, such as the electrode radius, current density, and electrode temperature, and the power lost to the cathode surface was calculated [14]. Calculations through electrode temperatures measured via thermocouples revealed that about 25% of the energy is transferred to the cathode and the remaining 75% of the energy is dissipated to the surroundings and the negative electrode [15]. The voltage, current, and time of spark discharge were measured by an oscillometric method to calculate the discharge power, energy, and efficiency [16]. Owing to errors of the experimental instruments and the fact that the discharge time was only of the order of microseconds, the obtained values were not accurate.
There are many factors that affect the energy consumed by an electrode, such as the electrode morphology and structure. It was found that the ignition energy of a flanged electrode was low and that the cylindrical electrode required the largest ignition energy, followed by the conical electrode [17]. The electrode surface roughness has been shown to affect the spark point, and it was found that a rougher electrode surface required a greater amount of minimum ignition energy [18]. The exchange of thermal radiation between the arc channel and surface of the pole plate was modeled, and the mechanism of energy exchange between the arc and pole plate was discussed from the experimental temperature and pressure data from the discharge channel [19]. The cathode energy loss is determined by the cathode spotting mechanism, while the anode energy loss depends on the area of the plasma jet incident on the anode, with the total loss at both electrodes accounting for 25%–45% of the total supplied energy [20]. Heat conduction has also been considered as the mechanism of heat loss from the electrode surface [21]. These studies only calculated the amounts of energy consumed by the electrodes but not the amounts of residual energy stored at the end of the discharge; further, the energy consumed by the electrodes is not the same when the electrode structures and discharge mechanisms are different. The influences of electrode spacing, capacitance, and circuit resistance on the discharge energy was also investigated [22]. It was found that the electrode pole pitch affected the energy released into the spark channel relative to the initial ambient pressure [23]. An exponential relationship was also found between circuit resistance and discharge energy [24].
In fact, the electrode energy consumption for capacitive short-circuit discharge is related to not only the parameters of the external circuit but also the nature of the test electrode material, electrode surface shape, electrode spacing, and other parameters. The discharge channel resistance should be analyzed, and the discharge point energy relationship must be calculated from the point of view of motions of the microscopic particles.
A Contour GT-X three-dimensional profile scanner and a scanning electron microscope were used herein to analyze the electrode surface microbump morphology. The scanning electron microscopy (SEM) results of the cathode surface morphology were used to establish of a conical, bulbous cylinder microbump model in accordance with the principles of conservation of energy and thermal equilibrium, and second-order non-chi-squared differential equations were established to deduce the relationships between the cathode surface temperature and height of the microbump, cone angle, and radius of the spherical head. Further, the energy consumed by the microbumps on the cathode surface was calculated from the theory of heat conduction, and the energy consumed on the anode surface was deduced similarly using the surface heat source as the loading heat source. The residual energy of the capacitance was calculated from the discharge time and voltages before and after discharge; the effective energy of the action of the gas was calculated from the law of conservation of energy.
2 Mathematical model of spark resistance
2.1 Spark resistance during the breakdown stage
In the breakdown stages of the micro- and nano-gaps, the number of carriers increases rapidly, leading to a gradual increase in the discharge current. Under the influence of external factors, ne electrons will be generated per unit area of the cathode surface in unit time. Then, these ne electrons move a distance of dx, and dne new ions are produced. The value of dne is proportional to the ionization coefficient given by
The macroscopic average velocity of the carriers is v. In a linear dielectric, this velocity v is directly proportional to the electric field strength E; therefore,
where μe is the electron mobility, E is the electric field intensity in the micro- and nano-gaps, and J is the current density given by Eq. (3):
where σ is the electrical conductivity, and
The discharge time in the microgaps is generally in the nanosecond range [25]. The breakdown of the gap has negligible work due to gas expansion by the pressure gradients and thermal radiation. Therefore, the Joule heat generated by the current in the gap is only composed of the kinetic energy of the electrons and ionization energy UI. Thus,
Since
where K is the Boltzmann constant, and T is the temperature.
Differentiating the expression of electrical conductivity in Eq. (3) and combining it with Eq. (5), we obtain
Finally, we derive the expression for the spark resistance Rs during the breakdown stage as in Eq. (7):
where d is the gap length, current I = JS, and S is the cross-sectional area.
2.2 Spark resistance during the gap discharge stage
In the gap discharge stage, the degree of gas ionization exceeds the range of the Spitzer formula, and factors such as thermal radiation caused by the pressure gradients cannot be ignored [26, 27]. Therefore, the main influences are reflected in the channel radius and electron temperature. The relationship between electron temperature and current density is obtained as follows:
where FSB is the ratio of initial to breakdown voltages, and P0 is the initial pressure.
The relationship between the electron temperature and electrical conductivity is shown in Eq. (9):
By combining Eqs. (8, 9), we obtain
From the Braginskii formula for the discharge channel radius and temperature [28]:
where a is a constant equal to 1.
Substituting Eq. (11) into Eq. (10), we get
where M is the proportionality coefficient, current I = JS, and S is the cross-sectional area.
2.3 Spark resistance during the discharge process
The spark resistances during the breakdown and gap discharge stages are integrated into a piecewise function, as shown in Eq. (13):
where t1 is the time required for the gap breakdown, and t2 is the total time required for the gap breakdown and discharge.
3 Capacitor short-circuit spark discharge
3.1 Energy composition of the capacitor short-circuit spark discharge
Once the dielectric is punctured, the discharge channel under the action of a short-circuit current and an electromagnetic field will produce fire and sound, and the spark channel has a large temperature difference with the surrounding hot gas. Owing to the short distance between the electrodes, the short-circuit current generates Joule heat, and the temperature of the electrodes is much lower than that of the spark channel. The temperature of the cathode surface gradually rises under this Joule heating and consumes the discharge energy.
At the time of breakdown, the voltage across the entire capacitor is UC, and the energy stored in the capacitor is EC, which can be expressed as follows:
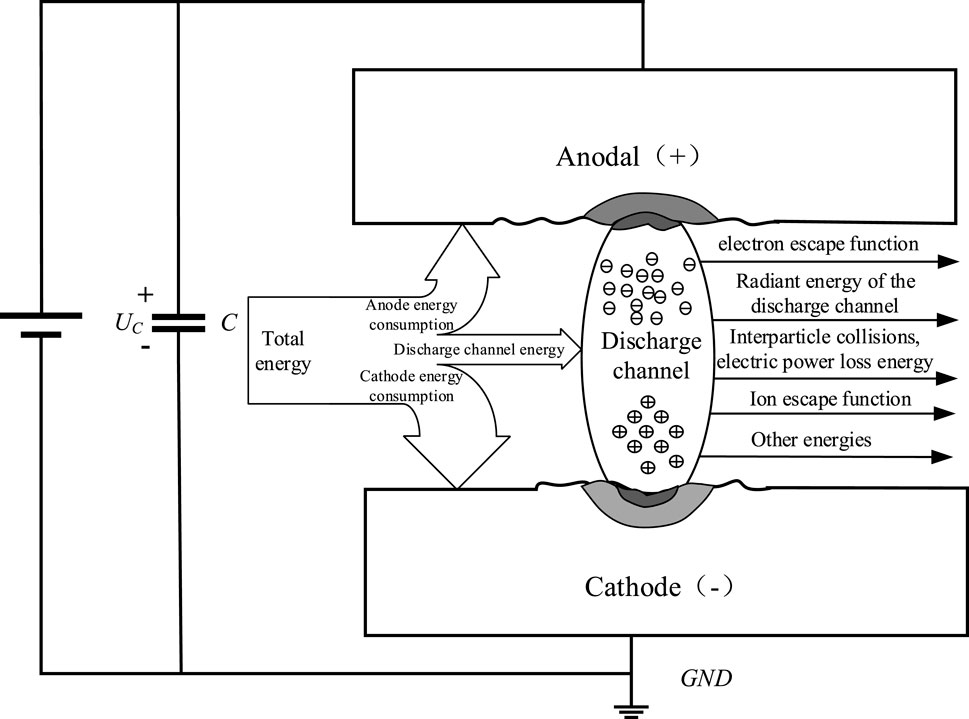
Figure 1. Composition of the discharge energy.
where u(t) and i(t) are the instantaneous voltage and current in the discharge channel, respectively; Td is the discharge duration; Qa is the energy consumed on the anode surface; Qc is the energy consumed on the cathode surface; Qd is the energy consumed by the gas in the discharge channel.
3.2 Capacitor energy storage
Switching the power supply at the output of a short circuit or a fault occurs after cutting off the input of the power supply. The energy released based on that stored in the capacitor is shown in Figure 2. Here, UC is the capacitance short-circuit discharge for the voltage across the ends, iC is the capacitance short-circuit discharge current, R is the resistance in the equivalent line, G is the electrode, Ur is the spark channel voltage, Rs is the spark channel resistance, and iG is the discharge current.
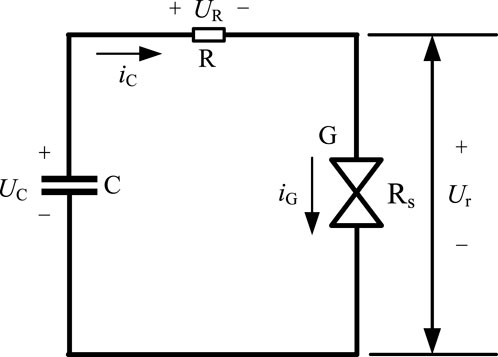
Figure 2. Equivalent circuit of the capacitor short-circuit spark discharge test.
When the capacitor is discharging in a short circuit, as shown in Figure 2, the capacitor forms a closed loop with the line equivalent and spark channel resistances. According to Kirchhoff’s theorem, the relationship in Eq. (15) exists for the capacitor discharge process in Figure 2.
where UR is the voltage across the ends of the loop equivalent to line resistance R. When not discharged, the voltage UC across the capacitor is the power supply output voltage Ui. Since
As the discharge proceeds, the voltage across the capacitor initially shows a sharp decline and then a slow decline to Ud, at which point there is no further decline; Ud is usually about 10 V, and varies slightly for different materials; for a cathode made of cadmium metal, Ud is about 9.8 V. The voltage across the capacitor is set to Ud when the time is t1, and the capacitor discharge can be expressed as in Eq. (17):
where uC (t0) is the voltage across the capacitor at the start of discharge and is the power supply output voltage Ui. Therefore, the capacitor residual energy Er at the end of discharge can be expressed by Eq. (18):
From Eq. (18), for a larger capacitance, it is seen that more energy remains in the capacitor at the end of the discharge.
4 Electrode energy consumption
4.1 Cathode energy consumption
4.1.1 Characterization of cathode surface morphology
The electrodes were not finely polished during processing, so mutual scraping occurred after repeated use and physical phenomena such as melting and vaporization occurred during discharge, all of which led to irregularly shaped microbumps on the surfaces of the electrodes. SEM was used to scan the cathode surface, and these results are shown in Figure 3. It is seen that there are many microconvex points with irregular geometry on the electrode surface, and these points are densely distributed with different distances and heights between the points. To study the effects of these irregular microbumps on the temperature of the cathode surface and energy consumed during discharge, a portion of the surface of the used electrode was sampled. One part of the sample was cleaned with an ultrasonic cleaner to remove minute particulate matter, and the surface was polished using a polishing machine; the other part of the sample was left untreated. Two randomly selected areas on the cleaned portion and untreated cathode surface were scanned using a 3D profile scanner, whose results are shown in Figure 4; Figures 4A, B are the cathode surfaces without any treatment, and Figures 4C, D are cleaned and polished cathode surfaces.
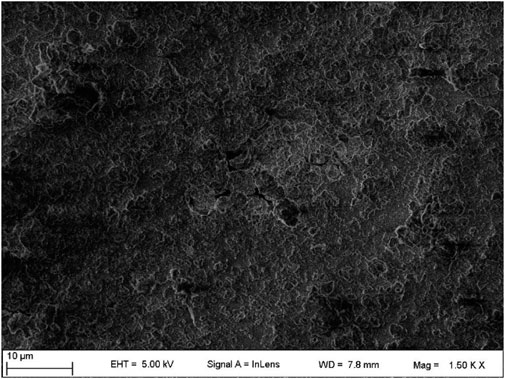
Figure 3. Scanning electron microscopy results of the metal cathode.
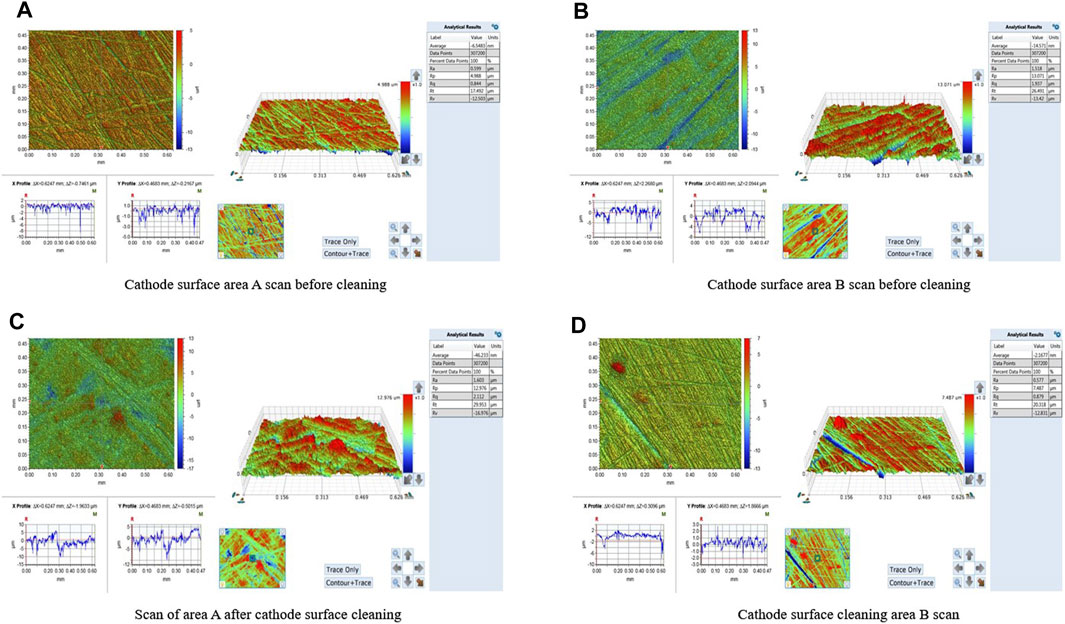
Figure 4. Cathode surface morphology. Two randomly selected areas on the cleaned portion and untreated cathode surface were scanned using a 3D profile scanner; (A,B) are the cathode surfaces without any treatment, and (C,D) are cleaned and polished cathode surfaces.
The roughness Ra of the cathode surface before cleaning is 1.603 μm and 1.518 μm in Figures 4A, B, and the roughness after cleaning is 0.599 μm and 0.577 μm in Figures 4C, D, respectively; these show obvious changes in the roughness before and after cleaning. After cleaning the cathode surface, the roughness Ra is reduced, and the irregular microbumps are equated to conical and spherical cylindrical microbumps; the geometric model of microbumps is established as shown in Figure 5.
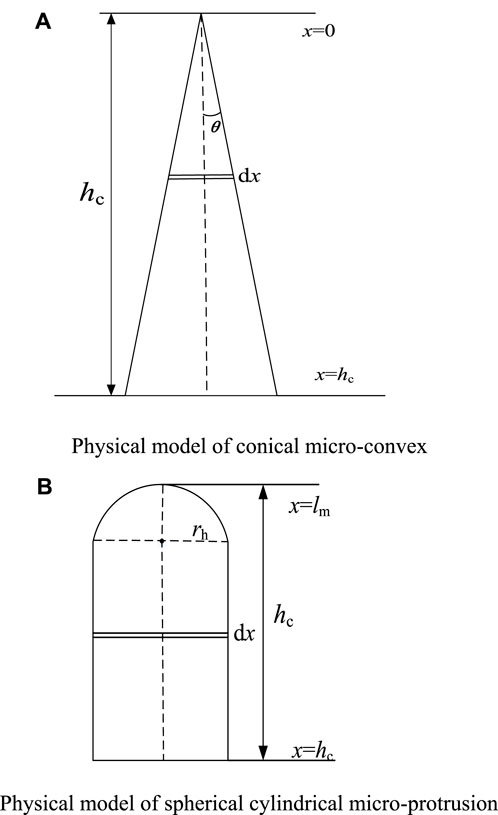
Figure 5. Microconvex geometric model. The physical model of the conical microconvex (A) and the physical model of the spherical cylindrical microconvex body (B) are established.
In Figure 5, the height of the conical and spherical cylinder bumps is hc, where the top is at x = 0 and cathode surface is at x = hc; the radius of the hemisphere at the top of the bump at x = lm is rh, θ is the cone half-angle of the conical microbumps, and the temperatures at the top of the bump at x = lm and cathode surface at x = hc are Tm and T0, respectively.
4.1.2 Heat balance equation
When an output short circuit occurs in a capacitor, field emission occurs between the electrodes, at which time the conductivity between the electrodes becomes large and current density between the electrodes varies in accordance with the laws of the Fowler–Nordheim equation [29]. The microbumps on the cathode surface generate Joule heat under the action of the current, a part of which is conducted along the microbumps from the top to the bottom while the rest is dispersed through the surfaces of the microbumps as thermal radiation. Owing to the small surface area of the microbumps, the amount of heat dissipated by thermal radiation is negligible compared to the amount of heat transferred by thermal conduction.
Under the action of Joule heating, the temperature of each microbump on the cathode surface is different, and the internal energy per unit mass and heat flow from top to bottom of the microbump at different moments are also different. The heat balance equation of the microbump is then established according to the energy conservation theorem [30]:
where Qg is the increase in internal energy per unit volume of the microbump:
Here, Qi is the amount of heat produced per unit time, and Qo is the outflow energy:
The Joule heat generated by the current between the poles is given using the microbump temperature change as
where c is the specific heat capacity of the cathode material, m is the mass of the object, ∆Tc denotes the amount of temperature change, and k is the thermal conductivity.
The cathode heat balance equation was analyzed using the microelement method by setting the thickness of the metal microelement to dx, area to S, resistivity to γ, density to ρ, current through the microelement to I, and temperature change to ∆Tc after a time ∆t. The resulting Joule heat is
Based on the heat conduction theory and energy conservation theorem, the heat balance equation related to the cathode surface microbump height, cone half-angle, top radius, temperature, electric field strength, current density, and other parameters is given by Eq. (25).
In polar coordinates, the general heat transfer equation is
For axisymmetric-shaped microbumps, Eq. (25) can be simplified as
4.1.3 Thermal effects of microprotrusions with different morphologies
4.1.3.1 Thermal effects of a tapered microconvex morphology
The heat energy produced by the current Ic per unit volume per unit time in the disk is calculated at a distance of x = dx from the top of the microbump; the center of the microbump at x = 0 is the origin of the coordinates:
where γc is the resistivity of the cathode metal, and Ic is the current flowing through the tip of the microbump.
The heat conduction equation in polar coordinates for this case is established as
where kc is the thermal conductivity of the cathode metal.
From the energy conservation theorem, it is known that the Joule heat generated by the emitted current is equal to the energy consumed by the cathode surface, so Eq. (28) can be simplified as
We now transform Eq. (29) using the permutation method by first setting
The simplification gives
Integrating and simplifying Eq. (31) yields
where C1 and C2 are the integration constants.
The above equation satisfies the following boundary conditions: when x = hc, Tc = T0; when x = lm, Tc=Tm, and
This can be derived by bringing the boundary conditions into Eq. (32):
4.1.3.2 Thermal effects of the spherical crown microprotrusions
The above section mainly analyzes the temperature effects of the conical microbumps, and the process for the cylindrical bulges with spherical heads is roughly similar to that for the conical bulges. When the height of the cylindrical microbump is hc and radius of the hemispherical head is rh, the heat transfer equation is as shown in Eq. (35):
where α0 is the coefficient of increase in resistivity with temperature.
The relationship between the temperature at the cylindrical microbump and radius of the spherical head is obtained by analogy with the analysis and calculations of the conical microbump, as shown in Eq. (36).
The above formula satisfies the following boundary conditions: when x = hc, Tc = T0; when x = 0, Tc=Tm, and
While ignoring the influence of temperature on conductivity and specific heat capacity, the relationship curves between temperature and distance from the top of the microbulge, cone angle, and radius of the microbulge are obtained from Eq. (34), as shown in Figure 6.
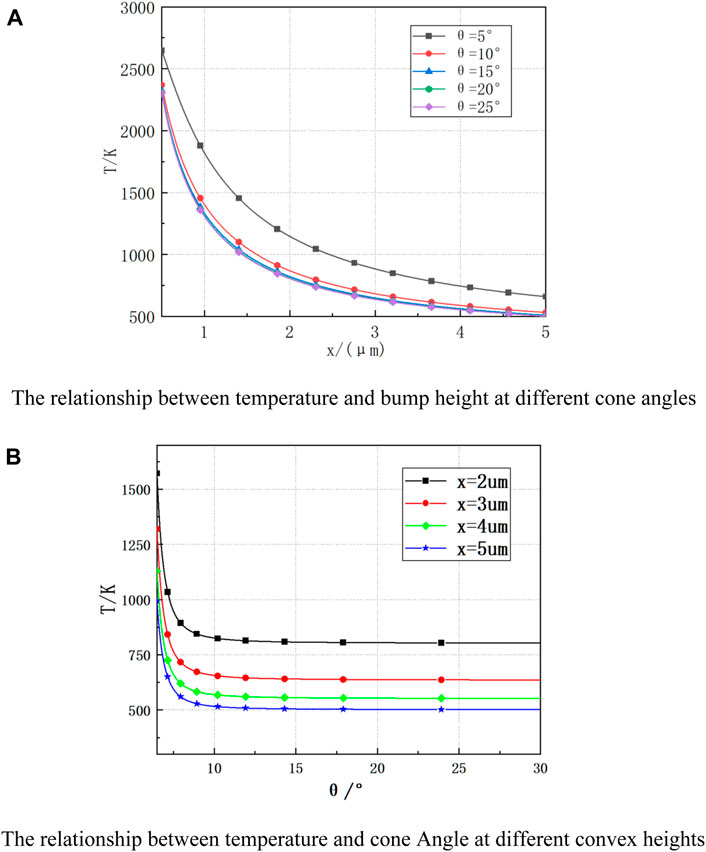
Figure 6. Temperature variations of the conical microprotrusions. The temperature change plot of the conical microprotrusions shows the relationship between temperature and concave-convex height for different cone angles (A) and the relationship between temperature and cone Angle for different convex heights (B).
As seen from Figure 6A, when the cone angle is 5°, the distance from the top of the microbump increases from 1 μm to 3 μm, and the temperature of the microbump decreases by 1200 K; when the distance from the top of the microbump increases from 3 μm to 5 μm, the temperature of the microbump only decreases by 400 K. Hence, it can be concluded that the temperature change is more drastic in the range of 0–3 μm from the top of the microbulge and that this trend of temperature change is more gentle when the distance from the top of the microbulge is more than 3 μm. The relationship between the cone temperature of the cathode and cone angle is shown in Figure 6B. It can be seen from Figure 6B that when the cone angle is less than 12°, the temperature of the cathode surface changes more sharply, and when the cone angle exceeds 12°, the change is relatively gentle. It can thus be concluded that for cones with different half angles, the larger the angle, the smaller is the cathode surface temperature, and the smaller the angle, the larger is the cathode surface temperature. Therefore, from the perspective of heat conduction, cones with small angles have smaller heat conduction areas and large heat transfer distances, resulting in high tip temperatures.
The cylindrical model of the spherical head was established similar to that of the conical microprotrusion. The temperature variation based on the radius of the spherical head and height of the spherical microprotrusion is shown in Figure 7.
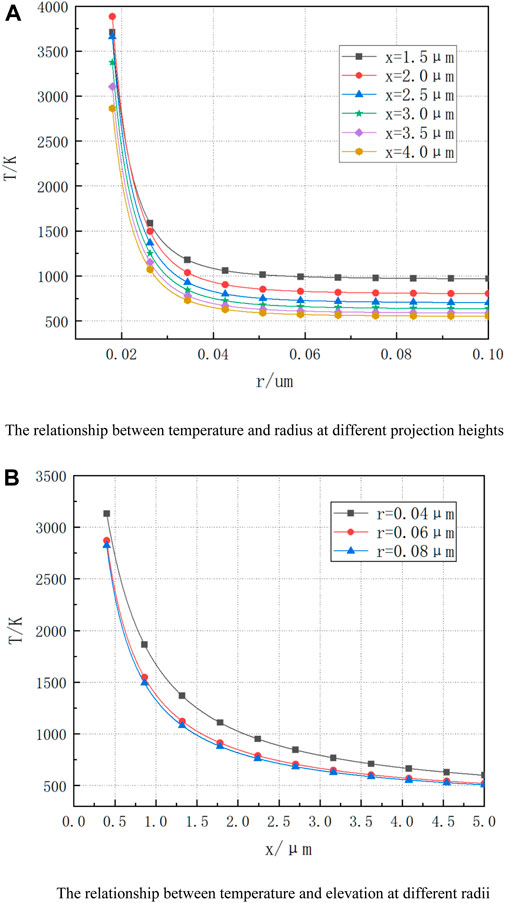
Figure 7. Temperature variations of the spherical cylinder microprotrusions. The temperature change plot of the spherical cylindrical microconvex shows the relationship between temperature and radius for different projection heights (A) and the relationship between temperature and altitude for different radii (B).
As seen from Figure 7A, when x = 3 μm, the radius of the spherical head increases from 0.02 to 0.04 μm, and the temperature changes from 3200 to 750 K; when the radius of the head increases from 0.04 to 0.1 μm, the temperature only decreases by 200 K. It can thus be concluded that the temperature of the cathode microbulge decreases with increase in the radius of the spherical head and that this change is more obvious when r < 0.04 μm. The influence of the distance between the cylinder and top of the spherical head on the cathode surface temperature is shown in Figure 7B. From Figure 7B, when the radius of the spherical head r = 0.06 μm, the distance from the microconvex tip of the cathode surface temperature decreases by 2000K from 0 to 3 μm and only decreases by 200K from 3 to 5 μm. When x is less than 3 μm, the change rate of the temperature T of the cathode microbulge with x is relatively large; when x is greater than 3 μm, the change rate of temperature T is relatively gentle, which is consistent with the observations in Figure 7A. It can thus be concluded that the smaller the radius of the spherical head, the higher is the temperature of the microbulge; on the contrary, the larger the radius of the spherical head, the lower is the surface temperature of the microbulge. Therefore, from the perspective of thermal conductivity, it can be seen that the smaller the radius of the spherical head, the smaller is the thermal conductivity area of the spherical head cylinder, resulting in a higher tip temperature.
To simplify the calculations, the equivalent model with the conical and spherical cylindrical microprotrusions in the figure is equivalent to the semi-ellipsoidal microprotrusions shown in Figure 8. To make the equivalent model closer to the actual situation, f = L/rd is defined as the aspect ratio of the microprotrusions, L is the average height of the microprotrusions, and rd is the bottom radius.
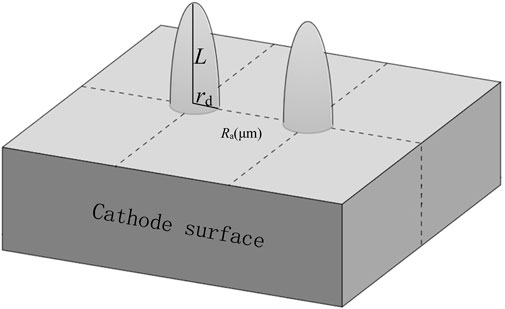
Figure 8. Schematic of the equivalent model of semi-ellipsoid microconvex bumps on the cathode surface.
As shown in the figure, the volume expression for the semi-ellipsoid microbulge is as follows:
According to the SEM image of the cathode surface, the microconvex roughness Ra can be obtained, which reflects the average height of the microconvex bumps on the cathode surface. By replacing the above formula, the semi-ellipsoid can be obtained with the following expression:
The expression for quality of the cathode surface microconvex bumps is
where ρcd is the density of the cathode cadmium material, which is 8.65 g/cm3.
Factors such as the use times of different cathode materials will lead to differences in the densities of the microbumps on the cathode surface, which is defined as ρ1 per unit area. According to the heat conduction theory for the discharge process, the energy consumed on the cathode surface is as follows:
where c is the specific heat capacity of the cathode cadmium metal (at 25°C, this is 26.020 J/(kg·K)), k0 is the unit coefficient whose function is to unify different units into the relevant values of the energy unit in mJ (after calculation, k0 = 10–12), and ρ1 is the microbump density of the cathode material. To calculate the surface energy of the cathode with an area of S (cm2), the expression is
According to the scanning diagram of the cathode surface shown in Figure 4, the surface roughness can be clearly obtained from the measured parameters. These parameters are substituted into Eq. (41), and the cathode surface energies of the 1 cm × 1 cm cadmium disk under different aspect ratios f and different microconvex profile roughnesses Ra are measured, as shown in Table 1.
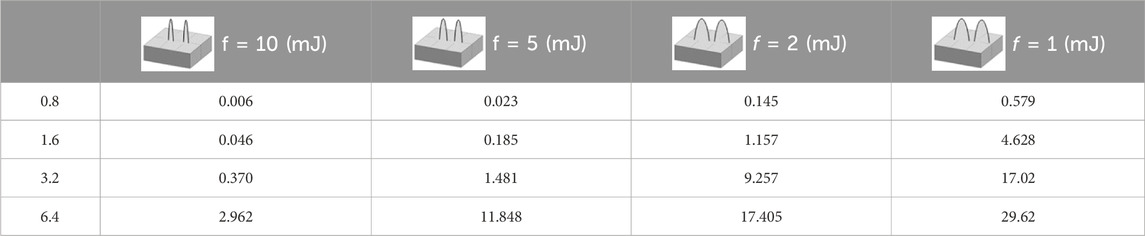
Table 1. Cathode surface energy consumption under different f and Ra conditions.
In a previous work [32], the electric potential and electric field of an emitter tip with a similar microconvex structure were calculated, and the expression for the tip field enhancement factor was obtained as β0 = L/rd+3.5. If the influence of plate spacing on the field enhancement factor is considered, the expression for the tip field enhancement factor can be adjusted to β0 = L/rd +3.5 + A (L/d), where A is a constant equal to 1.202, and d is the plate spacing. When the distance between the plates is much larger than the height of the microbump on the cathode surface, the energy consumed by the cathode surface can be adjusted as follows:
According to Eq. (42), the relationships between the energy consumed on the cathode surface Q, field enhancement factor β0, and cathode surface roughness Ra can be drawn, as shown in Figure 9. It is seen from Figure 9 that the energy consumed by the cathode increases with increase in its surface roughness. When Ra < 3 μm, the energy consumed by the cathode increases slowly, and when Ra > 3 μm, the energy consumed by the cathode increases sharply.
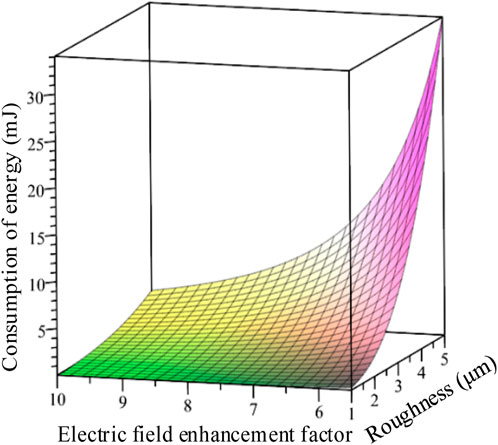
Figure 9. Relationship curves of Qc with Ra and β0 when the heights of the microprotrusions are much lower than the spacing.
The energy consumed on the cathode surface decreases with increase in the field enhancement factor β0. When Ra < 2 μm, the energy consumed on the cathode surface is less affected by the field enhancement factor, and when Ra < 4 μm, the energy consumed on the cathode surface is more affected by the field enhancement factor.
When the height of the microconvex bumps on the cathode surface is equivalent to the distance between the plates, the expression for energy consumed on the cathode surface given by Eq. (42) with area S can be adjusted to
According to Eq. (43), the relationships between the energy consumed on the cathode surface Q, field enhancement factor β0, and cathode surface roughness Ra when the height of the microbumps is equal to the distance between the plates can be drawn, as shown in Figure 10. As seen from Figure 10, the variations in the energy consumed on the cathode surface with the field enhancement factor β0 and cathode surface roughness Ra are similar to those when the heights of the microbumps are much smaller than the distance between the plates, but the energy consumed on the cathode surface will increase as the heights of the microbumps approach the distance between the plates. The energy consumed by the cathode surface decreases when the ratio of the height of the microprotrusion to distance between the plates is small.
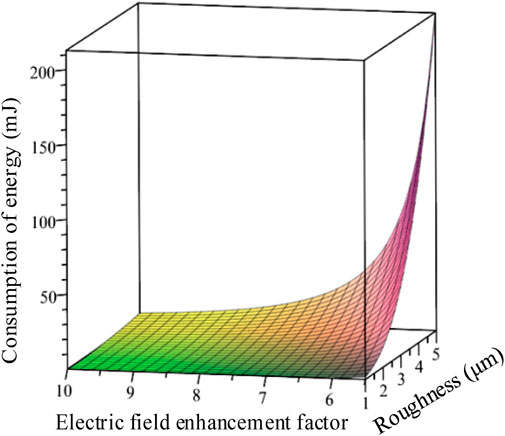
Figure 10. Relationship curves of Qc with Ra and β0 when the heights and spacing of the microprotrusions are equal.
4.2 Anode energy consumption
To study the thermal processes of Electric Discharge Machining, it is necessary to analyze the heat sources in the discharge process. To solve the problem of the heat sources, scholars had earlier proposed the concept of heat flux and deduced its empirical formula for the discharge process of the EDM theoretically. Heat flux refers to the heat transmitted per unit time through a unit cross-sectional area, which is a surface load. The physical quantity of heat flux can adequately describe the direction and location of heat flow. At present, the heat flow source density model is generally accepted by scholars and theoretically analyzes and simulates mainly three types of sources: point heat source, surface heat source, and Gaussian heat source. These models are shown in Figure 11.
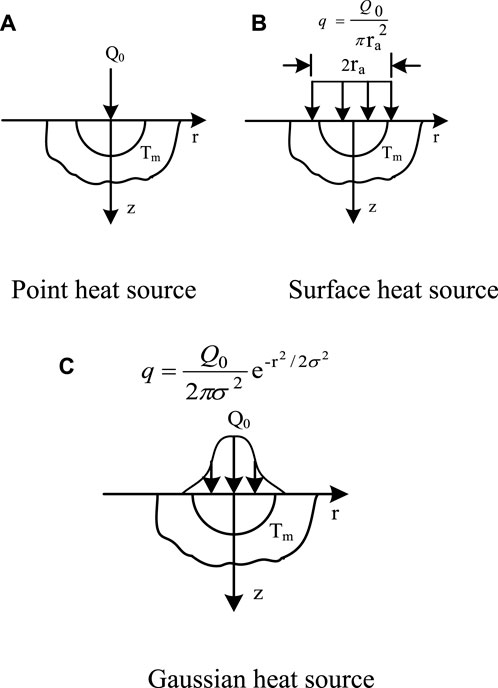
Figure 11. Heat flow source density model. The heat flow source density model contains point heat source (A), surface heat source (B) and gaussian heat source (C).
Herein, the anode surface heat source is considered as an example to illustrate heat source loading. The radius of the surface heat source is ra. In this model, the isotherms are symmetric about the Z-axis but not necessarily hemispherical, so the column coordinate analysis is better. When Q0 units of heat accumulates on the anode surface initially, the anode temperature is expressed as
where J0 (λr) and J1 (λa) are the roots of order 0 and 1 of the Bessel equation, respectively, and α is the thermal diffusivity given by α = λ/ρc.
When the surface heat source radius ra is
Equation (44) can be further expressed as
Now, Eq. (48) can be deformed to obtain the anode temperature rise ΔT during discharge time t as
According to the theoretical equation of heat conduction and substituting Eq. (49) into it, the expression for energy consumed by the anode surface can be derived as follows:
where Rw is the anode tungsten wire radius, z is the thermal diffusion depth during discharge, t is the discharge time, and λw, cw, and ρw are the respective thermal conductivity, specific heat capacity, and density of tungsten wire metal. By bringing the relevant parameters into Eq. (50), the relationship between anode energy consumption, discharge time t, and thermal diffusion depth z can be obtained as shown in Figure 12.
Figure 12. Relationship between anode energy consumption and t and z.
From Figure 12, it can be intuitively seen that the increase in discharge time will lead to increase in thermal diffusion time, which will increase the energy consumed by the anode. When the discharge time reaches the level of microseconds, the energy consumed by the anode surface will increase rapidly with increase in discharge time. The larger the thermal diffusion depth, the larger is the thermal diffusion surface, which will increase the energy consumption of the anode surface, subsequently increasing the growth rate from small to large with the increasing diffusion depth.
5 Effective ignition energy
According to Eq. (51), the effective ignition energy Qi is equal to the total energy of the initial discharge minus the energy consumed on the anode and cathode surfaces during the discharge process along with the residual energy of the capacitor at the end of discharge. To calculate the energy consumed on the anode surface during the discharge process and energy remaining in the capacitor after discharge, the discharge time and voltages at the ends of the capacitor at the end of discharge are required to be calculated as parameters. The residual energy Er of the capacitor after discharge and energy Qa consumed by the anode during discharge can be obtained by bringing the obtained data into Eqs. (18, 50).
From the voltage and capacitance applied by the discharge circuit, the initial total energy in the discharge channel can be calculated. After calculating the cathode surface energy Qc using Eq. (51), the energy consumed by each part in the discharge process is listed in Table 2.
Table 2. Proportions of effective ignition energies at different voltages.
According to the data in Table 2, it can be concluded that the energy consumed by the cathode increases with increasing voltage in the discharge process of the same capacitor for different voltages, but the proportion of the total energy will decrease. The effective ignition energy increases with increase in voltage, and this increase is from 32.5% to 73.2% as the voltage increases from 20 V to 300 V.
To verify the energy consumed by each part under the same voltage for different capacitors and proportions of effective ignition energy, the same method is used to calculate the energy of each part in the discharge process, and these results are listed in Table 3. According to the data in Table 3, because the discharge time increases with the increase in capacitance, the anode energy consumption increases with increase in the capacitance, but the ratio of the total energy is slightly reduced, and the proportion of effective ignition energy increases with increase in capacitance from 43.7% at 1 μF to 63.9% at 10 μF. Thus, the effective ignition energy for an explosive gas can be obtained, but this method does not consider other energy losses, such as line losses and switching losses during discharge, and the calculated result is still higher than the actual ignition energy.
Table 3. Effective ignition energies for different capacitances.
6 Conclusion
In this work, the spark discharge characteristic curve is analyzed in depth, and based on the cathode surface morphology and energy conservation principle, the electrode energy consumed for a certain discharge time and residual capacitor energy at the end of discharge are calculated quantitatively; the effective ignition energy for sparking an explosive gas is thus obtained. The following conclusions are drawn:
(1) The change in spark energy is related to the change in capacitance or voltage, and increase in capacitance or voltage can increase the peak current and discharge time, thus increase the energy.
(2) For a given capacitor storage energy, the larger the capacitance, the more is the residual energy remaining in the capacitor at the end of discharge.
(3) The greater the voltage across the ends of the capacitor, the less is the energy consumed by the electrode and less is the energy remaining in the capacitor at the end of discharge, thereby supplying more effective ignition energy.
(4) The release efficiency of spark energy is also related to the spark resistance, and this efficiency decreases with decrease in the spark resistance.
Data availability statement
The original contributions presented in the study are included in the article/Supplementary Material, and any further inquiries may be directed to the corresponding author.
Author contributions
WD: Writing–review and editing, Writing–original draft. YL: Writing–review and editing, Writing–original draft. SL: Writing–review and editing, Writing–original draft. XW: Writing–review and editing, Writing–original draft. SL: Writing–review and editing, Writing–original draft. WF: Writing–review and editing, Writing–original draft.
Funding
The author(s) declare that financial support was received for the research, authorship, and/or publication of this article. This research was financially supported by the National Natural Science Foundation of China (no. 51777167) and National Natural Fund Youth Project (no. 51604217).
Conflict of interest
The authors declare that the research was conducted in the absence of any commercial or financial relationships that could be construed as a potential conflict of interest.
Publisher’s note
All claims expressed in this article are solely those of the authors and do not necessarily represent those of their affiliated organizations or those of the publisher, editors, and reviewers. Any product that may be evaluated in this article or claim that may be made by its manufacturer is not guaranteed or endorsed by the publisher.
References
1. GB. T 3836.4-2021, Explosive environment Part 4: equipment protected by intrinsically safe 'i. Beijing: China Standard Press (2021).
2. Liu S, Liu J, Zhong J. Analysis and design of output intrinsically safe Buck-Boost DC-DC converters. Proc CSEE (2008)(03) 60–5. doi:10.13334/j.0258-8013.pcsee.2008.03.009
3. Wang M. Analysis of minimum ignition voltage curve of intrinsically safe class I capacitor circuit. J NORTH CHINA UNIV TECH (2018) 30:36–9 + 50. CNKI:SUN:BFGY.0.2018-02-006.
4. Wang Z, Wu D. Study on ignition characteristics of capacitive discharge in complex intrinsically safe circuits. Saf Coal Mines (2019) 50:112–5. doi:10.13347/j.cnki.mkaq.2019.04.027
5. Wang D, Luan Z, Gu D, Liu SWX. Numerical simulation research on microscopic characteristics of capacitor Short-Circuit discharge based on charge equivalent method. Trans China electrotechnical Soc (2021) 36:2684–96. doi:10.1959595/j.cnki.1000-6753.tces.L90377
6. Yuesen Y, Liu J, Junrui X, Zeng Y. Modeling and analysis on spark discharge of EC circuit with cut-off type protection. J China coal Soc (2016) 41:2380–7. doi:10.13225/j.cnki.jccs.2016.0234
7. Liu Q, Huang J, Shao H, Zhang Y. Electric ignition energy evaluation and the energy distribution structure of energy released in electrostatic discharge process. Chin Phys B (2017) 26(10):105202. doi:10.1088/1674-1056/26/10/105202
8. Ptak S, Smalcerz A, Ostrowski P. Estimation of the energy released during propagating brush discharge. J Electrostatics (2020) 103:103416. doi:10.1016/j.elstat.2019.103416
9. Liu J, Bi M, Jiang H, Gao W. Evaluation of spark discharge. J Electrostatics (2020) 107:103500. doi:10.1016/j.elstat.2020.103500
10. Sheng H, Wang Z, Yang S, Ye S. Measurement of the effect of parasitic capacitance in minimum ignition energy spark generation circuits. J Electrostatics (2022) 119:103752. doi:10.1016/j.elstat.2022.103752
11. Qingming LIU, Wang J, Lei LI, Zhang Y, Can Y. Calculation of electric spark discharge energy and its energy loss. High Voltage Eng (2014) 40(4):1255–60. doi:10.13336/j.1003-6520.hve.2014.04.044
12. Xie D, Wang Z, Yang S, Ye S. Measurement method of spark energy based on peak detection. J China Univ Metrology (2020) 31(01):37–43. doi:10.3969/j.issn.2096-2835.2020.01.007
13. Peng L, Ruan J, Huang D, Ouyang Z, Dong W. Experimental analysis of arcing characteristic and pressure rise due to internal short-circuit in a closed container. High Voltage Eng (2019) 45(03):940–9. doi:10.13336/j.1003-6520.hve.20190226035
14. Salihou H, Abbaoui M, Lefort A, Audy R. Determination of the power lost by conduction into the cathode at low current arc. J Phys D: Appl Phys (1995) 28(9):1883–7. doi:10.1088/0022-3727/28/9/016
15. Rondeel WGJ Cathodic erosion in the vacuum arc. J Phys D. Appl Phys (1973) 6(14):1705–11. doi:10.1088/0022-3727/6/14/307
16. Huang Z, Xiong T, Wang S. Spark energy measuring technology and performance analysis of discharge process for electric spark ignition. Chin J Eng Thermophys (1982) 3(04):394–9. CNKI:SUN:GCRB.0.1982-04-015.
17. Bane SPM, Ziegler JL, Shepherd JE. Investigation of the effect of electrode geometry on spark ignition. Combustion and Flame (2015) 162(2):462–9. doi:10.1016/j.combustflame.2014.07.017
18. Morovatiyan M, Shahsavan M, Shen M, Hunter Mack J Investigation of the effect of electrode surface roughness on spark ignition//internal combustion engine division fall technical conference. Am Soc Mech Eng (2018):51982. doi:10.1115/ICEF2018-9691
19. Sousa Martins R, Rivière P, Zaepffel C, Passilly F, Soufiani A. Analysis of energy exchanges during the interaction between pulsed lightning arcs and metallic plates. J Appl Phys (2020) 128(22):223301. doi:10.1063/5.0025616
20. Beilis I, Beilis I. Electrode energy losses. Effective voltage. Plasma Spot Phenomena Electr Arcs (2020) 285–305. doi:10.1007/978-3-030-44747-2_10
21. Ko Y, Anderson RW. Electrode heat transfer during spark ignition. SAE Trans (1989) 2006–14. doi:10.2307/44581084
22. Korytchenko K, Poklonskiy E, Samoilenko D, Vinnikov D, Meleshchenko R, Ostapov K. Thermal radiation in spark discharge. Probl At Sci Technol (2021) 134(4):171–6. doi:10.46813/2021-134-171
23. Korytchenko KV, Varshamova IS, Meshkov DV, Dubinin D, Kovalenko R, Nazarenko S. Experimental and numerical studies of pressure and gap length effects on energy deposition in spark discharge. Probl At Sci Technol Ser “Plasma Phys (2021) 2021(1):92–7. doi:10.46813/2021-131-092
24. Oreshkin VI, Lavrinovich IV. Energy loss in spark gap switches. Phys Plasmas (2014) 21(4):043513. doi:10.1063/1.4873706
25. Liu Q, Shao H, Zhang Y. Study on shock waves induced by electric spark discharge. China Sci Paper (2016) 11(23):2649–53. doi:10.3969/j.issn.2095-2783.2016.23.004
26. Zhong S, Li X, Lu L, Ren C, Wang Z. Experimental investigation on measurement of spark discharge energy using integration method. Proced Eng (2011) 15:2690–4. doi:10.1016/j.proeng.2011.08.506
27. Freeman RA, Craggs JD. Shock waves from spark discharges. J Phys D: Appl Phys (1969) 2(3):421–7. doi:10.1088/0022-3727/2/3/315
28. Eckhoff RK Minimum ignition energy (MIE) — a basic ignition sensitivity parameter in design of intrinsically safe electrical apparatus for explosive dust clouds. J Loss Prev Process Industries (2002) 15(4):305–10. doi:10.1016/s0950-4230(02)00003-7
30. Peng YF, Qin Z, Zhang H, et al. Intrinsic emittance of thermal cathode with radial temperature variation. High Power Laser Part Beams (2018) 30(03):133–7. doi:10.11884/HPLPB201830.170363
31. Kohut A, Wagner M, Seipenbusch M, Geretovszky Z, Galbács G. Surface features and energy considerations related to the erosion processes of Cu and Ni electrodes in a spark discharge nanoparticle generator. J Aerosol Sci (2018) 119:51–61. doi:10.1016/j.jaerosci.2018.02.005
Keywords: cathode energy consumption, cathode surface, spark discharge, effective ignition energy, micro-nano gap
Citation: Dangshu W, Likang Y, Liu S, Wang X, Luwen S and Fengjuan W (2024) Effective ignition energy for capacitor short-circuit discharge in explosive environments. Front. Phys. 12:1356303. doi: 10.3389/fphy.2024.1356303
Received: 15 December 2023; Accepted: 14 June 2024;
Published: 22 July 2024.
Edited by:
Guodong Meng, Xi’an Jiaotong University, ChinaReviewed by:
Zhengdong Wang, Xi’an University of Architecture and Technology, ChinaMan Ding, Hohai University, China
Copyright © 2024 Dangshu, Likang, Liu, Wang, Luwen and Fengjuan. This is an open-access article distributed under the terms of the Creative Commons Attribution License (CC BY). The use, distribution or reproduction in other forums is permitted, provided the original author(s) and the copyright owner(s) are credited and that the original publication in this journal is cited, in accordance with accepted academic practice. No use, distribution or reproduction is permitted which does not comply with these terms.
*Correspondence: Wang Dangshu, d2FuZ2RhbmdzaHVAc29odS5jb20=