
94% of researchers rate our articles as excellent or good
Learn more about the work of our research integrity team to safeguard the quality of each article we publish.
Find out more
ORIGINAL RESEARCH article
Front. Phys. , 12 February 2024
Sec. Mathematical Physics
Volume 12 - 2024 | https://doi.org/10.3389/fphy.2024.1348407
 Ali Raza*
 Muhammad Mobeen Munir
The study centered on Quantitative Structure Property Relationship (QSPR) analysis with a focus on various graph energies, investigating drugs like Mefloquinone, Sertraline, Niclosamide, Tizoxanide, PHA-690509, Ribavirin, Emricasan, and Sofosbuvir. Employing computational modeling techniques, the research aimed to uncover the correlations between the chemical structures of these medications and their unique properties. The results illuminated the quantitative relationships between structural characteristics and pharmacological traits, advancing our predictive capabilities. This research significantly contributes to medication discovery and design by providing essential insights into the structure-property connections of these medicinal compounds. Notably, certain spectrum-based descriptors, such as positive inertia energy, adjacency energy, arithmetic-geometric energy, first zegrab energy, and the harmonic index, exhibited strong correlation coefficients above 0.999. In contrast, well-known descriptors like the Extended adjacency, Laplacian and signless Laplacian spectral radii, and the first and second Zagreb Estrada indices showed weaker performance. The article emphasizes the application of graph energies and a linear regression model to predict pharmacological features effectively, enhancing the drug discovery process and aiding in targeted drug design by elucidating the relationship between molecular structure and pharmacological characteristics.
QSAR/QSPR techniques offer an efficient means to establish links between the physical and chemical attributes of chemical compounds and their bioactivities [1]. Structure-based topological parameters play a vital role in constructing robust predictive models [2]. Eigenvalues-based topological features have demonstrated a strong association with quantum properties of organic structures. The groundwork for structure-based topological parameters commenced in 1947 with Harold Wiener’s introduction of the path number [3], which quantified the sum of distances between all pairs of vertices in a graph.
Fundamentally, the process of converting a molecular graph into a numerical representation relies on unchanging measures known as topological or structural indices. A chemical graph depicts a hydrogen-depleted molecular structure, with bonds represented by edges and atoms represented by vertices in organic compounds. This field is commonly known as chemical graph theory. These structure descriptors, which remain consistent in terms of structure and topology, enable the establishment of connections with various physical and chemical properties, such as boiling point, enthalpy of vaporization, heat of formation, critical pressure, critical volume, and critical temperature. They also facilitate the development of robust regression models [4]. Particularly noteworthy are the topological descriptors based on spectra, which are highly regarded for their effectiveness in correlating the quantum properties of organic substances. In our current research, our goal is to introduce advanced spectrum-based topological descriptors rooted in graph theory to connect with the quantum properties of numerous substances. Simultaneously, we aim to identify descriptors that warrant the attention of researchers, effectively refining the scope of this field. Our recent work describes the applications of some spectrum descriptors in the field of computer sciences [5, 6].
In the field of chemical graph analysis, a wide array of topological descriptors have been well-established, covering diverse categories such as distance-based descriptors [7], valency/degree-based descriptors [8], eigenvalues-based descriptors [2], and counting-related topological polynomials and descriptors [9]. Notably, spectrum-based topological descriptors stand out due to their exceptional ability to generate highly efficient regression models for an extensive range of physicochemical and quantum properties, including the π-electronic energy. These descriptors are constructed based on eigenvalues derived from specific chemical matrices. The focus of this study centers on a specific subset of spectrum-based topological descriptors, where the chemical matrices in question are dictated by the valencies of vertices within a graph. These descriptors have earned recognition for their outstanding effectiveness in establishing correlations with the total π-electronic energy of polycyclic aromatic hydrocarbons.
The computational complexity associated with the determination of numerous topological descriptors, including the detor index [10], is nontrivial, often falling under the categories of NP-complete or NP-hard problems. Consequently, the computation of these indices for specific sets of chemical or general graphs remains a challenging task of significant relevance. A notable contribution to addressing this challenge was made by Hayat [11], who undertook the task of computing various distance-based topological descriptors for specific infinite families of fullerenes and carbon nanotubes. Additionally, Hayat and her colleagues [12, 13] conducted comprehensive calculations for valency-based descriptors, including the Randic index and the atom-bond connectivity (ABC) index, within specific chemical networks. Moreover, extensive exploration of spectrum-based topological descriptors has been carried out by numerous researchers. For instance, Bozkurt [14] and other researchers explored the Randic matrix and its associated energy in the context of specific graph families. Chen [15] introduced and conducted an in-depth analysis of the ABC matrix and its spectral descriptors, encompassing parameters like the ABC energy and ABC Estrada index. Guo and Gao [16] made significant contributions to the field by introducing and studying the arithmetic-geometric (AG) energy and spectral radius of graphs. In a parallel vein, Jahanbani [17] tackled the computation of the harmonic energy and harmonic Estrada index for specific graph families. For an extensive overview of spectrum-based topological descriptors and their applications in chemistry, Consonni’s survey [2] serves as a valuable resource.
In the realm of mathematical modeling, computational techniques wield a substantial influence, encompassing various aspects of graph theory and mathematics as a whole. Pioneering the field, Ashrafi [18, 19] and her collaborative team introduced a computer-driven approach for calculating indices like the Szeged index, PI index, and revised Szeged index within chemical graphs. Building upon Ashrafi’s foundational work, Hayat [11] expanded and adapted this approach to encompass a broader range of distance-based indices, extending its application beyond chemical graphs to encompass general graphs. This avenue of research further evolved as Hayat and her colleagues [20] delved into degree-distance-based topological descriptors, including the Gutman index and the Schultz index. Diverging in approach, Darafsheh [21] introduced an algebraic method that leverages the automorphism group of graphs to calculate the Wiener index, Szeged index, and PI index. In a separate research strand, Arockiaraj [22] introduced a computational technique grounded in vertex cuts to compute specific distance-based indices for inorganic structures. Additionally, Ilić and Ilić [23] made significant contributions by providing algorithms for computing specific distance-based topological descriptors. Notably, Ashrafi [24] proposed a computer-based methodology for calculating the energy and Estrada index of chemical graphs, a method that was subsequently extended to encompass general graphs by Hayat and her research team [13]. In the present research work, we introduce a computational approach that builds upon Ashrafi’s method [24] and extends it to encompass other spectrum-based descriptors, including the ABC energy and ABC Estrada index. This approach offers the advantage of relatively reduced computational complexity.
The total π-electronic energy, accessible through Huückel molecular orbital (HMO) calculations, provides crucial insights into conjugated molecules [25]. Additionally, the correlation between adjacency energy and π-electronic energy in molecular structures has been highlighted by Gutman [25], while Lucic and others [26] have demonstrated strong correlations between product and sum-connectivity indices and the physiochemical properties of benzenoid hydrocarbons. In a recent publication, Hayat et al. [27, 28] presented novel computational techniques for the computation of spectrum descriptors. Their methodologies incorporated software tools such as HyperChem, Topocluj, and Matlab. In our study, we adopted a distinct approach, exclusively utilizing Matlab algorithms for the computation of these descriptors. Moreover, in our regression analysis, we departed from the conventional use of isomers and instead employed real-life medicines. This deliberate choice aimed to enhance the relevance and applicability of our findings to practical pharmaceutical scenarios. Our utilization of a singular software platform and emphasis on real-world medicinal data contribute to the robustness and practicality of our methodology.
In mathematical terms, a graph G is represented as an ordered pair G = (V, E), where V = V(G) is a set of vertices, and E(G) signifies the connections between pairs of vertices known as edges. In a chemical graph, vertices correspond to atoms, and edges represent bonds within the chemical compound. Vertices are considered adjacent if there is an edge connecting them. The degree or valency of a vertex ν ∈ V(G) is the count of adjacent vertices and is denoted as dν. For organic chemical compounds, the maximum vertex degree is four, as carbon atoms typically have a valency of four. For a more comprehensive understanding of notations and terms related to chemical graph theory, we recommend referring to prior research [29, 30].
Actually, the topological descriptors
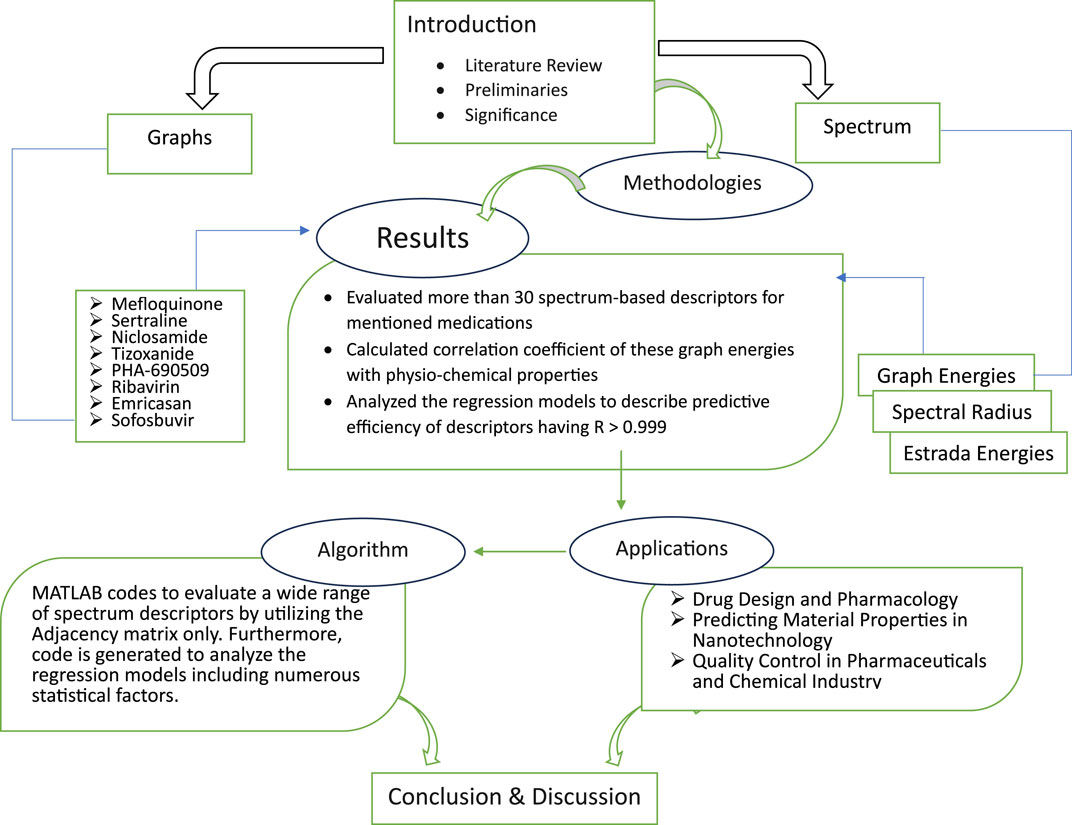
FIGURE 1. Paper structure overview: Navigating the research hierarchy.
The adjacency matrix, denoted as
Estrada introduced another graph parameter related to A-eigenvalues, known as the Estrada index and afterwards, it appeared as a significant invarient as assessing the robustness of networks, describing the topological structure classes and measuring centrality of complex networks including the protein’s degree folding [38–41]. The count of positive, negative and zero A-eigenvalues obtained from adjacency matrix of a graph are called the positive inertia index
Laplacian matrices are fundamental in graph theory. Given the adjacency matrix
The eigenvalues of
The Laplacian energy [47] is an energy analogue of the Laplacian matrix. For a graph G, it is defined as:
Zhou and Gutman [48] delved into mathematical properties of the spectral radius obtained by the Laplacian matrix for graphs. Similarly, the Laplacian based Estrada index [49] is:
Recent advancements in the mathematical behavior, properties and applications of mentioned index can be found in previous studies [50, 51]. Furthermore, the signless Laplacian matrix is:
while the eigenvalues of
For in-depth exploration of
A connection between the
The exploration of mentioned descriptor was done by Ellahi et al. [58] and Nasirie et al. [59] as they evaluated the provided sharp bounds and explored the maximum and minimum values of signless Laplacian Estrada index of graphs with given chromatic numbers.
In 2005, Rodríguez [60] introduced the Randić descriptor whose matrix for a graph is obviously a symmetric matrix with order n × n, defined as follows:
Consider the eigenvalues of R are
Utilizing the above definition, Randić energy of graphs was inaugurated by Bozkurt et al. [14] as
Gutman et al. [61] Sorgun et. al [62]. further contributed to explored the chemical significance and mathematical related to the Randić energy.
In 2010, Trinajstic [63] introduced the concept of sum-connectivity descriptor whose matrix for a graph is obviously a symmetric matrix with order n × n, defined as follows:
Utilizing the eigenvalues of S, denoted as
Recent research by Prakasha et al. [64] has further delved into the properties of the sum-connectivity energy in graphs.
Zagreb indices, pivotal in studying π-electronic energies of organic compounds, have led to the development of two important matrices. Rad et al. [65] introduced the first Zagreb matrix Z1 based on the first Zagreb index. It is an n × n symmetric matrix, defined as:
The Z1-eigenvalues, denoted as
In parallel, the second Zagreb matrix Z2, introduced by Rad et al. [66] and Zhan et al. [67], is based on the second Zagreb index. It is also an n × n symmetric matrix:
The ZG2-eigenvalues,
Both matrices have been subjects of in-depth mathematical studies, and Rad et al. [66] contributed essential results on the second Zagreb spectral radius and energy.
In the realm of graph theory, the harmonic matrix was first introduced by Hosamani et al. in their work [68]. This matrix, denoted as H(G), corresponds to the harmonic index of a graph with n vertices and is defined as an n × n symmetric matrix:
Now, let’s denote the eigenvalues of this harmonic matrix H for a graph G as
In a separate study by Jahanbani et al. [17], some remarkable findings were obtained concerning the harmonic energy and the harmonic Estrada index of graphs.
The Molar volume, Polarizability, Molar refractivity, and Complexity are fundamental quantum-theoretic characteristics of chemical compounds, particularly important for drugs targeting infectious diseases. In Section 2, we introduced spectrum-based valency descriptors, and now we are evaluating their ability to predict these physicochemical properties. We use our technique, as discussed in the previous section, to calculate these descriptors for various drugs, namely, Mefloquinone, Sertraline, Niclosamide, Tizoxanide, PHA-690509, Ribavirin, Emricasan, and Sofosbuvir. Details of these all drugs can be found in a file that we have uploaded on the GitHub repository [https://github.com/alleerazza786/DD]. Mefloquine, a quinoline derivative, is widely employed as an antimalarial agent, particularly in regions with chloroquine-resistant strains of Plasmodium. It has been shown to be effective in the prevention and treatment of malaria [69].
Sertraline, a selective serotonin reuptake inhibitor (SSRI), is commonly prescribed for the treatment of various mood and anxiety disorders, including major depressive disorder, obsessive-compulsive disorder, and panic disorder [70]. Niclosamide, traditionally used as an anthelmintic agent, has gained attention for its potential in cancer therapy due to its antiproliferative and anticancer properties [71]. Tizoxanide, an active metabolite of nitazoxanide, exhibits broad-spectrum antiparasitic activity and has been explored for its use in treating parasitic infections such as giardiasis and cryptosporidiosis [72]. PHA-690509 is a potent, selective inhibitor of the cyclin-dependent kinase (CDK2) and has shown promise in preclinical studies for cancer treatment [73]. Ribavirin, a nucleoside analog, has been a key component of antiviral therapy, especially in combination with other drugs, for the treatment of hepatitis C and other viral infections [74]. Emricasan is a caspase inhibitor with potential applications in liver diseases, particularly in the management of liver fibrosis and cirrhosis [75]. Sofosbuvir, a direct-acting antiviral agent, has revolutionized the treatment of hepatitis C and has significantly improved cure rates with fewer side effects [76]. The descriptors displaying the strongest correlation with these properties are recommended for use in quantitative structure and property models. This study enhances the practical utility of these high-performing descriptors in QSAR/QSPR research, building upon prior seminal works [13, 77, 78].
The first algorithm mentioned in Supplementary Appendix S1A section is employed for the assessment of diverse graph energies. Nevertheless, we have provided the methodology for evaluating just three descriptors, such as Laplacian energy, signless Laplacian energy, and extended adjacency energy, as illustrative examples. This section leverages our proposed computational method to calculate commonly occurring spectrum-based topological descriptors and evaluate their effectiveness in correlating Molar volume, Polarizability, Molar refractivity, and Complexity. The intercorrelations between these properties and the spectrum-based descriptors outlined in Section 2 are presented in Tables 1, 2. The first row in the tables represents Molar volume, the second row represents polarizability, the third row represents molar refractivity, and the fourth row represents the complexity of the mentioned drugs. These values are sourced from the reputable chemistry-related website Chem Spider and PubChem. However interested researcher may find these experimental values from the URL [https://github.com/alleerazza786/DD]. The remaining rows contain the graph energies computed using the Matlab algorithm, as discussed in the following section.
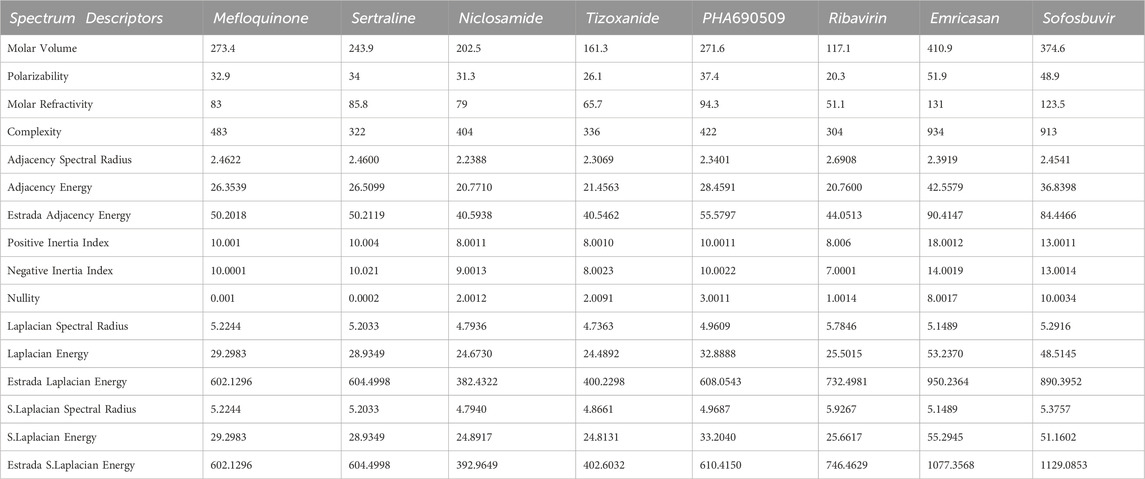
TABLE 1. The evaluated spectrum based descriptors values, along with numerous medications, provide experimental data for Molar volume, Polarizability and Molar Refractivity.
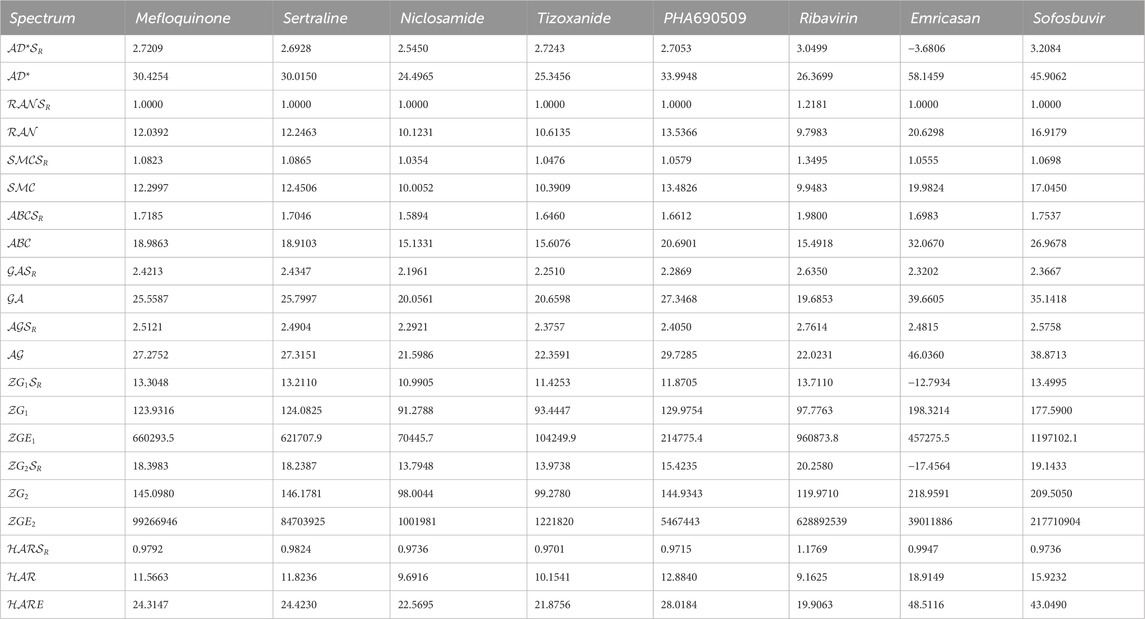
TABLE 2. The evaluated spectrum based descriptors values for numerous medications.
We utilize the data in Table 1 and Table 2 to calculate correlation coefficients, which serve as indicators of the efficiency of these spectrum-based descriptors. A simple rule of thumb is that higher correlation coefficients indicate superior performance for a given topological descriptor. Table 3 showcases the correlation coefficients between the physicochemical properties and the spectrum-based structural descriptors. Another Matlab algorithm is mentioned in Supplementary Appendix SA1 section which is utilized for the correlation analysis.
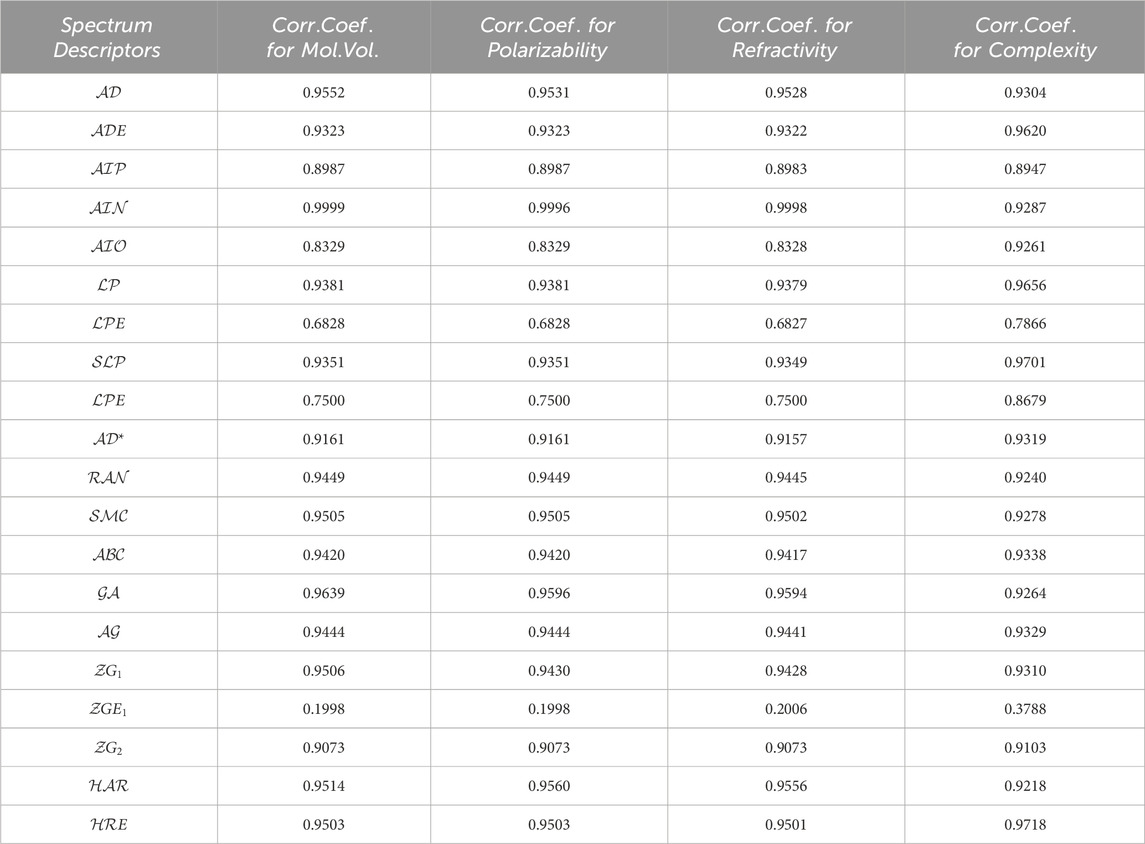
TABLE 3. The correlation coefficient evaluated between pharmacological properties for numerous medications and spectrum based descriptors.
Recently M. Arockiaraj et. al [79, 80]. extensively explores the predictive capabilities of reverse degree and entropy topological indices for drug molecules utilized in blood cancer treatment. This study employs Quantitative Structure Property relationship (QSPR) regression models to assess the effectiveness of these indices. Similarly, their work [81, 82] contributes to our understanding of regression models in the context of drug molecules designed for the latest treatments in combating COVID-19. The research specifically investigates the application of linear and cubic regression models to analyze generalized reverse degree-based topological indices for these crucial drugs. Together, these research studies provide a robust foundation for our current work and contribute valuable insights to the field. Utilizing the similar techniques, In this section, we delve into an in-depth analysis of the results we’ve obtained in the preceding section. The data found in Table 3 reveals some promising findings regarding spectrum-based descriptors. Notably, descriptors like negative inertia energy, adjacency energy, geometric-arithmetic energy, first zegrab energy, and harmonic energy exhibit exceptionally strong correlation coefficients, surpassing 0.999, which stands out among the rest. Conversely, a set of reputable spectrum-based descriptors, including extended adjacency, Laplacian, signless Laplacian spectral radius, and the second Zagreb Estrada indices, display notably weaker performance with correlation coefficients falling below 0.9. Any spectrum-based topological descriptor with a correlation coefficient below 0.9 is not recommended for incorporation into quantitative structure and property relationship models. Surprisingly, upon examining the data in Table 3, we find that negative inertia
Unexpectedly, the Adjacency and geometric-arithmetic energies perform strikingly similarly to the inertia positive energy, with correlation coefficients of 0.9639 and 0.9552, respectively, approaching a perfect correlation of 1. These two spectrum-based topological descriptors undoubtedly rank among the best, justifying their continued use in Quantitative Structure Property relationship models. Following the geometric-arithmetic and adjacency energies, the First zegrab and harmonic energies also exhibit favorable correlation coefficients. These correlation coefficients lead to the formulation of a priority list of the five most promising spectrum-based descriptors for assessing the physical and chemical properties of chemical compounds. You can find this priority list in Table 4.
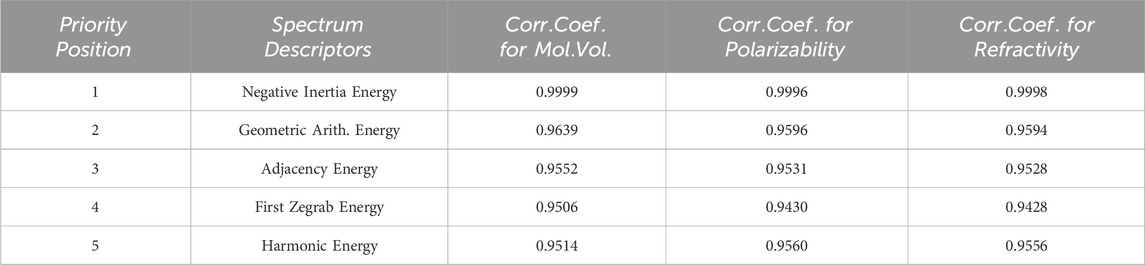
TABLE 4. Most efficient graph energies list along with correlation coefficients.
For these top five spectrum-based descriptors, we carry out a comprehensive regression and correlation analysis. This analysis includes the presentation of regression models, correlation and determination coefficients, and the standard error of fit, along with scatter plots.
We conducted a comprehensive regression analysis for the top two spectrum descriptors, Inertia Positive Energy and Adjacency Energy. This analysis encompasses the derivation of a regression equation and the calculation of various statistical metrics, shedding light on the nature of their relationship. The resulting regression equation provides insight into how changes in these spectrum descriptors influence the target variable. Furthermore, we assessed the precision of the regression model by examining coefficient standard errors. The correlation coefficient (R) quantifies the strength and direction of the relationship between the independent and dependent variables, while the R-squared value offers information about the proportion of variance in the target variable that the model explains. Additionally, we determined the Standard Error of Estimation, which gauges the accuracy of the model’s predictions. This in-depth analysis offers a robust understanding of the relationships between Inertia Positive Energy, Adjacency Energy, and the target variable, contributing valuable insights for further investigation and application. The provided data reveals strong linear relationships between the independent variable
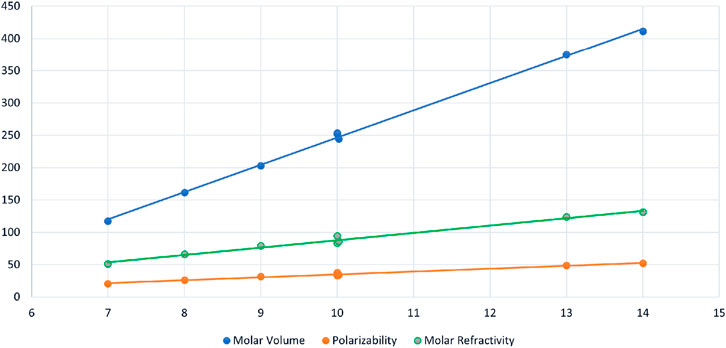
FIGURE 2. Scattered diagram of Inertia Negative Energy
The data represents regression results for three distinct chemical properties, including molar volume (MV), polarizability (PL), and molar refractivity (MR), each of which is modeled as a function of a common independent variable, denoted as
Similarly, polarizability (PL) is modeled as a linear function of
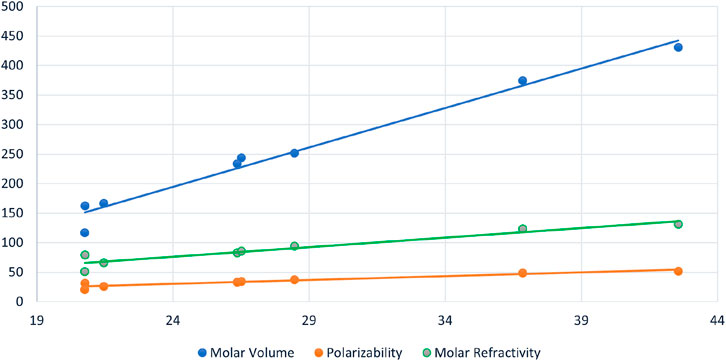
FIGURE 3. Scattered diagram of Geometric Arithmetic Energy
Figure 4 serves as a graphical representation of the data found in Table 3, allowing for a comprehensive comparison of the efficiency of various spectrum-based descriptors. This visual representation offers an insightful examination of the relationships between these descriptors and the properties of interest. Notably, the analysis reveals that among the considered drugs, Positive Inertia Energy stands out as the most efficient descriptor. This conclusion is supported by the observation that Positive Inertia Energy exhibits the highest correlation coefficients when correlated with three essential properties: Molar Volume, Polarizability, and Molar Refractivity. These strong correlations signify a robust association between Positive Inertia Energy and the chemical properties in question, indicating its potential significance in understanding and predicting these properties in the context of the studied drugs. The graphical representation in Figure [Reference] aids in conveying this valuable insight to a broader audience, facilitating a clearer understanding of the relationships between the spectrum-based descriptors and the chemical properties of interest.
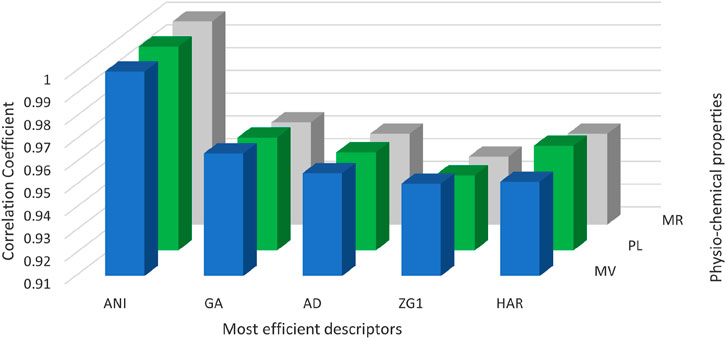
FIGURE 4. Graphical illustration of most efficient graph energies.
Our research has harnessed the power of spectrum based topological descriptors and linear regression models to forecast the attributes of chemical compounds effectively. This exploration has led to intriguing insights into the correlation coefficients among a multitude of graph energies. Notably, descriptors like negative inertia energy, adjacency energy, geometric-arithmetic energy, first zegrab energy, and harmonic energy have demonstrated remarkably strong correlation coefficients with the physicochemical properties of widely-used medications. Among these correlations, the one between
The original contributions presented in the study are included in the article/Supplementary Material, further inquiries can be directed to the corresponding author.
AR: Conceptualization, Data curation, Funding acquisition, Investigation, Methodology, Software, Writing–original draft. MM: Writing–review and editing.
The author(s) declare that no financial support was received for the research, authorship, and/or publication of this article.
The authors declare that the research was conducted in the absence of any commercial or financial relationships that could be construed as a potential conflict of interest.
All claims expressed in this article are solely those of the authors and do not necessarily represent those of their affiliated organizations, or those of the publisher, the editors and the reviewers. Any product that may be evaluated in this article, or claim that may be made by its manufacturer, is not guaranteed or endorsed by the publisher.
The Supplementary Material for this article can be found online at: https://www.frontiersin.org/articles/10.3389/fphy.2024.1348407/full#supplementary-material
1. Zhang X, Reddy HG, Usha A, Shanmukha MC, Farahani MR. A study on anti-malaria drugs using degree-based topological indices through QSPR analysis. Math Biosciences Eng (2023) 20(2):3594–609. doi:10.3934/mbe.2023167
2. Zhang X, Siddiqui MK, Javed S, Lubna S, Farah K, Hussain M. Physical analysis of heat for formation and entropy of ceria oxide using topological indices. Comb Chem High Throughput Screen (2022) 25(3):441–50. doi:10.2174/1386207323999201001210832
3. Wiener H. Structural determination of paraffin boiling points. J Am Chem Soc (1947) 69:17–20. doi:10.1021/ja01193a005
4. National Research Council. Physico-chemical properties and environmental fate. A framework to guide selection of chemical alternatives. Washington DC: NC Press (2014). p. 47–68.
5. Raza A, Munir MM. Insights into network properties: spectrum-based analysis with Laplacian and signless Laplacian spectra. Eur Phys J Plus (2023) 138:802. doi:10.1140/epjp/s13360-023-04441-z
6. Raza A, Munir MM, Abbas T, Eldin SM, Khan I. Spectrum of prism graph and relation with network related quantities. AIMS Math (2023) 8(2):2634–47. doi:10.3934/math.2023137
7. Deng F, Zhang X, Alaeiyan M, Mehboob A, Farahani MR. Topological indices of the pent-heptagonal nanosheets VC5C7 and HC5C7. Adv Mater Sci Eng (2019) 2019:1–12. Article ID 9594549. doi:10.1155/2019/9594549
8. Zhang X, Rauf A, Ishtiaq M, Siddiqui MK, Hussain M. On degree based topological properties of two carbon nanotubes. Polycyclic Aromatic Comp (2020) 42(3):866–84. doi:10.1080/10406638.2020.1753221
9. Zhang X, Jiang H, Liu J-B, Shao Z. The cartesian product and join graphs on edge-version atom-bond connectivity and geometric arithmetic indices. Molecules (2018) 23(7):1731–46. doi:10.3390/molecules23071731
11. Hayat S. Computing distance-based topological descriptors of complex chemical networks: new theoretical techniques. Chem Phys Lett (2017) 688:51–8. doi:10.1016/j.cplett.2017.09.055
12. Hayat S, Imran M. Computation of topological indices of certain networks. Appl Math Comput (2014) 240:213–28. doi:10.1016/j.amc.2014.04.091
13. Hayat S, Imran M, Liu J-B. Correlation between the Estrada index and π-electronic energies for benzenoid hydrocarbons with applications to boron nanotubes. Int J Quan Chem (2019) 119:e26016. doi:10.1002/qua.26016
14. Bozkurt ŞB, Güngör AD, Gutman I, Çevik AS. Randić matrix and Randić energy. MATCH Commun Math Comput Chem (2010) 64:239–50.
15. Chen X. On ABC eigenvalues and ABC energy. Linear Algebra Appl (2018) 544:141–57. doi:10.1016/j.laa.2018.01.011
16. Guo X, Gao Y. Arithmetic-geometric spectral radius and energy of graphs. MATCH Commun Math Comput Chem (2020) 83:651–60.
17. Jahanbani A, Raz HH. On the harmonic energy and harmonic Estrada index of graphs. Math Aspects Topological Indices (2019) 1:1–20.
18. Ashrafi AR, Ghorbani M, Jalali M. The PI and edge Szeged polynomials of an infinite family of fullerenes, Fullerenes, Nanotubes. Carbon Nanostruct (2010) 18(3):107–16. doi:10.1080/15363830903291614
19. Mehrani Z, Mottaghi A, Ashrafi AR. The topological study of IPR fullerenes by szeged and revised szeged indices. J Theor Comput Chem (2012) 11(3):547–59. doi:10.1142/S0219633612500356
20. Hayat S, Imran M, Liu J-B. An efficient computational technique for degree and distance based topological descriptors with applications. IEEE Access (2019) 7:32276–96. doi:10.1109/access.2019.2900500
21. Darafsheh MR. Computation of topological indices of some graphs. Acta Appl Math (2010) 110(3):1225–35. doi:10.1007/s10440-009-9503-8
22. Arockiaraj M, Kavitha SRJ, Balasubramanian K. Vertex cut method for degree and distance-based topological indices and its applications to silicate networks. J Math Chem (2016) 54:1728–47. doi:10.1007/s10910-016-0646-3
23. Ilić A, Ilić M. On some algorithms for computing topological indices of chemical graphs. MATCH Commun Math Comput Chem (2017) 78:665–74.
24. Ashrafi AR. Experimental results on the energy and Estrada index of HC5C7[4p, 8] nanotubes. Optoelectron Adv Mater Rapid Commun (2010) 4(1):48–9.
25. Gutman I. The energy of a graph. Ber Math Statist Sekt Forsch-ungszentram Graz (1978) 103:1–22. doi:10.1016/j.laa.2004.02.038
26. Lučić B, Trinajstić N, Zhou B. Comparison between the sum-connectivity index and product-connectivity index for benzenoid hydrocarbons. Chem Phys Lett (2009) 47(1-3):146–8. doi:10.1016/j.cplett.2009.05.022
27. Hayat S, Khan S, Imran M. Quality testing of spectrum-based distance descriptors for polycyclic aromatic hydrocarbons with applications to carbon nanotubes and nanocones. Arabian J Chem (2021) 14(3):102994. doi:10.1016/j.arabjc.2021.102994
28. Hayat S, Khan S. Quality testing of spectrum-based valency descriptors for polycyclic aromatic hydrocarbons with applications. J Mol Struct (2021) 1228:129789. doi:10.1016/j.molstruc.2020.129789
30. Gutman I, Polansky OE. Mathematical concepts in organic chemistry. New York: Springer-Verlag (1986).
31. Lee JR, Hussain A, Fahad A, Raza A, Qureshi MI, Mahboob A, et al. On ev and ve-degree based topological indices of silicon carbides. CMES-Computer Model Eng Sci (2022) 130(2):871–85. doi:10.32604/cmes.2022.016836
32. Zhang X, Raza A, Fahad A, Jamil MK. On face index of silicon carbides. Discr Dyn Nat Soc. (2020). doi:10.1155/2020/6048438
33. Alghazzawi D, Raza A, Munir U, Ali S. Chemical applicability of newly introduced topological invariants and their relation with polycyclic compounds. J Math (2022) 2022. doi:10.1155/2022/5867040
34. Zhang X, Wu X, Akhter S, Jamil MK, Liu J-B, Farahani MR. Edge-version atom-bond connectivity and geometric arithmetic indices of generalized bridge molecular graphs. Symmetry (2018) 10(12):751. doi:10.3390/sym10120751
35. Stevanović D. Spectral radius of graphs. Cambridge, Massachusetts, United States: Academic Press (2014).
36. Li X, Shi Y, Gutman I. Graph energy. Berlin/Heidelberg, Germany: Springer Science and Business Media (2012).
37. Gutman I. The energy of a graph: old and new results. In: Algebraic combinatorics and applications. Berlin, Heidelberg: Springer (2001). p. 196.
38. Estrada E. Characterization of the folding degree of proteins. Bioinformatics (2001) 18(5):697–704. doi:10.1093/bioinformatics/18.5.697
39. Zhang X, Awais HM, Javaid M, Siddiqui MK. Multiplicative Zagreb indices of molecular graphs. J Chem (2019) 2019:1–19. Article ID 5294198. doi:10.1155/2019/5294198
40. Estrada E, Rodríguez-Velázquez JA. Subgraph centrality in complex networks. Phys Rev E (2005) 75(1):056103. doi:10.1103/physreve.71.056103
41. Shang Y-L. Perturbation results for the Estrada index in weighted networks. J Phys A: Math Theor (2011) 44:075003. doi:10.1088/1751-8113/44/7/075003
43. Li S, Sun W. On the relation between the positive inertia index and negative inertia index of weighted graphs. Linear Algebra Appl (2019) 563:411–25. doi:10.1016/j.laa.2018.11.017
44. Ma H, Yang W, Li S. Positive and negative inertia index of a graph. Linear Algebra Appl (2013) 438:331–41. doi:10.1016/j.laa.2012.07.014
45. Liu H, Lu M, Tian F. On the Laplacian spectral radius of a graph. Linear Algebra Appl (2004) 376:135–41. doi:10.1016/j.laa.2003.06.007
46. Liu H, Lu M. Bounds for the Laplacian spectral radius of graphs. Linear Multilinear Algebra (2010) 58:113–9. doi:10.1080/03081080802450021
47. Zhou B, Gutman I. Laplacian energy of a graph. Linear Algebra Appl (2006) 414(1):29–37. doi:10.1016/j.laa.2005.09.008
48. Zhou B, Gutman I. On Laplacian energy of a graph. MATCH Commun Math Comput Chem (2007) 57:211–20. doi:10.1016/j.disc.2014.02.017
49. Fath-Tabar GH, Ashrafi AR, Gutman I. Note on Estrada and L-Estrada indices of graphs. Bull Acad Serbe Sci Arts Cl Sci Math (2009) 139:1–16.
50. Zhang H, Wang Y. On the maximum Laplacian Estrada index of graphs. Linear Algebra Appl (2016) 492:68–77. doi:10.1016/j.laa.2015.11.005
51. Zhu B-X. On the Laplacian Estrada index of graph. MATCH Commun Math Comput Chem (2011) 66:769–76.
52. Desai M, Rao V. A characterization of the smallest eigenvalue of a graph. J Graph Theor (1994) 18:181–94. doi:10.1002/jgt.3190180210
53. Fan Y-Z, Yang D. The signless Laplacian spectral radius of graphs with a given number of pendant vertices. Graphs Combin (2009) 25:291–8.
54. Abreua N, Cardoso DM, Gutman I, Martins EA, Robbiano M. Bounds for the signless Laplacian energy. Linear Algebra Appl (2011) 435:2365–74. doi:10.1016/j.laa.2010.10.021
55. Das KC, Mojallal SA. Relation between energy and (signless) Laplacian energy of graphs. MATCH Commun Math Comput Chem (2015) 74:359–66.
56. Ganie HA, Pirzada BA, Chat S. Signless Laplacian energy of a graph and energy of a line graph. Linear Algebra Appl (2018) 554:306–24. doi:10.1016/j.laa.2018.01.021
57. Ayyaswamy SK, Balachandran S, Venkatakrishnan YB, Gutman I. Signless laplacian Estrada index. MATCH Commun Math Comput Chem (2011) 66:785–94.
58. Ellahi HR, Fath-Tabar GH, Gholami A, Nasiri R. On maximum signless Laplacian Estrada index of graphs with given parameters. ARS Math Contemp (2016) 11:381–9. doi:10.26493/1855-3974.838.8fd
59. Nasiri R, Ellahi H, Fath-Tabar GH, Gholami A. On maximum signless Laplacian Estrada index of graphs with given parameters II. Electron J Graph Theor Appl (2018) 6(1):190–200. doi:10.5614/ejgta.2018.6.1.14
60. Rodríguez JA. A spectral approach to the Randić index. Linear Algebra Appl (2005) 400:339–44. doi:10.1016/j.laa.2005.01.003
61. Gutman I, Furtula B, Bozkurt ŞB. On Randić energy. Linear Algebra Appl (2014) 442:50–7. doi:10.1016/j.laa.2013.06.010
63. Zhou B, Trinajstić N. On sum-connectivity matrix and sum-connectivity energy of (molecular) graphs. Acta Chim Slov (2010) 57:518–23.
64. Prakasha KN, Reddy PSK, Cangul IN. Sum-connectivity energy of graphs. Adv Math Sci Appl (2019) 28(1):85–98.
65. Rad NJ, Jahanbani A, Gutman I. Zagreb energy and Zagreb Estrada index of graphs. MATCH Commun Math Comput Chem (2018) 79:371–86.
66. Rad NJ, Jahanbani A, Gutman I. Second Zagreb energy and second Zagreb Estrada index of graphs (2018). forthcoming.
67. Zhan F, Qiao Y, Cai J. On edge-Zagreb spectral radius and edge-Zagreb energy of graphs. Linear Multilinear Algebra (2018) 66:2512–23. doi:10.1080/03081087.2017.1404960
68. Hosamani SM, Kulkarni BB, Boli RG, Gadag VM. QSPR analysis of certain graph theocratical matrices and their corresponding energy. Appl Math Nonlin Sci (2017) 2:131–50. doi:10.21042/amns.2017.1.00011
70. Stahl SM, Pradko JF, Haight BR, Modell JG, Rockett CB, Learned-Coughlin S. A review of the neuropharmacology of bupropion, a dual norepinephrine and dopamine reuptake inhibitor. Prim Care Companion J Clin Psychiatry (2004) 6(4):159–166. doi:10.4088/pcc.v06n0403
71. Jin Y, Lu Z. Niclosamide, an old drug with potential new applications. Curr Opin Pharmacol (2020) 54:68–75.
72. Upcroft JA, Upcroft P. Tinidazole-resistant giardia duodenalis: clinical and experimental observations. Trans Roy Soc Trop Med Hyg (2001) 95(3):305–7.
73. Fry DW, Harvey PJ, Keller PR, Elliott WL, Meade M, Trachet E, et al. Specific inhibition of cyclin-dependent kinase 4/6 by PD 0332991 and associated antitumor activity in human tumor xenografts. Mol Cancer Ther (2004) 3(11):1427–38. doi:10.1158/1535-7163.1427.3.11
74. Manns MP, McHutchison JG, Gordon SC, Rustgi VK, Shiffman M, Reindollar R, et al. Peginterferon alfa-2b plus ribavirin compared with interferon alfa-2b plus ribavirin for initial treatment of chronic hepatitis C: a randomised trial. The Lancet (2001) 358(9286):958–65. doi:10.1016/s0140-6736(01)06102-5
75. Jie Y, Youchun L, Jingxiang C. Emricasan for the treatment of liver cirrhosis: a meta analysis of randomized controlled trials. Afr Health Sci (2023) 23(2):402–408. doi:10.4314/ahs.v23i2.46
76. Lam AM, Espiritu C, Bansal S, Micolochick Steuer HM, Niu C, Zennou V, et al. Genotype and subtype profiling of PSI-7977 as a nucleotide inhibitor of hepatitis C virus. Antimicrob Agents Chemother (2012) 56(6):3359–68. doi:10.1128/aac.00054-12
77. Chen D. Comparison between two kinds of connectivity indices for measuring the π-electronic energies of benzenoid hydrocarbons. Z Naturforsch A (2019) 74(5):367–70. doi:10.1515/zna-2018-0429
78. Nikolić S, Trinajstić N, Baučić I. Comparison between the vertex- and edge-connectivity indices for benzenoid hydrocarbons. J Chem Inf Comput Sci (1998) 38:42–6. doi:10.1021/ci970031m
79. Arockiaraj M, Greeni AB, Kalaam AA. Comparative analysis of reverse degree and entropy topological indices for drug molecules in blood cancer treatment through QSPR regression models. Polycyclic Aromatic Comp (2023) 1-18:1–18. doi:10.1080/10406638.2023.2271648
80. Javed S, Siddiqui MK, Khalid S, Manzoor S, Khan UZ. Predictive modeling of the heat of formation of sulfur hexafluoride using data science techniques. Eur Phys J Plus (2023) 138:1119. doi:10.1140/epjp/s13360-023-04761-0
81. Arockiaraj M, Greeni AB, Kalaam AA. Linear versus cubic regression models for analyzing generalized reverse degree based topological indices of certain latest corona treatment drug molecules. Int J Quan Chem (2023) 123:e27136. doi:10.1002/qua.27136
Keywords: regression model, graph spectrum, spectral radius, pharmacological traits, correlation coefficient
Citation: Raza A and Munir MM (2024) Exploring spectrum-based descriptors in pharmacological traits through quantitative structure property (QSPR) analysis. Front. Phys. 12:1348407. doi: 10.3389/fphy.2024.1348407
Received: 02 December 2023; Accepted: 30 January 2024;
Published: 12 February 2024.
Edited by:
Adnan Aslam, University of Engineering and Technology, PakistanReviewed by:
Micheal Arockiaraj, Loyola College, IndiaCopyright © 2024 Raza and Munir. This is an open-access article distributed under the terms of the Creative Commons Attribution License (CC BY). The use, distribution or reproduction in other forums is permitted, provided the original author(s) and the copyright owner(s) are credited and that the original publication in this journal is cited, in accordance with accepted academic practice. No use, distribution or reproduction is permitted which does not comply with these terms.
*Correspondence: Ali Raza, YWxsZWVyYXp6YTc4NkBnbWFpbC5jb20=
Disclaimer: All claims expressed in this article are solely those of the authors and do not necessarily represent those of their affiliated organizations, or those of the publisher, the editors and the reviewers. Any product that may be evaluated in this article or claim that may be made by its manufacturer is not guaranteed or endorsed by the publisher.
Research integrity at Frontiers
Learn more about the work of our research integrity team to safeguard the quality of each article we publish.