
94% of researchers rate our articles as excellent or good
Learn more about the work of our research integrity team to safeguard the quality of each article we publish.
Find out more
ORIGINAL RESEARCH article
Front. Phys., 08 March 2024
Sec. Soft Matter Physics
Volume 12 - 2024 | https://doi.org/10.3389/fphy.2024.1345966
This article is part of the Research TopicRheology and Complex Fluids in Biomedical ApplicationsView all 7 articles
When cells in a suspension flow through a microfluidic channel and rotate within the field of view (FOV) of a holographic microscope, they become accessible to a light beam from various angles. This allows the retrieval of a three-dimensional refractive index map for each flowing cell, essentially a 3D phase-contrast tomogram. Understanding the effects of hydrodynamic interactions among cells on their rotational behaviour during flow is crucial for designing microfluidic devices for holographic imaging. In this study, we employ direct numerical simulations to investigate the dynamics of cell clusters suspended in a Newtonian liquid under pressure-driven flow within a microfluidic channel, with the aim of clarifying the influence of hydrodynamic interactions on cell rotation.
In the last decade, imaging flow cytometry (IFC) [1-3] has added high resolution optical and/or spectroscopic information to the conventional flow cytometry technology [4], so revealing a powerful measurement method in diagnostics and healthcare. Even if the throughput that these systems can achieve is remarkable (up to tens of thousands of cells per second), IFC only provides single 2D projections of 3D objects and is based on fluorescence analysis, thus needing for a labelling of the cells. Recently, quantitative phase imaging (QPI) based on digital holography (DH) has been proposed as a low-cost system to achieve rapid cell detection [5]. In conventional DH cell imaging, cells are placed in Petri dishes to complete the necessary recordings, yet this microscopic technology has the drawback of allowing to observe a limited number of cells in the time unit. This weakness is easily overcome by holographic flow-cytometry [6, 7], which combines DH with microfluidics, ensuring high-throughput and high-precision imaging of flowing cells. One of the advantages of using DH with microfluidics is that there is no need for cell focusing thanks to the multi-refocusing and label-free capabilities of QPI. The combination between QPI and flow cytometry has been demonstrated fruitful for important biomedical applications, e.g., the detection of erythrocytes infected by plasmodium falciparum, the identification of circulating tumor cells, or the classification and phenotyping of human leukemic cells, also due to the revolution introduced by deep learning [8]. A step forward of opto-fluidic holographic microscopy in the direction of information expansion is represented by phase-contrast tomography (PCT), which allows the precise 3D refractive index (RI) mapping at the subcellular level [9]. ‘Conventional’ PCT requires that the sample is illuminated by many different angles all around it to enable its 3D reconstruction. On the other hand, if cells are suspended in a medium subjected to a pressure-driven flow in a microfluidic channel, a fixed source of light can illuminate a portion of the channel and cells expose all their external surface to the light due to flow-induced rolling, which means that the PCT can be achieved in a conventional holographic microscopy system without any special setups. This paradigm has been demonstrated by reconstructing the 3D RI distribution of red blood cells and diatoms [10] and circulating tumor cells [11], even by exploiting deep learning [12,13]. A comprehensive overview of different label-free imaging modalities for biomedical applications can be found in the recent work by [14].
To achieve the PCT of cells flowing in a microfluidic channel, the full rotation of each cell within the field of view (FOV) of the imaging apparatus needs to be assured. In addition, depending on the reconstruction algorithm, a minimum number of images (taken from different angles while the cell rotates) is needed for the 3D reconstruction of the cell, thus, given the frame rate of the available holographic recording system, this places a constraint on the flow rate of the suspension carrying the cells. Another constraint is related to the fact that cells must not deform significantly during their rotation within the FOV. Therefore, the in-flow PCT technology needs a fine control of both the translational and the rotational dynamics of the cells flowing in the microfluidic channel. Of course, even if controlling their dynamics is simpler, analysing isolated cells can limit the throughput of the system. Hence, the ability of processing concentrated suspensions (as native biological samples, e.g., the blood, actually are) is desirable. On the other hand, an additional element of complexity exists when concentrated systems are considered, namely, the hydrodynamic interactions among cells close to each other. Recently, [15] studied both experimentally and numerically the dynamics of a concentrated suspension of ISK cells and its implications on the feasibility of high-throughput microfluidic holographic cyto-tomography. In this work, we perform finite-element direct numerical simulations of the dynamics of clusters of cells suspended in a Newtonian liquid subjected to pressure-driven flow in a microfluidic channel with the aim of elucidating the effects of the hydrodynamic interactions on cell rotational behaviour.
We consider the computational domain reported in Figure 1, namely, a portion of a microfluidic channel with a squared cross section with side H. An aqueous solution carrying cells is fed to the channel with a flow rate Q. In the simulations, a cluster of 7 cells is considered (the zoom on the right in Figure 1 showing a possible initial configuration). Since many cells, e.g., leukocites or circulating tumor cells (CTCs), are quasi-spherical [11, 15, 16], they are modelled as elastic particles with an initially scalene ellipsoidal shape with the semiaxes having lengths close to each other. The orientation of each particle is given by the unit vector pi directed as the major semiaxis of the ellipsoid. In Table 1, we report the quantitative values of the aspect ratios L/B and L/W and of the confinement ratio β of the ellipsoidal particles considered in the numerical simulations. We point out that L, B, and W denote the semiaxes of the ellipsoids (L always being the major semiaxis), whereas the confinement ratio is computed as β = 2Req/H, where Req = (LBW)1/3 is the equivalent radius of the ellipsoid. It is worth remarking that the values of the aspect ratios in Table 1 have been chosen arbitrarily, yet making sure that they are quite close to one. On the other hand, the values of the confinement ratio are all around 0.05 (this would be the case, for example, of cells with an equivalent radius of about 5 µm in a channel with a square cross section with a side of 200 µm). In Figure 1, also the FOV of a hypothetical imaging apparatus is sketched, corresponding to a rectangular window with a width WFOV equal (at least) to that of the channel and a length LFOV (depending on the optical tools available in an actual experimental situation).
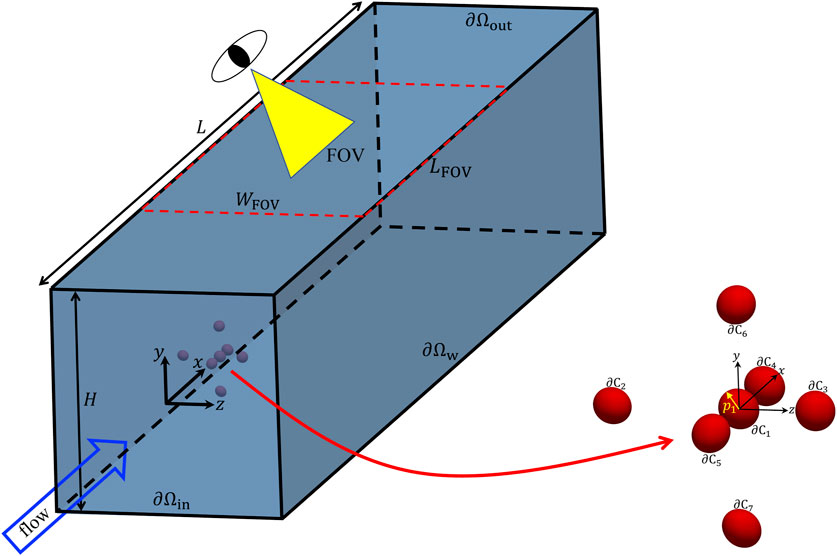
FIGURE 1. Geometry of the computational domain employed in the numerical simulations with a zoom showing a possible initial configuration of a cell cluster, also showing that each cell is modelled as a scalene ellipsoid whose orientation is identified by the unit vector pi directed as the major semiaxis of the ellipsoid. In addition, the FOV of a hypothetical imaging apparatus is sketched.

TABLE 1. Values of the aspect ratios L/B and L/W and of the confinement ratio β of the ellipsoidal particles considered in the numerical simulations.
We assume that the system is inertialess, that both the suspending liquid and the cells are incompressible, and that the cells are non-Brownian and neutrally buoyant. Hence, the system is described by the mass and momentum balance equations in the Stokes formulation, reading
where u is the velocity vector and T is the stress tensor. In the liquid phase, the Newtonian constitutive equation holds, thus
with p the pressure, I the identity tensor, η the dynamic viscosity, and D = (∇u + ∇uT)/2 the strain-rate tensor. The mechanical behaviour of the cells is instead modeled through the neo-Hookean hyperelastic constitutive equation, which can adequately describe biological particles when they undergo moderate deformations [17, 18], thus the expression for T is
with τ the extra-stress tensor, for which, in a velocity-based formulation, we can write
where
The balance equations reported above are supplied with the following boundary conditions:
Eq. 6 expresses the no-slip and no-penetration conditions for the liquid velocity on the channel walls ∂Ωw, whereas Eqs (7)–(8) are the periodicity conditions on fluid velocity and traction between the channel inlet ∂Ωin and outlet ∂Ωout, with Δp the pressure drop between the two boundaries (to be computed) and n the outwardly directed unit vector normal to the two boundaries. The periodicity condition means that the computational domain is part of a channel that repeats indefinitely along the flow direction (x). Of course, this implies that the actual length L of the computational domain must be chosen such that the cells hydrodynamically interact among them but do not ‘feel’ their periodic images along the x-direction. In the simulations, L = 6H. At the channel inlet, the liquid flow rate Q is imposed as
On each interface ∂Ci (i = 1, …, 7) between the suspending medium and a cell, the continuity of velocity and traction is imposed.
Since both the cells and the carrier liquid are inertialess, no initial condition is required for the velocity, whereas an initial condition needs to be specified for the extra-stress in the cells. We assume that the cells are initially stress-free, i.e.,
The side H of the square cross section of the channel is chosen as the characteristic length of the system. Correspondingly, the characteristic velocity is Q/H2, the flow characteristic time is H3/Q, and the fluid characteristic stress is ηQ/H3, whereas the cell characteristic stress is G. Given the aforementioned choices, the elastic capillary number is defined as Cae = ηQ/(H3G)), measuring the relative importance of liquid viscous stress and solid elastic stress. To make an example, let us consider an aqueous suspension of T lymphocytes (having G ∼ 30 Pa, see [20]) flowing with a flow rate Q ∼ 30 nL min−1 in a square-cross section channel with side H = 200 µm. This yields a Reynolds number Re = ρ(Q/H2)H/η (with ρ and η the density and viscosity of water, respectively) in the order of 10–3, thus validating the hypothesis of negligible inertia reported above, and an elastic capillary number of 3.5 × 10⁻⁶, meaning that the cells will undergo a negligible deformation [21], which is required for the feasibility of PCT. All the quantities appearing in the next sections are dimensionless. Finally, it is worth mentioning that all the results reported and discussed below refer to random values of the initial orientations of the cells, yet there are no qualitative effects on cell dynamics if different values are considered.
The equations presented in Section 2 are solved through the finite element method (FEM) with an arbitrary Lagrangian Eulerian (ALE) formulation. The non-commercial numerical code we use was originally developed at the TU/Eindhoven and makes use of stabilization techniques widely described in the literature, such as SUPG and log-conformation [22-24]. Both the liquid and the solid domains are discretised by a three-dimensional unstructured mesh of tetrahedra. On the interfaces between the liquid and the cells, the mesh elements on both sides conform and align with the interface, which is, then, described by triangles. To track the sharp interfaces between the cells and the suspending medium, a FEM with second-order time discretization is defined on them, where the normal component of the mesh velocity equals the normal component of the physical velocity, whereas the tangential velocity of the nodes is such that the distribution of the elements on the interface is kept uniform. This approach lets the mesh get rid of any ‘tank-treading’ motion of the elastic material, thus largely reducing the distortion of the ALE volume mesh. To stabilise the interface, the SUPG method is used. A more detailed description of the numerical method, of the approach used to treat the solid-liquid interface, and the results of several benchmark tests of the code are given by [25]. During the simulations, the elements of the mesh progressively deform because of the roto-translational motion of the cells in the channel. Any time the “quality” of the mesh elements in the computational domain becomes unacceptable (with respect to a threshold), a remeshing is performed and the solution is projected from the old to the new mesh, as technically detailed by [26, 27].
Convergence tests have been performed, thus mesh resolution and time-step for the numerical solution of the problem outlined above have been chosen so as to ensure invariance of the results upon further refinements (in other words, a discrepancy below 1%). For the simulations whose results are presented in this paper, meshes with a number of tetrahedra in the order of 4–5 × 10⁴ (each ellipsoid being discretised through about 1,500 elements) and time-steps of about 0.0003 times the characteristic time have been found to be adequate. An example of mesh discretising the computational domain is reported in Figure 2, the zoom showing the surface mesh on the interfaces between the liquid and the cells. Each simulation has been performed on 2 cores of a DELL Power Edge M710HD blade with 2 Intel Xeon E5649 hexacore processors @ 2.53 GHz and 48 GB of RAM, yielding a computational time of about 2 days.
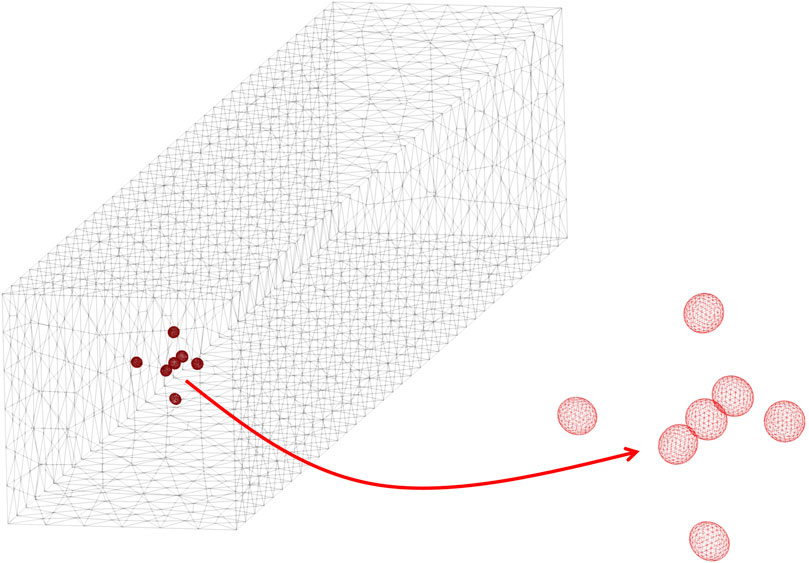
FIGURE 2. Example of a mesh of the computational domain, also showing a zoom of the surface mesh on the interfaces between the liquid and the cells.
Figure 3A gives the 3D representation of the initial spatial configuration of a cluster of cells within the microfluidic channel. In particular, the cell at the centre of the cluster (identified by no. 1) has its centre of volume at the centre of the cross section of the channel and it is surrounded by 6 cells (identified by numbers from 2 to 7) arranged along the positive and negative directions of the coordinate axes. In Figure 3B, the corresponding 2D view from the negative x-direction is reported, showing the positions of the cells within the cross section of the channel (of course, cells 5, 1, and 4 overlie in this view). The average distance between the centre of cell no. 1 and the centres of the surrounding cells is about 2.8 times the average equivalent diameter of the cells, where the equivalent diameter of the i-th cell is
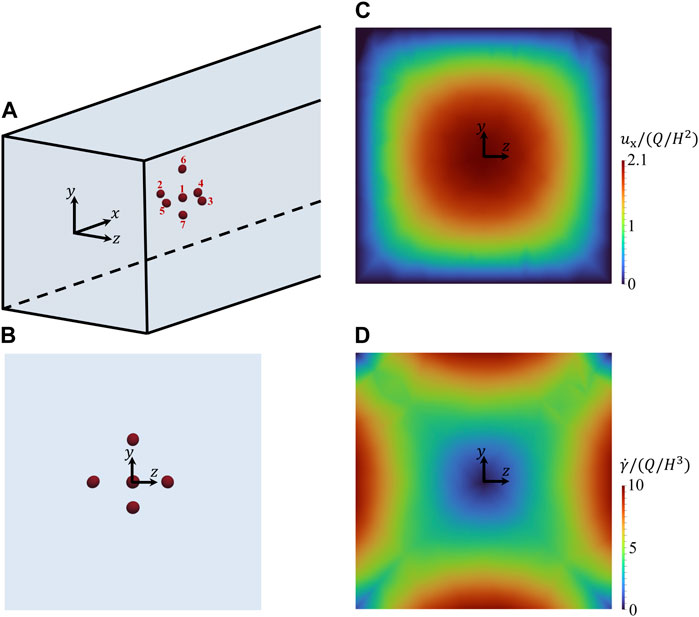
FIGURE 3. (A) 3D representation of the initial spatial arrangement of a cluster of cells within the microfluidic channel. (B–D): views from the negative x-axis of the initial arrangement of the cells (B), of the unperturbed field of the dimensionless x-component of the velocity of the suspending liquid in the cross section of the channel (C), and of the unperturbed field of the dimensionless shear rate of the suspending liquid in the cross section of the channel (D).
In Figure 4, we visually show how the cell cluster initially arranged as in Figure 3A evolves as time goes on at Cae = 3.5 × 10⁻⁶. In particular, xy-views (‘side’ views) of the cells are displayed in the column on the left, whereas xz-views (‘top’ views) are displayed on the right. It can be seen that the relative positions of the cells change while they are transported along the channel as a consequence of their different positions within the channel cross section, thus of the different flow velocity each of them feels. Correspondingly, their orientations evolve.
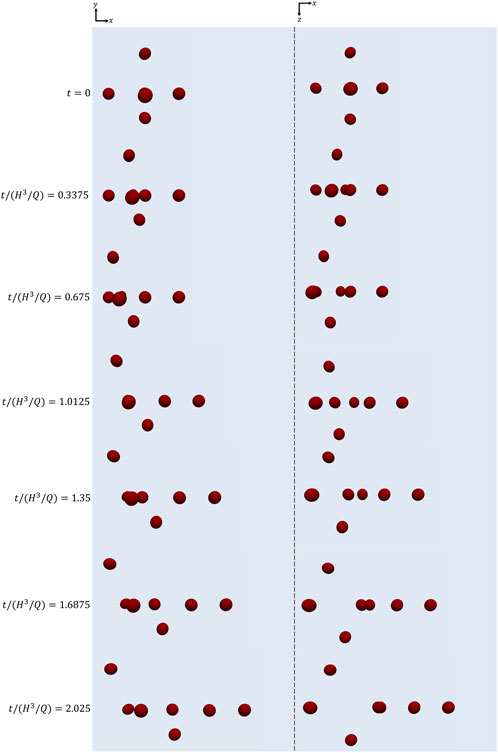
FIGURE 4. xy-views (left) and xz-views (right) of the cells initially arranged as displayed in Figure 3 at subsequent instants of time at Cae = 3.5 × 10⁻⁶.
The dimensionless x-positions of the cells are quantitatively tracked as a function of dimensionless time in Figure 5. Since the initial x-positions of the cells are different (see Figure 3A), the actual values of the x-coordinate of each cell xc,i (i = 1, …, 7) are subtracted by the corresponding initial value xc,i0 (and then divided by H to make them dimensionless). It can be observed that the trajectories are straight lines, meaning that the cells displace in the flow direction with a constant velocity, which, in turn, means that the cells do not change their y- and z-positions within the portion of the channel under observation. (For this reason, the evolution of the y- and z-positions of the cells are not reported.) In other words, the lateral migration to which, in principle, deformable particles are subjected also in inertialess Newtonian liquids (see [21]) is negligible at Cae = 3.5 × 10⁻⁶ (as actually expected, given how small this value is). The slope of each curve represents the translational velocity of the corresponding cell. By looking at the initial positions of the cells shown in Figure 3A, it can be observed that the closer a cell to the centre of the channel cross section the faster it moves in the flow direction (as it is obvious). The time at which the trajectories stop corresponds to when cell no. 4 crosses the outflow section ∂Ωout, thus making the simulation crush.

FIGURE 5. Evolution of the dimensionless shifted x-positions of the cells initially arranged as displayed in Figure 3 as a function of dimensionless time at Cae = 3.5 × 10⁻⁶.
The evolution of the 3 components of the orientation vectors of the cells is plotted as a function of their dimensionless shifted x-positions in Figure 6. Panels from a to g report the dynamics of cells from 1 to 7, respectively. The initial values of px, py, and pz are different from cell to cell because, as already said in Section 2, the initial orientations of the cells are chosen randomly, but there are no qualitative effects on cell dynamics if different values are considered. By looking at Figure 6, some comments can be made. First, the rotational dynamics of the cells is quite different from one to another: in particular, cells 1, 4, and 5 almost do not rotate at all, whereas the others show an appreciable evolution of the orientation vector. This is directly connected to the positions of the cells in the cross section of the channel: indeed, the centres of cells 1, 4, and 5 are almost at the centre of the channel, thus they do not feel almost any torque that makes them rotate while translating in the flow direction, whereas the other cells are located out of the centre and, consequently, they undergo a non-negligible in-flow rotation; however, none of the cells is ‘able’ to perform a complete rotation within a length of about 5 times the side of the cross section of the channel, as it is apparent from the fact that none of the periodic orbits in panels b, c, f, and g is complete. In other words, a FOV much longer then H would be necessary to perform the PCT of cells located like in Figure 6.
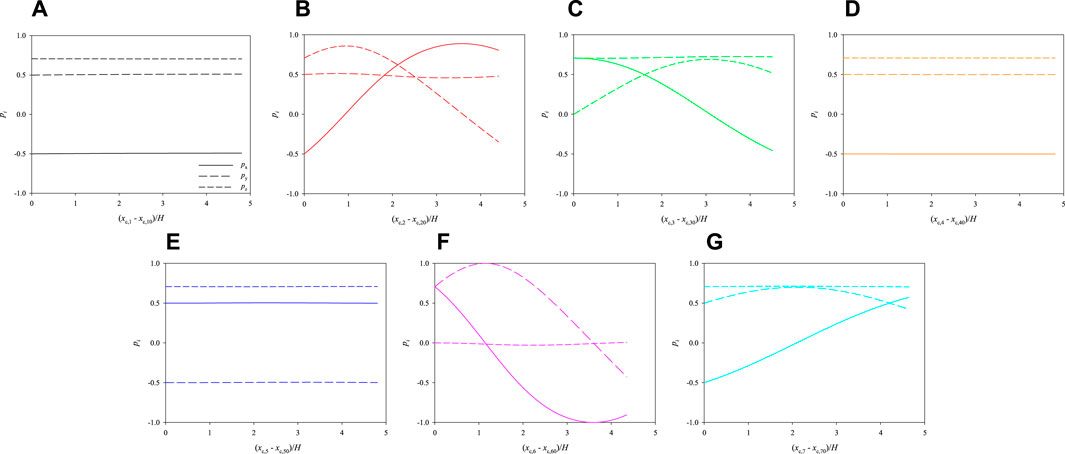
FIGURE 6. Evolution of the orientations of the cells initially arranged as displayed in Figure 3 as a function of their dimensionless shifted x-positions at Cae = 3.5 × 10⁻⁶.
Let us consider the two other initial arrangements of the cells shown in Figure 7, which have the same relative distances and orientations as in Figure 3, but different positions. Consequently, they are subjected to different hydrodynamic forces while they move in the channel. In Figure 8, we track the evolution of the 3 components of the orientation vectors of the cells initially arranged as displayed in Figure 7A as a function of their dimensionless shifted x-positions at Cae = 3.5 × 10⁻⁶. As above, panels from a to g report the dynamics of cells from 1 to 7, respectively, and, in each panel, the initial values of px, py, and pz are the same as in the corresponding panel in Figure 6. By comparing Figure 6 and Figure 8, it can be observed that, in the latter case, the cells rotate overall ‘more’ than above. This is directly connected to their initial positions in the cross section of the channel, thus to the extent of the local torque that makes them rotate while moving in the flow direction. Indeed, the cell that performs the minimum portion of a rotation is cell no. 6 (see panel f), whose location in the cross section of the channel is the closest to the centre, whereas cell no. 7 (see panel g), being the closest to the bottom wall of the channel, is able to perform a complete rotation within a distance in the flow direction of about 2.5H. On the other hand, all the other cells perform a bit less than one complete rotation within the length of the portion of the channel considered in our simulations.
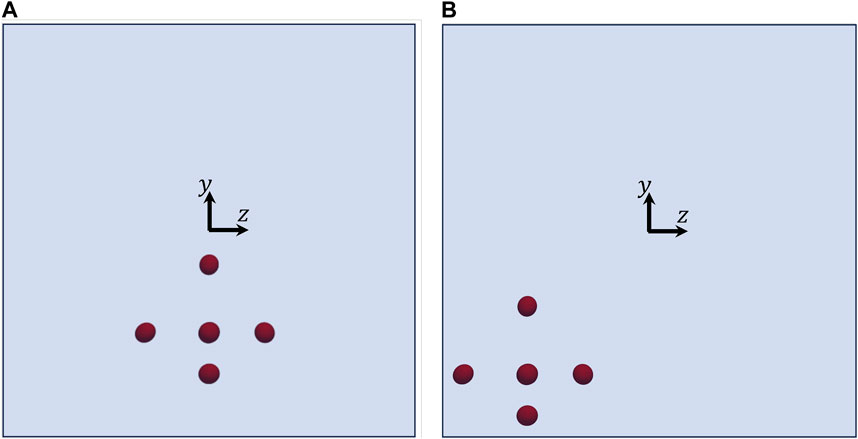
FIGURE 7. Views from the negative x-axis of two initial arrangements of the cells having the same relative distances and orientations as in Figure 3, but different positions in the channel.
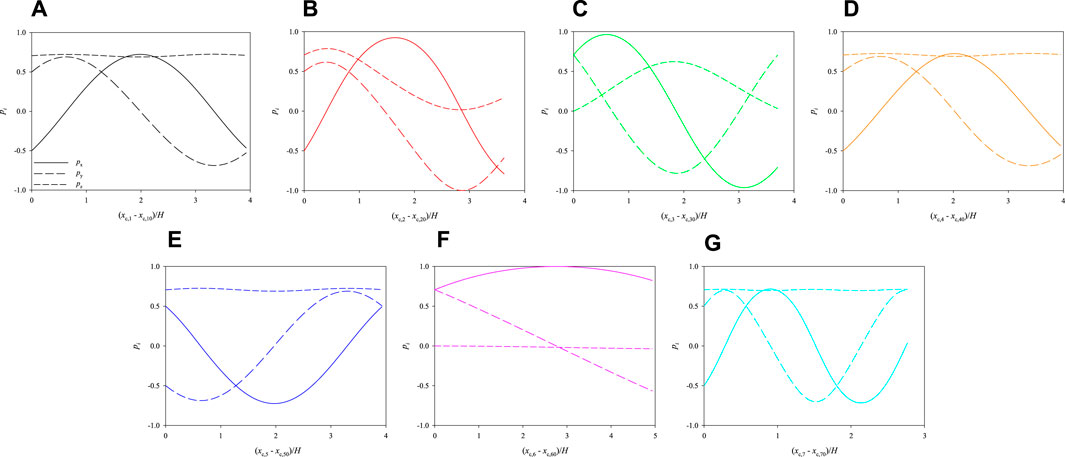
FIGURE 8. Evolution of the orientations of the cells initially arranged as displayed in Figure 7A as a function of their dimensionless shifted x-positions at Cae = 3.5 × 10⁻⁶.
In Figure 9, we track the evolution of the 3 components of the orientation vectors of the cells initially arranged as displayed in Figure 7B as a function of their dimensionless shifted x-positions at Cae = 3.5 × 10⁻⁶. The initial positions of the cells in the cross section of the channel, closer to two walls, are such as to further enhance their rotation. Indeed, all the cells perform more than a complete rotation within the length of the portion of the channel considered in the simulations.
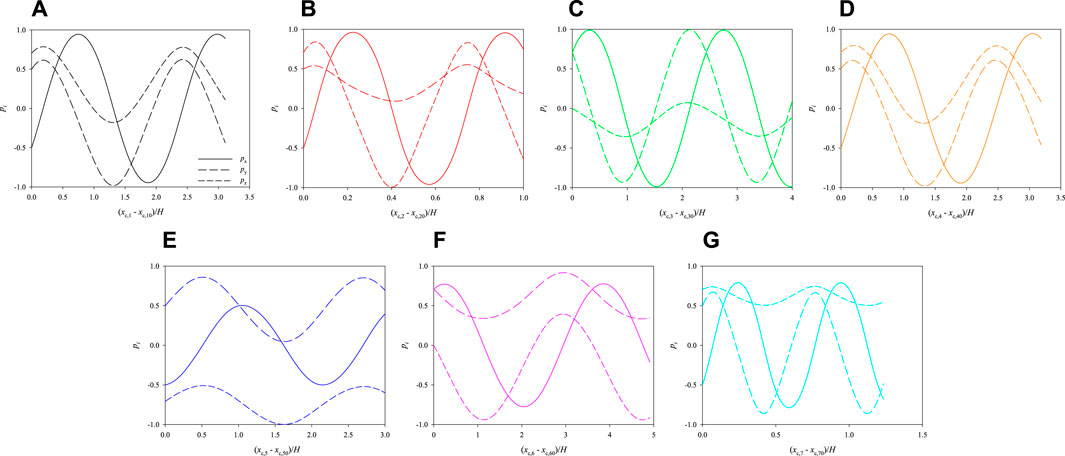
FIGURE 9. Evolution of the orientations of the cells initially arranged as displayed in Figure 7B as a function of their dimensionless shifted x-positions at Cae = 3.5 × 10⁻⁶.
Let us now consider the initial cell configuration represented by the blue ellipsoids in Figure 10A, where the cells represented in red are the same as in Figure 7B. As it can be seen, cell no. 1 has the same initial position as above, whereas cells from 2 to 7 are closer to it. In particular, in the ‘blue’ configuration, the average distance between the centre of cell no. 1 and the centres of the surrounding cells is about 2.35 times the average equivalent diameter of the cells (whereas it is of 2.8 times the average equivalent diameter of the cells in the ‘red’ configuration). Since the cells start closer than above, different dynamics might be expected. Actually, no qualitative variations are observed, yet the relative distances among the cells, and consequently their hydrodynamic interactions, do have a quantitative effect on their dynamics. In particular, we focus on the rotational dynamics of cell no. 1, because, since it is surrounded by the others, it is the most subjected to the effects of interparticle hydrodynamic interactions. In Figure 10B, we track the evolution of the orientation of cell no. 1 as a function of its dimensionless shifted x-positions at Cae = 3.5 × 10⁻⁶ for the two arrangements appearing in panel a, showing that, even if there are no qualitative differences, the presence of closer surrounding cells slows down the rotational dynamics of the cell under observation, as it needs a longer space in the flow direction to complete a rotation compared to the case where the surrounding cells are further. On the other hand, we also simulate the dynamics of cell no. 1 ‘alone’, i.e., in the absence of other cells around it, finding that its rotation is slightly faster than when it is surrounded by cells arranged like in the ‘red’ configuration in Figure 10A (see the gray curves in Figure 10B). Therefore, we might argue that, when the distance between the centres of 2 cells is above about 3 times their equivalent diameter, the hydrodynamic interactions between them have no relevant effects on their rotation. In passing, we recall that the disturbance induced by a single spherical particle immersed in a viscous fluid at vanishing inertia decays as 1/r, where r is the radial distance from the particle centre [28]. As an additional term of comparison, we report in Figure 10C the rotational dynamics of cell no. 1 alone and the analytical rotational dynamics of a rigid sphere suspended in a viscous liquid having a shear rate corresponding to that in the position of the centre of cell no. 1.
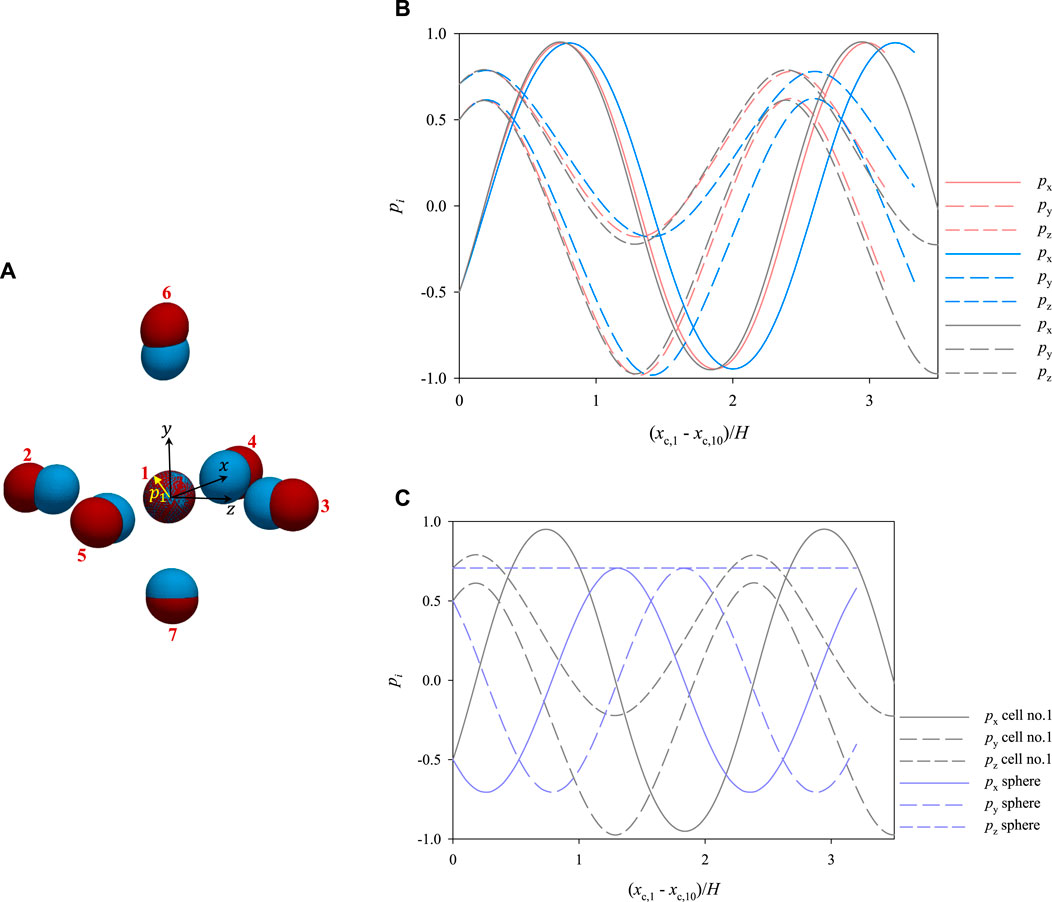
FIGURE 10. (A) 3D views of two different initial spatial arrangements of a cluster of cells within the microfludic channel. The arrangement of the cells represented in red corresponds to that in Figure 7B (B) evolution of the orientation of cell no. 1 as a function of its dimensionless shifted x-position at Cae = 3.5 × 10⁻⁶ for the two arrangements shown in panel a (the colours of the curves match those of the cells in panel a) and considered alone (gray curves). (C) comparison between the dynamics of cell no. 1 considered alone and that of a sphere with its centre in the same position as that of cell no. 1.
The results reported and discussed above can help to identify the conditions that allow to perform the PCT of cells. Of course, one crucial parameter with respect to that is the size of the FOV of the available imaging apparatus. To make an example, let us consider the plots in Figure 9: if an imaging apparatus with a FOV long 3H is available, all the cells considered in our simulation perform at least one complete rotation within such distance, but, if the available imaging apparatus has a FOV with a length equal to H, only cells 2 and 7 fulfill that condition. To further stress this point, we consider the most restrictive scenario of having a FOV with a length equal to H and we verify in what part of the cross section of the channel there are the conditions that allow a cell to perform a complete rotation within the length of the FOV. For simplicity, we perform this analysis by considering a single cell with the features of cell no. 1 above and we report the results in Figure 11, where the green area represents the portion of the cross section of the channel where there are the conditions allowing the cell to perform a complete rotation within a distance in the flow direction equal to H at Cae = 3.5 × 10⁻⁶, the shaded red area represents the portion of the cross section of the channel where such conditions are not satisfied, and the white area close to the sides of the square represents the region of the channel that is not accessible to the centre of the cell. It is apparent that, given LFOV = H, the conditions for PCT are satisfied only in a narrow region within the cross section of the channel, thus, if the available imaging apparatus imposes such a stringent constraint, some strategy to induce cell displacement in the ‘green’ area should be implemented, e.g., by making the cells sediment to the bottom of the channel (which is not considered in this work).
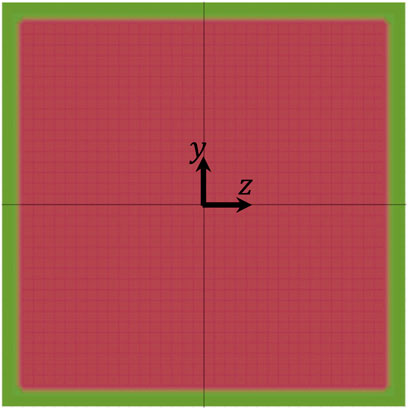
FIGURE 11. Diagram showing the portions of the cross section of the channel where there are (green) and there are not (shaded red) the conditions allowing a cell to perform a complete rotation within a distance in the flow direction equal to H at Cae = 3.5 × 10⁻⁶. The white area close to the sides of the square represents the region of the channel that is not accessible to the centre of the cell.
It is worth remarking that, until the flow stays in the Stokes regime, the translational and rotational velocities of the cells will scale in the same way if the flow rate (namely, Cae) is modified, thus the results reported above have a universal validity under inertialess conditions (given the geometrical features of the cells and the channel). On the other hand, if, by increasing the flow velocity, inertia (more likely) or cell deformability (harder) start to play a role, the lateral migration phenomena should also be taken into account (see, e.g., [29]).
In this work, we perform finite-element direct numerical simulations of the dynamics of clusters of cells suspended in a Newtonian liquid subjected to pressure-driven flow in a square-cross-section microfluidic channel with the aim of elucidating the effects of the hydrodynamic interactions on cell rotational behaviour and mechanical deformation. Indeed, to achieve the phase-contrast tomography (PCT) of cells flowing in a microfluidic channel, the full rotation of each cell within the field of view (FOV) of an holographic imaging apparatus must be achieved. Moreover, the cells must not deform significantly during their rotation within the FOV.
Since the hydrodynamic torque that makes the suspended cells rotate while flowing is connected to the gradient of the velocity of the carrier liquid in the cross section of the channel, the best conditions for cell rotation are found close to the channel walls (and the worst at the centre of the cross section). In addition, cell rotation must be achieved within the length of the FOV of the recording camera: this condition might not be fulfilled everywhere within the cross section of the channel, as the translational velocity of the carrier liquid (and consequently of the cells) has a non-uniform distribution, so the cells might travel ‘too fast’ in a certain portion of the section. Also from this point of view, the best location of the cells within the channel cross section might appear, thus, close to the walls, since the translational velocity is the lowest there, yet this could be disadvantageous in terms of the throughput of the operation.
Regarding the effects of hydrodynamic interactions among cells, the presence of close surrounding cells slows down their rotational dynamics, namely, they need a longer space in the flow direction to complete a rotation compared to the case where the surrounding cells are further. On the other hand, cell deformation in negligible in the characteristic ranges of the operating parameters considered here.
Known the size of the FOV of the available imaging apparatus, the results reported and discussed in this work can help to identify the conditions that allow to perform the PCT of cells.
The raw data supporting the conclusion of this article will be made available by the authors, without undue reservation.
AV: Investigation, Writing–original draft. MV: Conceptualization, Data curation, Formal Analysis, Investigation, Methodology, Software, Validation, Visualization, Writing–original draft, Writing–review and editing. PM: Conceptualization, Formal Analysis, Funding acquisition, Methodology, Writing–review and editing.
The author(s) declare financial support was received for the research, authorship, and/or publication of this article. This research was funded by the Italian collaborative agreement between the Italian Space Agency (ASI) and the University of Naples Federico II, n. 2021-20-HH.0, on “Innovative Health Technology Development Activities in Space”, Italian project code F65F21000830005.
The authors acknowledge prof. Martien A. Hulsen of the Eindhoven University of Technology as the main developer and copyright owner of the code used to perform the simulations whose results are reported in this work.
The authors declare that the research was conducted in the absence of any commercial or financial relationships that could be construed as a potential conflict of interest.
The author(s) declared that they were an editorial board member of Frontiers, at the time of submission. This had no impact on the peer review process and the final decision.
All claims expressed in this article are solely those of the authors and do not necessarily represent those of their affiliated organizations, or those of the publisher, the editors and the reviewers. Any product that may be evaluated in this article, or claim that may be made by its manufacturer, is not guaranteed or endorsed by the publisher.
1. Han Y, Gu Y, Zhang AC, Lo Y-H. Review: imaging technologies for flow cytometry. Lab A Chip (2016) 16:4639–47. doi:10.1039/c6lc01063f
2. Adan A, Alizada G, Kiraz Y, Baran Y, Nalbant A. Flow cytometry: basic principles and applications. Crit Rev Biotechnol (2017) 37:163–76. doi:10.3109/07388551.2015.1128876
3. Yang R-J, Fu L-M, Hou H-H. Review and perspectives on microfluidic flow cytometers. Sensors Actuators B: Chem (2018) 266:26–45. doi:10.1016/j.snb.2018.03.091
4. Kleiber A, Kraus D, Henkel T, Fritzsche W. Review: tomographic imaging flow cytometry. Lab A Chip (2021) 21:3655–66. doi:10.1039/d1lc00533b
5. Merola F, Mandracchia B, Miccio L, Memmolo P, Bianco V, Mugnano M, et al. Recent advancements and perspective about digital holography: a super-tool in biomedical and bioengineering fields. In: Advancement of optical methods & digital image correlation in experimental mechanics. Berlin, Germany: Springer (2018). p. 235–41.
6. Bishara W, Zhu H, Ozcan A. Holographic opto-fluidic microscopy. Opt express (2010) 18:27499–510. doi:10.1364/oe.18.027499
7. Paiè P, Martínez Vázquez R, Osellame R, Bragheri F, Bassi A. Microfluidic based optical microscopes on chip. Cytometry A (2018) 93:987–96. doi:10.1002/cyto.a.23589
8. Miccio L, Cimmino F, Kurelac I, Villone MM, Bianco V, Memmolo P, et al. Perspectives on liquid biopsy for label-free detection of “circulating tumor cells” through intelligent lab-on-chips. View (2020) 1:20200034. doi:10.1002/viw.20200034
9. Wang Z, Bianco V, Pirone D, Memmolo P, Villone MM, Maffettone PL, et al. Dehydration of plant cells shoves nuclei rotation allowing for 3d phase-contrast tomography. Light: Sci Appl (2021) 10:187. doi:10.1038/s41377-021-00626-2
10. Merola F, Memmolo P, Miccio L, Savoia R, Mugnano M, Fontana A, et al. Tomographic flow cytometry by digital holography. Light: Sci Appl (2017) 6:e16241. doi:10.1038/lsa.2016.241
11. Villone MM, Memmolo P, Merola F, Mugnano M, Miccio L, Maffettone PL, et al. Full-angle tomographic phase microscopy of flowing quasi-spherical cells. Lab A Chip (2018) 18:126–31. doi:10.1039/c7lc00943g
12. Pirone D, Sirico D, Miccio L, Bianco V, Mugnano M, Ferraro P, et al. Speeding up reconstruction of 3d tomograms in holographic flow cytometry via deep learning. Lab A Chip (2022) 22:793–804. doi:10.1039/d1lc01087e
13. Pirone D, Montella A, Sirico DG, Mugnano M, Villone MM, Bianco V, et al. Label-free liquid biopsy through the identification of tumor cells by machine learning-powered tomographic phase imaging flow cytometry. Scientific Rep (2023) 13:6042. doi:10.1038/s41598-023-32110-9
14. Shaked NT, Boppart SA, Wang LV, Popp J. Label-free biomedical optical imaging. Nat Photon (2023) 17:1031–41. doi:10.1038/s41566-023-01299-6
15. Pirone D, Villone MM, Memmolo P, Wang Z, Tkachenko V, Xiao W, et al. On the hydrodynamic mutual interactions among cells for high-throughput microfluidic holographic cyto-tomography. Opt Lasers Eng (2022) 158:107190. doi:10.1016/j.optlaseng.2022.107190
16. Alix-Panabières C, Pantel K. Challenges in circulating tumour cell research. Nat Rev Cancer (2014) 14:623–31. doi:10.1038/nrc3820
17. Caille N, Thoumine O, Tardy Y, Meister J-J. Contribution of the nucleus to the mechanical properties of endothelial cells. J Biomech (2002) 35:177–87. doi:10.1016/s0021-9290(01)00201-9
18. Mokbel M, Mokbel D, Mietke A, Traber N, Girardo S, Otto O, et al. Numerical simulation of real-time deformability cytometry to extract cell mechanical properties. ACS Biomater Sci Eng (2017) 3:2962–73. doi:10.1021/acsbiomaterials.6b00558
19. Larson RG. Constitutive equations for polymer melts and solutions: butterworths series in chemical engineering. United Kingdom: Butterworth-Heinemann (2013).
20. Bufi N, Saitakis M, Dogniaux S, Buschinger O, Bohineust A, Richert A, et al. Human primary immune cells exhibit distinct mechanical properties that are modified by inflammation. Biophysical J (2015) 108:2181–90. doi:10.1016/j.bpj.2015.03.047
21. Villone MM. Lateral migration of deformable particles in microfluidic channel flow of Newtonian and viscoelastic media: a computational study. Microfluidics and Nanofluidics (2019) 23:47. doi:10.1007/s10404-019-2212-3
22. Brooks AN, Hughes TJ. Streamline upwind/petrov-galerkin formulations for convection dominated flows with particular emphasis on the incompressible Navier-Stokes equations. Comp Methods Appl Mech Eng (1982) 32:199–259. doi:10.1016/0045-7825(82)90071-8
23. Guénette R, Fortin M. A new mixed finite element method for computing viscoelastic flows. J Non-Newtonian Fluid Mech (1995) 60:27–52. doi:10.1016/0377-0257(95)01372-3
24. Bogaerds AC, Grillet AM, Peters GW, Baaijens FP. Stability analysis of polymer shear flows using the extended pom–pom constitutive equations. J Non-Newtonian Fluid Mech (2002) 108:187–208. doi:10.1016/s0377-0257(02)00130-1
25. Villone MM, Hulsen MA, Anderson PD, Maffettone PL. Simulations of deformable systems in fluids under shear flow using an arbitrary Lagrangian eulerian technique. Comput Fluids (2014) 90:88–100. doi:10.1016/j.compfluid.2013.11.016
26. Hu HH, Patankar NA, Zhu M. Direct numerical simulations of fluid–solid systems using the arbitrary Lagrangian–eulerian technique. J Comput Phys (2001) 169:427–62. doi:10.1006/jcph.2000.6592
27. Jaensson N, Hulsen M, Anderson P. Stokes–cahn–hilliard formulations and simulations of two-phase flows with suspended rigid particles. Comput Fluids (2015) 111:1–17. doi:10.1016/j.compfluid.2014.12.023
28. Happel J, Brenner H. Low Reynolds number hydrodynamics: with special applications to particulate media. Berlin, Germany: Springer Science & Business Media (1983).
Keywords: flow cytometry, 3D phase-contrast tomography, microfluidics, hydrodynamic interactions, direct numerical simulations
Citation: Vitolo A, Villone MM and Maffettone PL (2024) Numerical study of the effects of hydrodynamic interactions among cells for microfluidic holographic cyto-tomography. Front. Phys. 12:1345966. doi: 10.3389/fphy.2024.1345966
Received: 28 November 2023; Accepted: 25 January 2024;
Published: 08 March 2024.
Edited by:
Antonio Perazzo, Novaflux, United StatesReviewed by:
Paweł Żuk, Institute of Physical Chemistry, Polish Academy of Sciences, PolandCopyright © 2024 Vitolo, Villone and Maffettone. This is an open-access article distributed under the terms of the Creative Commons Attribution License (CC BY). The use, distribution or reproduction in other forums is permitted, provided the original author(s) and the copyright owner(s) are credited and that the original publication in this journal is cited, in accordance with accepted academic practice. No use, distribution or reproduction is permitted which does not comply with these terms.
*Correspondence: Massimiliano M. Villone, bWFzc2ltaWxpYW5vLnZpbGxvbmVAdW5pbmEuaXQ=
Disclaimer: All claims expressed in this article are solely those of the authors and do not necessarily represent those of their affiliated organizations, or those of the publisher, the editors and the reviewers. Any product that may be evaluated in this article or claim that may be made by its manufacturer is not guaranteed or endorsed by the publisher.
Research integrity at Frontiers

Learn more about the work of our research integrity team to safeguard the quality of each article we publish.