 Chandan Shakya
 Jasper van der Gucht
 Joshua A. Dijksman
94% of researchers rate our articles as excellent or good
Learn more about the work of our research integrity team to safeguard the quality of each article we publish.
Find out more
ORIGINAL RESEARCH article
Front. Phys., 25 March 2024
Sec. Soft Matter Physics
Volume 12 - 2024 | https://doi.org/10.3389/fphy.2024.1334325
This article is part of the Research TopicRecent Advances in Understanding the Static and Creeping Response of Granular PackingsView all 6 articles
Granular materials are ubiquitous in nature and industry; their mechanical behavior has been a subject of academic and engineering interest for centuries. One of the reasons for their rather complex mechanical behavior is that stresses exerted on a granular material propagate only through contacts between the grains. These contacts can change as the packing evolves. This makes any deformation and mechanical response from a granular packing a function of the nature of contacts between the grains and the material response of the material the grains are made of. We present a study in which we isolate the role of the grain material in the contact forces acting between two particles sliding past each other. By using hydrogel particles, we find that a viscoelastic material model, in which the shear modulus decays with time, coupled with a simple Coulomb friction model, captures the experimental results. The results suggest that particle material evolution itself may play a role in the collective behavior of granular materials.
Particle packings composed of soft elements are relevant for many systems, from battery electrolytes to emulsions and biological cells. These particle packings are found to behave very differently from packings primarily made up of rigid particles. For instance, deformable particle packings will reach a higher packing fraction than equivalent packings made up of rigid particles, as found already in the classic work on pea packings by Weaire and Aste [1] as well as in recent 2D simulations by Cárdenas-Barrantes et al. [2]. The flow properties of soft particle packings are also different from their rigid particle counterparts, as shown by van der Vaart et al. [3] and Campbell [4]. To better understand soft particle packings, it is instructive to understand how one particle interacts with another via a single contact. After all, for a packing to undergo any bulk deformation, either the constitutive grains must squeeze or extend, or the constitutive particles need to rearrange. For any sort of rearrangement to occur, at least one of the particles must slide past another as the particles deform. Additionally, in packings made of grains, under any kind of slow, quasi-static load application, force balance on particles is maintained at all times via an appropriate redistribution of contact forces during the structural deformation in the packing. Any time dependence in the contact mechanics of the material or the contacts disrupts such a force balance. The relaxation of bulk material properties that is so typical for soft materials can give rise to spontaneous force imbalance situations in static packings made of soft grains. Soft granular packings can therefore experience particle motion, resulting in macroscopically observable (slow) changes in strain, such as creep. In this mechanism, the observed creep would occur without any change in the grain’s arrangement or fracture of the grains constituting the packing. The time dependence of particle contacts is a mechanism not often associated with granular creep, as illustrated in previous studies such as Andò et al. [5], Vandamme and Ulm [6], Lade and Liu [7], and Leung et al. [8], which mostly focus on harder grains. Particle interactions were conducted before Nardelli and Coop [9], in a study examining the evolution of normal and tangential forces as particles slid past each other. However, this study was limited to relatively hard grains, and the effect of deformability could not be studied in this experiment. Tsai and Tsai [10] studied the evolution of tangential and normal loading for deformable polydimethylsiloxane (PDMS) spheres immersed in a mixture of glycerol and water for sphere passing and fixed depth experiments. Giustiniani et al. [11] studied the deformation evolution of two droplets enclosed in an elastic adhesive film in shear and found a time-dependent exponential decay relationship for the angle between the surface of the drop and the needle holding the drop. This study also provides an insight into why such a relationship exists for such a system and compares the deformation in the experiment with a surface tension-driven simulation. Louf and Datta [12] also tracked the relaxation of the shape of a hydrogel bead in a bed of harder spheres and were able to find a timescale associated with it. The present study describes the experimental force response during a sliding event for a pair of initially spherical particles capable of significant deformation. Specifically, the study examines the evolution of horizontal and vertical forces of low friction, highly deformable particles immersed in water with undetectably small inter-particle adhesion.
The evolution of forces during contact formation and contact loss between a pair of soft particle spheres was investigated using two custom setups. A plate–plate compression setup is used to look at the force response of a particle as a function of time at a fixed overlap. In this case, the particles were loaded normally (i.e., center-to-center), and the evolution of the normal force was measured as a function of time. The custom inter-particle shear setup is used to investigate the change in contact forces as particles slide past each other, as in the case of particle rearrangement in a packing. In this setting, the particles are loaded obliquely (i.e., there is shear and compression), and both components of the response forces are expected to change in magnitude. The model materials used in this experiment were polyacrylamide hydrogel spheres produced by Educational Innovations Inc. (GB-710). The setups used are custom-made and described in the following sections.
The hydrogels are grown in Milli-Q water. They typically have a diameter of 18.5 mm after swelling. The hydrogel spheres to be tested are half-dyed with Nile blue perchlorate, and their dimensions perpendicular to the dye front are measured. Measurements of the hydrogel sphere diameter are taken three times. The gels are then placed with the dye front visible on the shell (as described below) and fastened in place with the collar. The dimensions, from the bottom of the shell to the tip of the gel sphere, are measured using Vernier calipers.
The sample (in this case the hydrogel sphere) is placed in a custom 3D-printed geometry. The geometry was inspired by the container devised by Tsai and Tsai [10]. The geometry consists of a cylindrical block with a hemispherical cutout (shell) that fits the hydrogel sphere to be tested. The spheres are held in place with a collar that has a hemispherical cutout matching that of the shell. The hydrogel sphere is held in position by screwing the collar to the block. Measurements for 3D-printed geometry are provided via a 2D drawing in a supplementary AutoCAD file.
The inter-particle shear setup was built based on previous work by Workamp and Dijksman [13] and Rudge et al. [14]. A schematic of the setup used in the set of experiments described in this study is shown in Figure 1A. A custom 3D cylindrical container is placed on the rheometer (Anton Paar MCR 501). A shell described in Section 2.1 is screwed in place to the cylindrical container. Since the container is 3D-printed and the spots to screw in the shells are pre-determined, this fixes the position of the shell relative to the center of the cylinder and rheometer tool. Another shell is screwed to a rotating arm, which can be connected to the rheometer. The distance between the spots to screw the fixed shell and the axis of rotation was set to 27 mm in the 3D model of the rotating arm to ensure that the shell in the container and the shell in the rotating arm slide over each other. The dimensions of the rotating arm and cylinder, along with the position of the screws, are also provided in the 2D AutoCAD file attached with this paper.
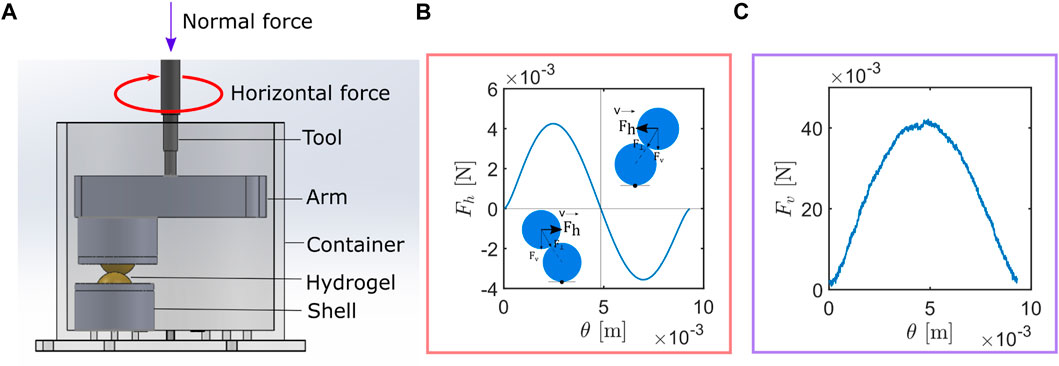
Figure 1. (A) Experimental setup: inter-particle shear. (B) Forces in the horizontal direction (Fh) vs. linear angular displacement (θ) in the rotational direction. As the moving particle approaches the stationary particle, as shown by the diagram on the bottom left, Fh acts toward the right, which is defined as the positive force. As the moving particle moves away from the stationary particle, Fh acts toward the left, which consequently gives a negative force. (C) Forces in the vertical direction (Fv) vs. linear angular displacement (θ) in the rotational direction.
The cylindrical container is placed on the rheometer, and a zero gap is performed with the custom axis fixed to the rotating arm. The tool and rotating arm are then moved up and removed. The half-dyed hydrogel spheres are then placed into their respective shells, and the collar is screwed into the shell. To test for a snug fit, we manually try and rotate the hydrogel in the shell and collar assembly. If the hydrogel sphere rotates in the shell, a larger, half-dyed sphere is used. We also attempt to rotate the new hydrogel in the shell. The process is repeated until we find a hydrogel sphere large enough such that it does not rotate within the shell–collar while being manually tested. The manual rotation tests involve much larger forces than the rheometric tests, establishing that no rotation of the fixed spheres occurs. Then the shells with the spheres can be fixed onto the container and the rotating arm and placed back into the measuring system. For the measurements shown in this study, the diameter of the upper hydrogel sphere is 18.4 ± 0.195 mm and the diameter of the lower hydrogel sphere is 19.1 ± 0.265 mm, as established by caliper measurements on different sides of the used spheres. The height of the shell and upper hydrogel sphere together is 29.53 mm, and the height of the shell with the lower hydrogel sphere is 31.25 mm. Thus, the tool is brought down to a gap of 65 mm to ensure the particles are not in contact. Milli-Q water is poured into the container until both the shells and the rotating arm are completely immersed.
The tool is then lowered 1 mm at a time and manually rotated to check for contact. Once contact is detected by observing a finite torque needed to rotate the tool, the probe is moved 1 mm up and locked at the instrument’s deflection angle reference position.
The tool is first rotated at 0.5 rpm. During this rotation, when a torque of 0.2 mNm is detected, the rotating arm is forced to stop. This torque is small enough to detect contact but larger than the initial torque that the rheometer has to apply in order to start the experiment from rest. If the specified torque level is not detected, the tool will move down 0.1 mm. This procedure was carried out to obtain an estimate of where the contact would occur in terms of displacement. Once the displacement required to obtain contact is known, further testing could be done using this displacement as a reference point. At low rotational velocities, this would mean that we would only need to conduct the test between known displacements, avoiding extraneous movement and time. The process is repeated until contact is detected using this procedure. Once contact is detected, the moment arm will rotate back to a fixed angle. Then, the tool will rotate at a speed of 2.38 × 10⁻⁵ m/s (8 × 10⁻⁴ [rpm]) for 3,000 s in the clockwise direction, stay fixed in the final position for 1 min, rotate back at the same speed for the same duration, and wait another minute. This process is repeated at speeds of 4.75 × 10⁻⁵, 1.19 × 10⁻⁴, and 2.37 × 10⁻⁴ m/s. Once a repetition is completed, the tool is moved down 0.1 mm (i.e., the overlap is increased by 0.1 mm). The whole process is repeated at the same set of speeds. A total of five overlap levels, each 0.1 mm apart, were explored. A sample dataset obtained from the measurement is shown in Figure 1B, which shows the horizontal force response (Fh) to sliding as a function of the linear angular displacement (θ). Here, θ is the product of the angular displacement (in radians) and the length of the moment arm (which is 0.027 m). Figure 1C shows the vertical force response (Fv) as a function of θ during the same experiment.
The setup for the plate–plate compression was a modified version of a previously existing custom-built setup used to conduct indentation tests on polymer samples. A schematic of the setup is shown in Figure 2A. The setup consists of an actuator (Thorlabs Z825BV) connected to a moving stage (Thorlabs MT1) controlled by a motor controller (Kinesis KDC 101) that can interact with a MATLAB platform. The moving stage is connected to a metallic rod using a Wheatstone bridge-based S-beam load sensor (FUTEK LSB200 FSH03871). The bridge is supplied with a constant voltage, and the output bridge signal is amplified using an amplifier, both of which were built into a strain gauge input signal conditioner (ICP DAS SG-3016). The amplified signal is then filtered using a low-pass RC filter (10Ω resistor and 10 nF capacitor). The filtered signal is then converted to a digital signal using a 14-bit analog-to-digital converter (ADC) present in a National Instruments data acquisition instrument (NI DAQ 6001). The digital signal can then be read into a computer using a MATLAB interface. The sampling frequency for the load cell was set to 1 kHz. The load cell is attached to a flat plate that is used to press the sample. The operation of the custom-built setup is also described by Boots et al. [15].
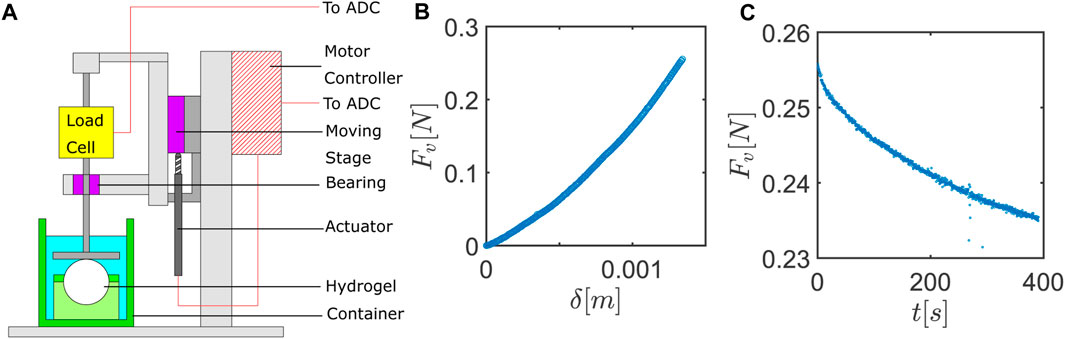
Figure 2. (A) Experimental setup: particle compression. (B) Typical force (Fv) vs. displacement curves (δ) during indentation. (C) Typical force (Fv) vs. time (t) curves when compressive strain is held static.
The shell with the sample is held in place in a larger container with double-sided tape. The container is then filled with water. The compression plate with the load cell is lowered into the container until the entire compression plate is underwater but does not touch the sample to be tested. An indentation test is performed with the compression plate moving down 0.5 mm at a speed of 0.3 mm/s to find the location of contact. The test results in a displacement (δ) vs. vertical force (Fv) plot are shown in Figure 2B. Once contact is found, the compression plate can be retracted, and the test is repeated to confirm the location of the contact point.
Once the point of contact is ascertained, the compression plate is moved to the location of contact, and a strain of 6% is applied at a strain rate of 0.002/s. For this experiment, the diameter of the hydrogel sphere was 18.63 ± 0.17 mm, as established by caliper measurements on different sides of the used sphere. It was compressed by 1.12 mm. The exact velocities and indentation distance are calculated based on the diameter of the particle being tested. Then the compression plate is held static for 3,000 s. Forces are recorded from the load cell during this entire process at a rate of 1000 Hz. After separating the forces during indentation, a typical force relaxation curve is observed, as shown in Figure 2C.
Herein, we explain the models used to analytically describe our experimental results. The following assumptions are applied to the model: (i) the particles in contact are perfectly spherical. (ii) The material in the experiment is perfectly homogeneous. (iii) The arc of rotation in the inter-particle shear experiment is sufficiently large to consider the difference between a linear particle pass and a circular path to be negligible. With these assumptions, the response of the bulk volumetric strain of the particle is calculated as a sum of two factors: the elastic response (modeled by a Hertzian model) and a dissipative response (modeled as a viscoelastic model). There is a long history of considering viscoelastic contact mechanics for spheres, particularly for use in discrete element methods. For a brief discussion on the history, we refer to Brilliantov et al. [17]. The combined model used here is based, among others, on the work and subsequent research done by Jian et al. [16], which takes a Kelvin–Voigt approach while also taking into account the relaxation effect of viscoelastic materials. Here, for simplicity, it is typically assumed that there is one dominant timescale. In brief, it assumes that the effective shear modulus of a particle is
where G(t) is the total effective shear modulus, Ge and
Here, F⊥(t) is the net center-to-center force of repulsion between the centers of the particles. Fe and
The elastic response resulting from the bulk compression of the particle volume is modeled using a Hertz model:
where Ge is the elastic part of the shear modulus of the system, R is the effective radius, δ is the overlap between the two interacting spheres in the center-to-center direction, ν is the Poisson’s ratio of the sphere, E* is the effective elastic modulus of the system, E1 is the Young’s modulus of the upper sphere, and E2 is the Young’s modulus of the lower sphere. In the case of the inter-particle shear experiment, we assume E1 = E2 = E (since the interacting spheres are made of the same material. In the case of the plate–plate compression experiment, we assume E1 = E and E2 = ∞, assuming that the plate stiffness is infinitely larger than the hydrogel sphere stiffness. In reality, the Young’s modulus of the hydrogel particle is approximately 8 kPa, and the Young’s modulus of the compressing plates and the shells holding the hydrogel is approximately 2.8 GPa, as specified by the data sheet from the 3D printing supplies manufacturer. For both experiments, it is assumed that ν1 = ν2 = ν = 0.5: hydrogels do not deswell in the context of the modest pressures exerted; the osmotic pressure of the gels is much higher than the local stress Schulze et al. [18]. R1 is the radius of the upper sphere, and R2 is the radius of the lower sphere. For the inter-particle shear test, R1 = 9.2 mm and R2 = 9.96 mm. It is also to be noted that in the case of plate–plate compression, R1 = 9.3 mm as the sphere is being compressed with a flat plate and R2 = ∞.
The time-dependent response seen with the experimental data is modeled using the viscous dissipative model from Jian et al. [16]. Their model calculates the dissipative part of the force response as
where s is the integration factor integrated from the moment of contact t = 0.
In addition to this model, a cutoff was implemented in the model such that the resultant forces from center-to-center Fe and
where Ff(t) is the total frictional force tangential to the surfaces in contact and μ is the coefficient of friction.
In this section, we examine how timescales affect force responses in the direction of motion and perpendicular to the direction of motion during a particle sliding event. Typical force responses in the direction of motion (hereafter referred to as the horizontal direction) and perpendicular to the direction of motion can be seen in Figures 1B, C, respectively. The following sections examine the various characteristics to be observed in such data and how the models described in Section 3 can help us interpret the experimental results.
We first examine the horizontal force response from the inter-particle shear experiment in a fixed gap and at a constant velocity, as shown in Figure 3A. In this figure, the upper particle is moved in a clockwise direction. Figure 3A plots the change in force in the horizontal plane (Fh) as a function of the linear angular distance traveled (θ) from the rheometer’s zero deflection angle reference point. Here, the increase in Fh on the left marks the formation of a contact. The detachment is marked by the return of the forces to a constant baseline. We can therefore establish the total distance of contact as the difference between the θ value at the point of contact and the θ value at the point of detachment. We refer to this distance as the deformed contact length (lc). This length, along with the points of contact and detachment, is visualized in Figure 3A. We call lc the deformed contact length, as the length determination is affected by the strain on the hydrogel sphere and sliding velocity. The figure also clearly shows that the peak magnitude of the force response (indicated with ←p) as the moving particle approaches the stationary particle’s center is larger than the trough magnitude (indicated with t→) as the moving particle moves away from the stationary particle’s center. Thus, an asymmetry in the force response in the horizontal direction is observed.
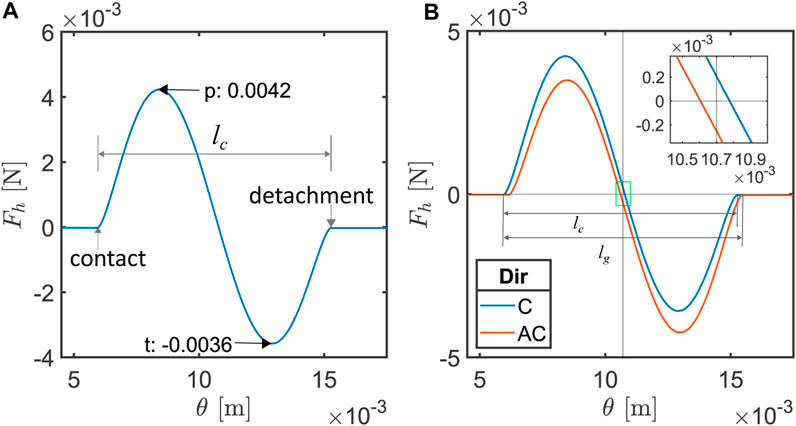
Figure 3. (A) Horizontal forces (Fv) at constant maximum δmax overlap and constant rotational velocity (v), as the probe moves clockwise. (B) Main: horizontal forces (Fv) at constant maximum δmax overlap and constant rotational velocity (v), as the probe moves clockwise (C: in blue) and anticlockwise (AC: in red); inset: force response at the center of the geometric contact length (the original area is highlighted in green).
After the deformed contact length determination in one rotation direction, we can rotate in the opposite direction to establish the true contact length. Figure 3B shows the horizontal force responses (Fh) when the test is repeated with the upper particle being moved in the opposite direction (the anticlockwise (AC) direction) in red, along with results from Figure 3A, where the upper particle was moved clockwise (C) in blue. The anticlockwise (AC) experiment measured the undeformed contact point of the hydrogel, which is needed to establish the undeformed contact length (referred to as the geometric contact length if the particle were perfectly rigid) lg. It needs to be kept in mind that the point of contact for the blue curve is on the left of the curve and the point of contact for the red curve is on the right side. To clarify why we need two length definitions, we can take a closer look at the data in Figure 3. Here, we notice that the point of detachment as the rotating arm is moved in the clockwise direction (blue data) does not spatially coincide with the position of the point of contact detected as the rotating arm is moved in the anticlockwise direction. The point of detachment in the AC direction is similarly different from the point of contact in the C direction. These observations mean that lg is longer than lc in both the clockwise and anticlockwise directions. For context, the difference between the deformed contact lengths lc in the clockwise and anticlockwise directions was only 5.5 μm, whereas the difference between the average contact length lc and geometric length lg was 219.2 μm for the dataset shown in this figure.
Furthermore, if we zoom in to the center of the geometric contact in Figure 3B inset, it can be noticed that the zero-crossing in the horizontal forces (the point where the horizontal forces change from positive to negative or vice versa) is not at the center of the contact distance. The zero-crossing moves away from the point of contact toward the point of detachment in both directions. This implies that there is a finite but small horizontal force acting on the particles, even when they are directly on top of each other.
Figure 4A compares the horizontal force response of spherical hydrogels in response to sliding at different constant velocity levels. The first feature that is apparent from this figure is that the amplitude of the troughs for the different sliding velocities does not coincide. On closer inspection, we notice that the amplitude of these troughs is greater for larger velocities. The same is also true for the peaks, but this feature is less pronounced in the plot as the relaxation is contact duration-dependent, and at the peaks, the contact is younger. Thus, a clear velocity-dependent response can be observed. When we recall Eq. 4, which essentially models the effective shear modulus as a decaying function with time, this experimental model makes sense. Experiments done at lower sliding velocities take a longer time and therefore work with a lower effective shear modulus; thus, their force response to the same strain or overlap is lower.
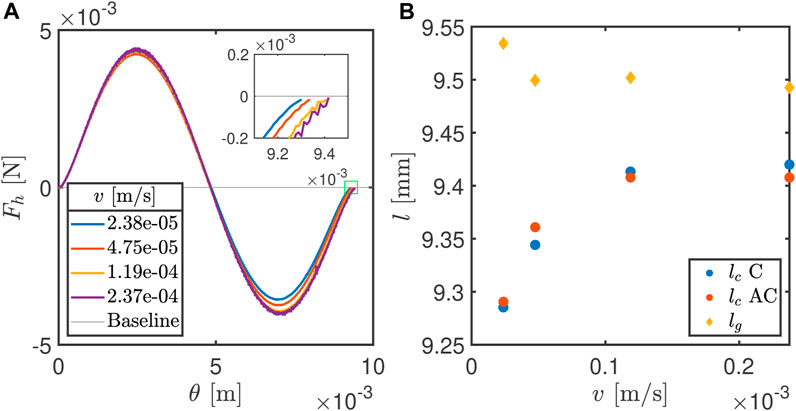
Figure 4. (A) Main: horizontal force (Fh) response at a constant maximum overlap (δmax = 0.78 mm, mean particle diameters of 19.1 and 18.4 mm, and maximum strain (ϵmax)=0.0208) but at different velocities (v)m/s in the clockwise direction; inset: force response toward the end of the geometric contact length (the original area is highlighted in green); (B) change in contact lengths (l [mm]) as a function of rotational velocity (vm/s), where the geometric contact length is lg (in yellow) and deformed contact length is lc, and the directions are specified as C (clockwise) and AC (anticlockwise) at a constant maximum overlap (δmax = 0.78 mm).
Another feature of interest can be seen at the very end of the contact. The force response just before the two particles detach is highlighted in the inset in Figure 4A. Here, we see that even though all of these tests were performed on the same set of particles, the points of detachment at different velocities do not coincide. The particle seems to detach earlier when the particles move slower relative to each other. This is also consistent with the model explained in Eq. 4. In Figure 4B, we plot the geometric contact length (lg) and deformed contact length (lc) obtained at the different sliding speeds (v) at which the experiments were performed. Here, we clearly see that the variation in lg at different speeds is much lower than the variation in lc. Furthermore, we see that lc seems to grow at larger sliding speeds and approaches lg. This trend is consistent when the experiment is performed in either direction, as can also be seen in Figure 4.
Figure 5 describes how the forces from the model described in Section 3 are vectorially resolved so that they can be compared to the data observed in the experiment. The two-dimensional analytical model consists of measuring the effective overlap of two circles moving past each other. The upper circle is moving from left to right at a velocity v, and the lower circle is fixed. Figure 5A shows the geometric quantities involved in calculating the total forces in the horizontal and vertical directions at contact. At contact, the distance between the particle centers is R1 + R2. δmax is the maximum overlap between the particles. Thus, the vertical distance between the particle centers is R1 + R2 − δmax. β is the angle between the horizontal plane and the line joining the two particle centers and can be calculated using the triangle shown in Figure 5A. ψ is the horizontal distance between the particle centers, which can also be calculated from the same figure at the moment of contact ψ = ψ0. At this moment (at t = 0), the overlap (δ) is zero. After this moment, t grows from 0 and ψ = ψ0 − vt. The vertical distance between the particle centers remains R1 + R2 − δmax, and a new distance between particle centers can be calculated as
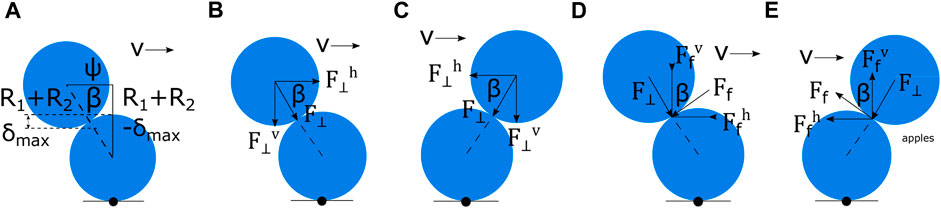
Figure 5. Resolution of force components. (A) Determination of the angle between horizontal and center-to-center force vectors (β). (B) Resolution of elastic and dissipative forces (acting between particle centers), as the moving particle approaches the stationary particle. (C) Resolution of elastic and dissipative forces (acting between particle centers), as the moving particle moves away from the stationary particle. (D) Resolution of friction forces (acting tangentially), as the moving particle approaches the stationary particle. (E) Resolution of friction forces (acting tangentially), as the moving particle moves away from the stationary particle.
These geometric quantities are then used to calculate the F⊥(t) values using the equations described in Section 3. The values of the shear moduli Ge and Gl and timescale τ were manually fit to the experimental vertical and horizontal forces independently. The values reported here are the ones that fit the experimental vertical and horizontal forces best at all the velocities and overlaps explored in this work. Figure 5B shows the vector resolution of F⊥ into its horizontal component
Figure 5D shows the vector resolution of Ff, which is the frictional force between the circles calculated using Eq. 10 into its horizontal component
Figure 6 describes how each element of the model adds up to explain the various features we see in the experiment. Figure 6A simply shows the sine-like change in Fh as a function of the linear angular displacement (θ = angular displacement [rad]× moment arm 0.027 [m]) after the vector resolution of the elastic force with changing β and overlap δ. In Figure 6B, we add the viscoelastic response from Jian’s model described in Section 3.2 to introduce the velocity dependence we observe in Section 4.1.1. However, using the model as is induces an adhesive force toward the end of the contact. This does not match our experimental results, as we see no adhesion. Thus, the cutoff described in Section 3.2 is implemented so as to remove any adhesive forces. This gives us both a velocity-dependent force response and a velocity-dependent contact length lc. Here, it is interesting to note that the velocity-dependent lc results as a by-product of the integration scheme and adhesion cutoff. The model itself still assumes that the overlap between the particles is positive in this region and that the rate of change of overlap is negative. Therefore, switching to a different viscous force law cannot give us a zero force response when both the overlap (δ) and the rate of change of overlap
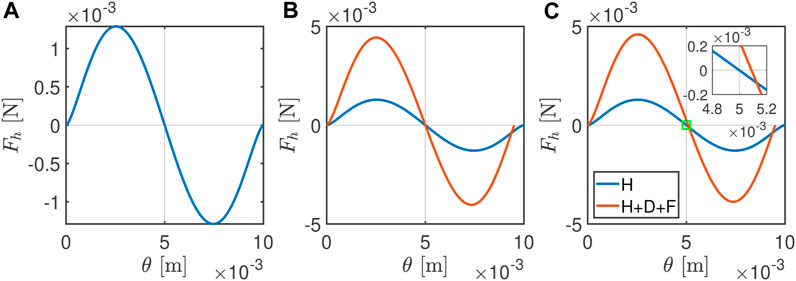
Figure 6. Fh responses from the model after vector resolution from (A) the elastic Hertz model (H) alone and (B) the elastic model (H) added to the Jian’s dissipative model (D), with the cutoff eliminating adhesive forces implemented in it. (C) Elastic (H) and dissipative (D) force responses coupled to the Coulomb’s friction model (F). Here, the coefficient of friction (μ) used is 5×10⁻³.
Figure 7A shows the horizontal force response of five inter-particle shear tests carried out in incremental amounts of maximum overlap (δmax) at a sliding speed of 2.38 × 10⁻⁵ m/s in the clockwise direction. Similar data were also measured for sliding speeds for all four speed levels and in the anticlockwise direction, as in the previous experiments. In this figure, we see that both the contact lengths and the amplitude of horizontal force responses grow as a function of maximum overlap. It is also notable to see that the point where the sign of the amplitude flips for all velocities almost coincides. This shows that the particles did not appreciably move in the horizontal direction between these experiments: the shell and collar hold the particles firmly in place.
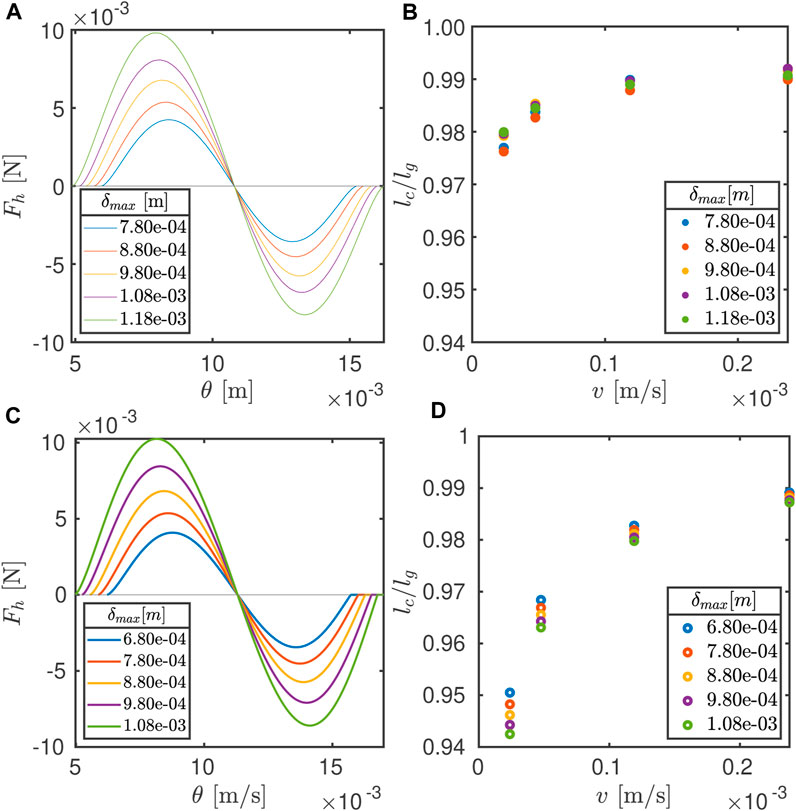
Figure 7. Results from the experiment: (A) horizontal force (Fh) response at different maximum overlaps (δmaxm) at the sliding speed (v)=2.38×10⁻⁵ m/s in the clockwise direction vs. the distance at which this force was observed from the reference point; (B) change in the ratio of the deformed contact length (lc) and geometric contact length (lg) as a function of sliding velocities (v) for experiments done on the same particle pairs at different maximum overlaps (δmax); results from the numerics. (C) Horizontal force (Fh) response at different maximum overlaps (δmaxm) at the sliding speed (v) = 2.38 × 10⁻⁵ m/s in the clockwise direction vs. the distance at which this force was observed from the reference point; (D) change in the ratio of the deformed contact length (lc) and geometric contact length (lg) as a function of sliding velocities (v) for experiments done on the same particle pairs at different maximum overlaps (δmaxm).
The results obtained in Figure 7A by themselves are expected, as the force response increases when the overlap or strain between two particles is increased. However, given that the geometric contact length and actual length are different and velocity-dependent, as shown in Figure 4B, the results of how these might scale with an increase in overlap are interesting. Since the contact lengths obviously must scale with the overlap, a direct comparison is difficult. Thus, we normalize lc by lg (since lg is a geometrical parameter that scales with particle radii and δmax). Thus,
The results seen in the experiments can also be qualitatively reproduced using the model described in Section 3, as can be seen in Figures 7C, D. These figures can be compared directly to the experimental results in Figures 7A, B, respectively. However, since the particles used in this experiment are not perfectly round, there are deviations in the radii of particles and maximum overlap used in the experiment and model. These are clearly visible from the difference in overlaps shown in the experimental results and the results from the model. The parameters for obtaining these results were G0 = 0.4 × 10⁴ Pa, Gl = 5 × G0, and τ = 2000 s.
Figure 8A shows the vertical component of the force between the particles as a function of probe displacement for a sliding spherical hydrogel at the same maximum experimental overlap. From this figure, we see that the normal force responses for the different sliding velocities at a constant overlap are slightly velocity-dependent. However, the velocity dependence is difficult to distinguish because of the noise level in the normal force data. The determination of lg is similarly affected by the noise and is hence not shown.
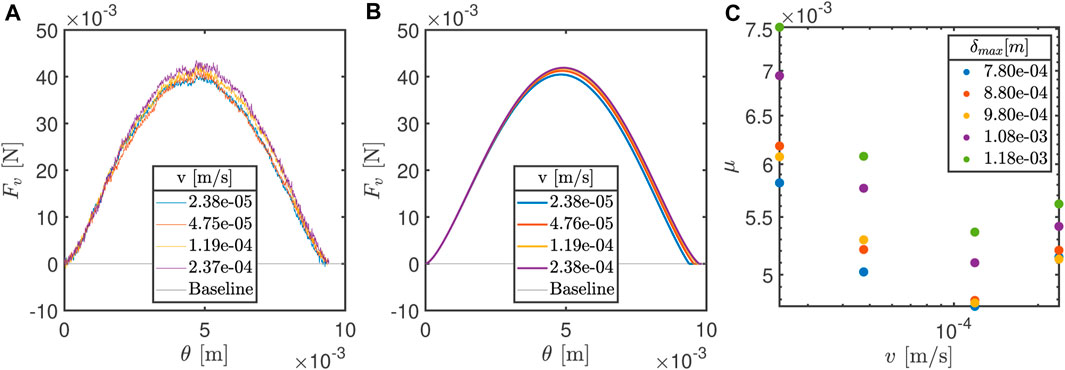
Figure 8. Vertical component of forces (Fv) during a shear experiment at different sliding velocities (v) in (A) the experiment and (B) the model. (C) Variation in coefficients of friction (μ) as a function of sliding velocity (v) for different overlaps.
Figure 8B shows the numerically obtained vertical component of the forces using the combination of models described in Section 3 and is able to reproduce similar velocity-dependent trends, as shown by the experimental data in Figure 8A. The parameters used to obtain these results were G0 = 0.4 × 10⁴ Pa, Gl = 4 × G0, and τ = 2000 s. The values of G0, Gl, and τ are obtained from a manual fit procedure to best match the experimental results shown in Figure 8A. Here, Gl for the vertical force component that resulted in the best amplitude match to the experimental results was 4/5th of Gl for the horizontal force components. We believe that this anisotropy in Gl in the horizontal and vertical force components is due to the difference in geometrical constraints in the two force directions. This is because when the upper particle slides over the fixed particle, the horizontal component of the compressive forces will make the hydrogels expand in the vertical direction, which is possible because the top of the gels are largely unrestrained. Similarly, the vertical component of the compressive force will try to make the hydrogels expand in the lateral direction. This will not be possible because the gel is restrained by the shell and collar assembly, creating confinement. This induces a confining stress that limits the viscous response of the hydrogels.
Additionally, we can extract the horizontal forces at the center of the geometric contact length (lg) shown in Figure 3B and the vertical forces at the center of the geometric contact length (lg) by fitting a second-degree polynomial to 20 data points left and right of the center of (lg). The ratio of these forces gives us a way to calculate the coefficient of friction (μ) at the point where we know the overlap (δ) and where the vertical and horizontal forces theoretically align with the normal and tangential components of forces. Figure 8C plots μ obtained against the sliding velocities for the different overlaps tested. While a master curve is not obtained, the plot shows how μ changes at different velocities. This is reasonable because all the tests shown in this study consist of lubricated contacts, as the hydrogels used make underwater contact and are also poroelastic. The frictional force in lubricated contacts can be a function of normal load, viscosity, and velocity in contacts, as already experimentally shown by Stribeck [19]. A more complete treatment of the hydrogel–hydrogel friction is outside the scope of this work but can be found in other works, e.g., Gong [20], Pitenis et al. [21], and Workamp and Dijksman [13].
Section 4.1 establishes a timescale for the force response in the tangential and center-to-center directions during a rearrangement event. In this section, we show that a similar force response can be found when the particle is under a fixed level of vertical compressive strain. We already see that the vertical force response decays in time during the sliding test in Figure 2C. We use the vertical force evolution with a time dataset similar to Figure 2C at a constant δ and back-calculate the elastic moduli of the material at each time step using Eqs 5–8 (assuming a linear elastic model). Thus, we get a shear modulus G at each time step. Figure 9A shows results for this shear modulus (G) as a function of time for a particle that is compressed between two flat plates. Figure 9B plots the extracted shear modulus (G) as a function of time (t) when the same hydrogel sphere is placed in the custom 3D-printed geometry described in Section 2.1 that was also used for the inter-particle shear experiments. As can be seen by comparing Figures 9A, B, this leads to a difference in the calculated G values, even though the sphere being tested is the same. For the experiments in which the hydrogel sphere is confined to the 3D-printed geometry, we interpret the difference as arising from the fact that the sphere could not extend laterally and had a larger contact with the 3D-printed geometry.
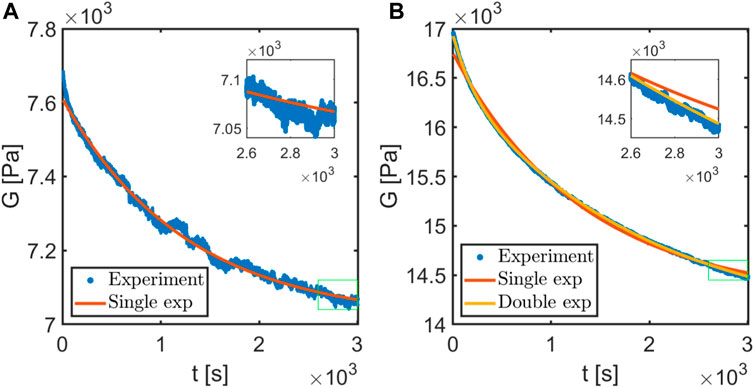
Figure 9. (A) Decay in elastic moduli vs. time when the hydrogel is compressed between two plates: blue points are the calculated elastic moduli assuming perfect Hertzian contact and their supposed evolution with time; the red line is fit with Eq. 4 (in red); inset: force response toward the end of the relaxation experiment. (B) Decay in elastic moduli vs. time when the hydrogel is placed in a 3D-printed shell described in Section 2.1 and compressed using a plate: blue points are the calculated elastic moduli assuming perfect Hertzian contact and their supposed evolution with time; inset: force response toward the end of the relaxation experiment; the red line is fit with Eq. 4 (in red); and the yellow line is an additional fit with a second exponential time to better account for the systematic deviation from the single-exponent fit at the beginning and end of the experiment that is more obviously visible in the inset.
The back-calculated shear modulus G vs. time t plots in Figure 9 are then fitted to a decaying exponential function shown in Eq. 4. These fits are shown in red. For Figure 9A, this results in a Ge of 7,146 Pa, a Gl of 630 Pa, and a τ of 1,413 s. In Figure 9B, for a hydrogel sphere placed in a 3D-printed custom geometry compressed by a flat plate, we see that a single timescale is inadequate to capture the response. The single-exponent fit described by Eq. 4 deviates from the data both at the start and end of the dataset. Thus, a second exponent was added to Eq. 4 to fit the entire data series, changing it to
Our results show that contact mechanics between soft, almost frictionless grains, even in a single contact, are affected by a combination of the grain’s volumetric and surface properties and its geometry. Both the inter-particle shear tests and the plate–plate compression tests reveal that there is a long relaxation timescale. We believe the timescale to be associated with the grain material property. The second, faster timescale seen in the plate–plate compression tests is not explored in the work here, as the shear experiments were done at a very slow speed, making the short relaxation mode unobservable in the sliding force dynamics. It must also be noted that the velocity and overlap ranges explored in this experiment are limited, which means that more timescales and potentially a whole spectrum of modes are potentially present in the hydrogel (contact) mechanics, as can be observed in other studies Malkin and Masalova [22]; Xu et al. [23]. The relaxation already observed may be playing a role in the observed slow (creep) dynamics in soft particle packings: slow contact force evolution affects force balance and can therefore induce particle motion Dijksman and Mullin [24].
We constructed a custom rheometric tool to measure the contact forces between two submersed hydrogels sliding past each other at different overlap amplitudes and different sliding velocities. We also measure the compressive force response of single-hydrogel beads. We use Jian et al. [16]’s dissipative model to rationalize the observations on center-to-center forces between particles during shear and couple them with tangential forces using simple Coulomb friction. We are also able to describe our experimental observations with five parameters: the constant elastic part of the modulus, the maximum relaxable part of the shear modulus, a single relaxation time, a Poisson’s ratio, and a coefficient of friction. By qualitatively matching the data from the model to those of the experiments, we can show that these five constants can describe forces evolving in both center-to-center and tangential directions. Our results establish a time-dependent contact dynamics framework for single-hydrogel particle contacts that lets the material properties of the contacting particles evolve from the moment of contact. The results of our experimental work and numerical validation show that in (numerical and theoretical) soft particle contact mechanics, not only the particle position dynamics should be taken into account in the evolution of the contact forces and the network structure but also the relaxation effects of the bulk material out of which the particles are composed. Further work will concentrate on how these moduli propagate into bulk properties. We will also investigate whether the framework described above can indeed be used to obtain a microscopic understanding of properties such as creep in hydrogel packings, as observed by Dijksman and Mullin [24].
The original contributions presented in the study are publicly available. This data can be found here: https://zenodo.org/records/10824828.
CS: writing–review and editing, writing–original draft, visualization, validation, software, methodology, investigation, formal analysis, and data curation. JvG: writing–review and editing, supervision, software, resources, and methodology. JD: writing–review and editing, supervision, resources, project administration, and funding acquisition.
The author(s) declare that financial support was received for the research, authorship, and/or publication of this article. This project has received funding from the European Union’s Horizon 2020 Research and Innovation Programme under the Marie Skłodowska-Curie grant agreement number 812638.
The authors would like to acknowledge the efforts of the team at PCC at Wageningen University. In particular, they thank their technicians, Raoul Fix and Remco Fokkink, without whom the setups on which these experiments were done could not be built. They would like to thank their colleagues Jose Ruiz Franco and Lawrence Honaker for their helpful insights regarding this project. They would also like to thank the team at TU Graz and DCS, including but not limited to Stefan Radl, Fransisco Goio Castro, and Michael Mascara, for the lively discussions on this topic. They would also like to thank Gustavo Pinzon from Laboratoire 3SR, Grenoble, for pointing to older literature for similar works done in this sector with non-deformable particles. The authors extend their special thanks to Brian Tighe for guiding them in this research direction.
The authors declare that the research was conducted in the absence of commercial or financial relationships that could be construed as a potential conflict of interest.
The author(s) declared that they were an editorial board member of Frontiers, at the time of submission. This had no impact on the peer review process and the final decision
All claims expressed in this article are solely those of the authors and do not necessarily represent those of their affiliated organizations, or those of the publisher, the editors, and the reviewers. Any product that may be evaluated in this article, or claim that may be made by its manufacturer, is not guaranteed or endorsed by the publisher.
The Supplementary Material for this article can be found online at: https://www.frontiersin.org/articles/10.3389/fphy.2024.1334325/full#supplementary-material
2. Cárdenas-Barrantes M, Cantor D, Barés J, Renouf M, Azéma E. Compaction of mixtures of rigid and highly deformable particles: a micromechanical model. Phys Rev E (2020) 102:032904. doi:10.1103/physreve.102.032904
3. van der Vaart K, Rahmani Y, Zargar R, Hu Z, Bonn D, Schall P. Rheology of concentrated soft and hard-sphere suspensions. J Rheology (2013) 57:1195–209. doi:10.1122/1.4808054
4. Campbell CS. Granular material flows–an overview. Powder Tech (2006) 162:208–29. doi:10.1016/j.powtec.2005.12.008
5. Andò E, Dijkstra J, Roubin E, Dano C, Boller E. A peek into the origin of creep in sand. Granular matter (2019) 21:11–8. doi:10.1007/s10035-018-0863-5
6. Vandamme M, Ulm F-J. Nanogranular origin of concrete creep. Proc Natl Acad Sci (2009) 106:10552–7. doi:10.1073/pnas.0901033106
7. Lade PV, Liu C-T. Experimental study of drained creep behavior of sand. J Eng Mech (1998) 124:912–20. doi:10.1061/(asce)0733-9399(1998)124:8(912)
8. Leung C, Lee F, Yet N. The role of particle breakage in pile creep in sand. Can Geotechnical J (1997) 33:888–98. doi:10.1139/t96-119
9. Nardelli V, Coop MR. The experimental contact behaviour of natural sands: normal and tangential loading. Géotechnique (2019) 69:672–86. doi:10.1680/jgeot.17.p.167
10. Tsai C-E, Tsai J-C. Force between contacting pdms surfaces upon steady sliding: speed dependence and fluctuations (2020). arXiv preprint arXiv:2010.07907 Available at: https://arxiv.org/abs/2010.07907 (Accessed August 3 2023).
11. Giustiniani A, Weis S, Poulard C, Kamm PH, García-Moreno F, Schröter M, et al. Skinny emulsions take on granular matter. Soft Matter (2018) 14:7310–23. doi:10.1039/c8sm00830b
12. Louf J-F, Datta SS. Poroelastic shape relaxation of hydrogel particles. Soft matter (2021) 17:3840–7. doi:10.1039/d0sm02243h
13. Workamp M, Dijksman JA. Contact tribology also affects the slow flow behavior of granular emulsions. J Rheology (2019) 63:275–83. doi:10.1122/1.5066438
14. Rudge RE, Scholten E, Dijksman JA. Natural and induced surface roughness determine frictional regimes in hydrogel pairs. Tribology Int (2020) 141:105903. doi:10.1016/j.triboint.2019.105903
15. Boots J, Fokkink R, Van der Gucht J, Kodger T. Development of a multi-position indentation setup: mapping soft and patternable heterogeneously crosslinked polymer networks. Rev Scientific Instr (2019) 90:015108. doi:10.1063/1.5043628
16. Jian B, Hu G, Fang Z, Zhou H, Xia R. A normal contact force approach for viscoelastic spheres of the same material. Powder Tech (2019) 350:51–61. doi:10.1016/j.powtec.2019.03.034
17. Brilliantov NV, Pimenova AV, Goldobin DS. A dissipative force between colliding viscoelastic bodies: rigorous approach. Europhysics Lett (2015) 109:14005. doi:10.1209/0295-5075/109/14005
18. Schulze KD, Hart SM, Marshall SL, O’Bryan CS, Urueña JM, Pitenis AA, et al. Polymer osmotic pressure in hydrogel contact mechanics. Biotribology (2017) 11:3–7. doi:10.1016/j.biotri.2017.03.004
20. Gong JP. Friction and lubrication of hydrogels—its richness and complexity. Soft matter (2006) 2:544–52. doi:10.1039/b603209p
21. Pitenis A, Urueña J, Schulze K, Nixon R, Dunn A, Krick B, et al. Polymer fluctuation lubrication in hydrogel gemini interfaces. Soft Matter (2014) 10:8955–62. doi:10.1039/c4sm01728e
22. Malkin AY, Masalova I. From dynamic modulus via different relaxation spectra to relaxation and creep functions. Rheologica acta (2001) 40:261–71. doi:10.1007/s003970000128
23. Xu B, Li H, Zhang Y. Understanding the viscoelastic behavior of collagen matrices through relaxation time distribution spectrum. Biomatter (2013) 3:e24651. doi:10.4161/biom.24651
Keywords: soft matter, granular mechanics, contact mechanics, hydrogel particles, viscoelasticity
Citation: Shakya C, van der Gucht J and Dijksman JA (2024) Viscoelastic material properties determine the contact mechanics of hydrogel spheres. Front. Phys. 12:1334325. doi: 10.3389/fphy.2024.1334325
Received: 06 November 2023; Accepted: 26 February 2024;
Published: 25 March 2024.
Edited by:
Stefan Luding, University of Twente, NetherlandsReviewed by:
Antonio Papangelo, Politecnico di Bari, ItalyCopyright © 2024 Shakya, van der Gucht and Dijksman. This is an open-access article distributed under the terms of the Creative Commons Attribution License (CC BY). The use, distribution or reproduction in other forums is permitted, provided the original author(s) and the copyright owner(s) are credited and that the original publication in this journal is cited, in accordance with accepted academic practice. No use, distribution or reproduction is permitted which does not comply with these terms.
*Correspondence: Chandan Shakya, Yy5zaGFreWFAdXZhLm5s; Joshua A. Dijksman, ai5hLmRpamtzbWFuQHV2YS5ubA==
Disclaimer: All claims expressed in this article are solely those of the authors and do not necessarily represent those of their affiliated organizations, or those of the publisher, the editors and the reviewers. Any product that may be evaluated in this article or claim that may be made by its manufacturer is not guaranteed or endorsed by the publisher.
Research integrity at Frontiers
Learn more about the work of our research integrity team to safeguard the quality of each article we publish.