 Gustavo A. Grinspan
 Liliam Fernandes De Oliveira
 Maria Clara Brandao
 Nicolás Benech
95% of researchers rate our articles as excellent or good
Learn more about the work of our research integrity team to safeguard the quality of each article we publish.
Find out more
ORIGINAL RESEARCH article
Front. Phys. , 07 February 2024
Sec. Medical Physics and Imaging
Volume 12 - 2024 | https://doi.org/10.3389/fphy.2024.1329296
This article is part of the Research Topic Pushing The Physical Limits Of Wave Propagation In Soft Tissues: An Add-On To Shear Wave Elastography View all 7 articles
Introduction: In recent years, elastography has become a widely accepted methodology to assess the longitudinal shear elastic modulus of skeletal muscle. Ultrasound shear wave elastography is the gold standard used for such a purpose. However, its low sample rate (1–2 Hz) and the impossibility of being used in several muscles simultaneously limit potential biomechanical applications. In this work, we overcome such limitations by using a surface wave elastography method (NU-SWE).
Methods: The NU-SWE comprises a wearable device suitable for measuring several muscles simultaneously. Elasticity can be measured at high-frequency rates (∼15 Hz), by propagating several pulse trains of low-frequency (∼100 Hz) superficial waves separated by a short time interval. These pulses propagate along the medium surface and are recorded by a linear array of vibration sensors placed on the skin of each measured muscle. In this context, this work carried out a proof of concept, showing how NU-SWE enables performing experimental protocols previously impracticable with ultrasound elastography. Thus, we measured the longitudinal shear elasticity of the biceps brachii and brachioradialis muscles simultaneously at 15 Hz during isometric elbow flexions exerted at different torque development rates. Furthermore, for comparison, we measured the electromyographic activity of both muscles.
Results: Our results show that the maximum elasticity reached by the brachioradialis increases with contraction rate, while the biceps brachii behaves inversely.
Discussion: This study provides new insights concerning muscle synergism, evidenced by changes in muscle elasticity during torque production. More generally, it shows that NU-SWE could help widen elastography-driven research in biomechanics.
Soft biological tissues are typical examples of soft solids. Their shear elastic modulus (
Elastography has been initially employed as a complementary tool for the medical diagnosis of different diseases associated with the change of soft tissue elasticity, such as liver fibrosis and breast tumors [2–5]. The shear wave elastography (SWE) methods, such as transient elastography (TE) and supersonic shear imaging (SSI), have been the gold standard methodology for such a purpose [6, 7]. The SSI is based on the TE technology but replaces the external vibrator with acoustic radiation pressure to excite shear wave propagation. Recently, SWE methods have also begun to be adopted as the reference methodology to assess skeletal muscle elasticity in vivo. This has provided a novel way to measure the change in the mechanical properties of such tissue, thus driving a new approach in the studies on muscle biomechanics. In this sense, previous works have addressed complex biomechanical problems by using SWE, such as the relation of muscle shear elasticity with joint angle, contraction intensity, and electromyography (EMG) activity level [8–16]. Other works have used SWE methods to characterize, both in normal and fatiguing conditions, the load sharing, force production, and the dynamics of muscle contraction of the synergistic muscles by measuring the change in its shear elastic modulus [9, 13, 17–19]. Likewise, SWE has also been applied to assess differences in passive muscle shear elasticity after a force training program of trained vs non-trained subjects, the passive behavior of individual muscles in different stretching positions, and regional differences in muscle elasticity after eccentric exercise [20–23]. On the other hand, the application of SWE in skeletal muscle is also being considered for its clinical use in sports medicine [24]. The main advantages of the SWE methods are that they combine high-frequency ultrasonic waves (within the order of MHz) with low-frequency waves (100–1,000 Hz). As ultrasound imaging utilizes pulsed waves of several MHz of central frequency, their wavelength in tissues (assuming the sound speed is 1,500 m/s) is sub-millimeter-sized. The spatial resolution of the imaging system is limited by diffraction to the order of the wavelength. Therefore, using high frequencies (MHz) allows for high spatial resolution. On the other hand, the elasticity contrast in the image is not necessarily related to the acoustic impedance but to Young’s modulus of the material. Low-frequency waves are sensitive to changes in Young’s modulus since they propagate mainly as shear waves. In this way, SWE methods exhibit high spatial resolution (<1 mm) and good contrast in the characterization of shear elastic modulus [25]. However, the proper application of SWE methods for biomechanical research needs some infrastructure, such as those found in a clinic or laboratory. Furthermore, its relatively high cost is a limiting factor for clinics and laboratories having low resources.
As an alternative to the SWE, other elastography methods based exclusively on low-frequency (∼100 Hz) surface waves propagation have recently emerged [26–31]. By eliminating ultrasound frequencies, the spatial information is lost, so it is not possible to construct an elastic map of the medium. However, the information regarding the elasticity is preserved, so a numerical value about the mean elasticity of the tissue in a region of interest (ROI) can be obtained. In general terms, these methods record the velocity of the surface waves by measuring the surface wave propagation using either laser vibrometry or contact sensors. Some authors assume a Rayleigh wave model for the surface waves [32]. In this case, the measured velocity has a simple relation to the shear elastic modulus of the medium. However, since typical values of shear wave velocity in muscles at rest range between 2–4 m/s, If the excitation frequency is 100 Hz, the shear wavelength is between 2 and 4 cm. This value is of the same order of the muscle depth. Therefore, the muscle cannot be assumed as a semi-infinite but a bounded one, so guided wave propagation takes place. In order to retrieve the correct value for the shear wave velocity, a guided wave propagation model is needed. Besides, the wavefield is usually measured in the near-field of the source. Those combined effects introduce biases in the estimation of the shear elastic modulus [33]. In this regard, Benech et al. [34] developed a non-ultrasonic surface wave elastography (NU-SWE) method by designing new algorithms that correct the incidence of such effects on the elasticity estimates. This method has the advantages of being small, portable, low-cost, and easy to manipulate. Their first application in skeletal muscle was made by Grinspan et al. [25], who assessed the relationship between the change in muscle elasticity, joint torque, and the EMG activity level. This work showed analogous results to those obtained with SWE, thus showing the potential utility of the NU-SWE for biomechanical research.
SWE devices for clinical use have a sampling rate between 1 and 2 Hz. Due to this, experimental protocols must consider slow and controlled long-time tasks (for example, 20–30 s) to obtain enough data and perform a proper analysis. Thus, for example, it is currently not possible to assess the change in muscle elasticity for different contraction rates, as is possible for other related variables such as EMG activity. On the other hand, surface wave methods do not need to retrieve the low-frequency field from speckle tracking algorithms, on which SWE methods are based for calculating the displacements [35, 36]. In addition, they do not measure bulk wave propagation but only the field at the surface of the muscle. Thus, it is possible to increase the sampling rate by sending several short pulses and storing the field for post-processing.
In this context, the present work shows an updated version of the NU-SWE elastography, which overcomes the previous limitations of elastographic methods for the biomechanical study of skeletal muscle. Specifically, this version of the NU-SWE comprises a free-hand device that can measure the shear elasticity without applying pressure on the medium (as with the US probe), in more than one muscle simultaneously and at a higher sample rate. Thus, we applied these new features of the method to characterize the change of the shear elasticity of the biceps brachii (BB) and brachioradialis (BR) muscles during the execution of isometric flexions of the elbow joint at different contraction velocities. We also measured the EMG activity of both muscles during such tasks. This allowed us to account for the temporal dependence regarding the relationship between the elastic and electric behavior of these muscles during their synergistic action, which are emergent properties derived from the new measurement capabilities of the updated NU-SWE method.
Seven healthy male volunteers participated in the study (age 25.70 ± 3.20 years, height 177.90 ± 6.28 cm, weight 85.0 ± 11.72 kg). They were informed about the methods, procedures, and the purpose of the study. All participants provided their written informed consent. The experimental design of the study was conducted according to the last version of the Helsinki statement and was approved by the Ethical Committee of the Faculty of Medicine (UdelaR, Uruguay, File No. 071140–001398–11).
A research isokinetic dynamometer (Biodex System 4; Biodex Medical, Shirley, NY) was used to measure the angle and torque production of the elbow joint. During the data collection, the volunteers were positioned with their right shoulder and elbow flexed at 90° and the forearm supinated. The elbow joint was aligned coaxially with the axis of the dynamometer (Figure 1).
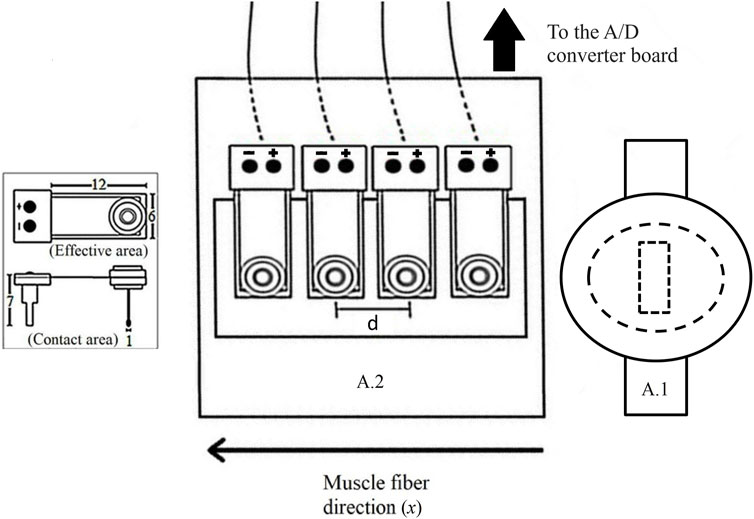
FIGURE 1. A: Scheme showing the relative arrangement of the wave source (A.1), the linear array of vibration sensors (A.2), and the muscle fibers' direction (x). The sensors are separated by a constant distance d = 8.0 mm and record the surface wave propagating in the x direction. The inset shows the dimensions of vibration sensors in mm.
The NU-SWE method consists of estimating the phase velocity of the low-amplitude and low-frequency surface waves (∼100 Hz), by exciting their propagation at the free surface of the muscle and recording it through equally spaced contact vibration sensors (Measurement Specialities, MINISENSE 100NM, Figure 2). Thus, the shear wave velocity is obtained, and the shear elastic modulus can be calculated from it.
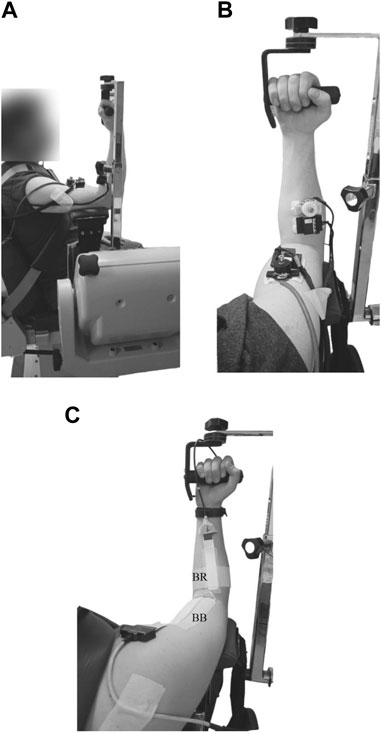
FIGURE 2. Examples of experimental setup for the elastography and electromyography measurements. The placement of the NU-SWE device (A,B) and the EMGs electrode arrays (C) over the free surface of the biceps brachii (BB) and brachioradialis (BR) muscles are shown.
A detailed explanation about the basis of the NU-SWE method can be found in Benech et al. [33, 34] and Grinspan et al. [25]. Briefly, the measurement device is composed mainly of an external wave source and a linear array of four contact vibration sensors (Figure 1). Besides, an analog-to-digital (A/D) converter board (NI-USB 6009; National Instruments), an audio amplifier (needed to record the surface waves with a good signal/noise ratio), and a computer complete the experimental setup. The external source vibrates normally to the free surface of the muscle by delivering a pulse train, each consisting of a few cycles of a sinusoid with a central frequency varying between 50–250 Hz (Figure 2B, Figure 3A). In this way, of the three spatial components, the vertical component of the surface wave velocity is mainly excited. Such a component is recorded by the linear array of sensors, each constituted by a piezoelectric PVDF flexible film with a mass and a small extension attached to it. The mass is added to change the frequency response of the sensors so as it is close to the one used in the experiments [33]. The extension is added so as the contact area of the sensors (∼1 mm2) is small enough to consider them as point sensors avoiding diffraction effects at the reception [26, 28]. According to this, the sensors are arranged on a plate that holds them on the medium surface in the correct configuration by adhesive patches, without needing external manipulation during the measurement. In this work, we placed two NU-SWE devices on the right upper extremity of the volunteers to simultaneously measure the elasticity of BB and BR muscles (Figures 2A, B). In the BB, the device was placed at 70% of the arm length distal to the acromion, while for the BR it was placed at 35% of the forearm length from the elbow. As the last step of the data acquisition, the vibration is captured sequentially by the sensors, digitized by the A/D converter board, and then transferred to a computer for processing.
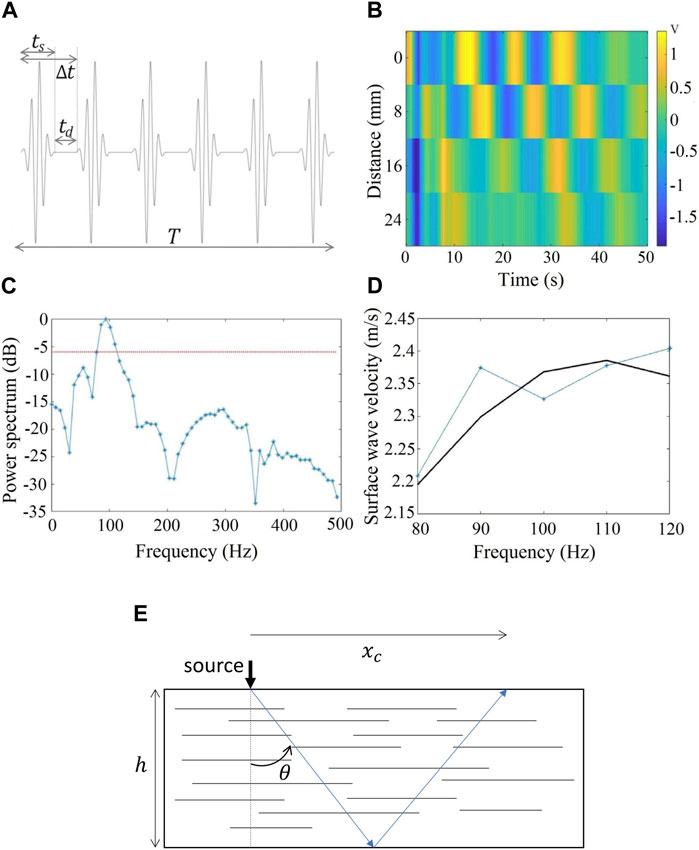
FIGURE 3. (A) Signal used to excite the source for surface wave generation. The sinusoidal pulse is repeated
The data processing of the NU-SWE involves the use of inversion algorithms designed to correct the incidence of the guided wave propagation and near-field effects [25, 33, 34]. Thus, the method is able to retrieve a reliable shear elasticity estimation of the muscle by computing an unbiased value of the shear wave velocity (
where
In order to be able to follow the elasticity changes in muscles during tasks (see Protocol), we used the excitation scheme displayed in Figure 3A. A 4-cycle sinusoidal pulse of 100 Hz central frequency is emitted. The sinusoidal pulse is modulated with a Gaussian function to minimize the transient behavior of the source at the start and the end of the signal [34]. The time duration of this signal
Figure 3B displays an example of the received signals in the four sensors for a single emitted pulse. The distance between sensors is 8.0 mm (Figure 1). A time delay is clearly observed between sensors, indicating a propagating wave. Figure 3C shows the power spectrum of the received signal. The center frequency is around 100 Hz as expected and its -6 dB bandwidth (red dotted line in the figure) spans from 80 to 115 Hz. To estimate the shear wave velocity (
where
If the surface wavefiled is measured at a distance
where
where
Therefore, the phase velocity is given by
where the prime indicates derivative with respect to
Adhesive arrays of sixteen, silver-bar electrodes (8 mm inter-electrode distance; Spes Medica, Battipaglia, Italy) were used to acquire surface EMGs from the biceps brachii, and adhesive arrays of eight, silver-bar electrodes (0.5 mm inter-electrode distance) for the brachioradialis. Firstly, for the BB, the proximal and distal muscle boundaries were identified using ultrasound equipment (2–10 MHz linear transducer; v.11 Supersonic Image, Aix-en-Provence, France). The eighth electrode of the 16 array was positioned at 50% of the length of the biceps brachii (Figure 2C). For the brachioradialis, the superior and inferior boundaries were identified using the same ultrasound equipment. The fourth electrode of the 8 array was positioned at 50% of the muscle length (Figure 2C).
The electrode-skin contact was ensured with conductive paste (AC cream, Spes Medica, Genova, Italy) and the reference electrode was positioned in the olecranon and radium styloid process. Data was collected in monopolar derivation and sampled at 2048 samples/s using a 12-bit A/D converter, with 5 V dynamic range. Furthermore, EMGs were amplified by a 2,000–10,000 variable factor using a 10–900 Hz bandwidth amplifier (CMRR >100 dB; EMG-USB2, OT Bioelettronica, Turin, Italy).
All monopolar EMGs were filtered with a 4th order, bandpass filter (Butterworth, 15–350 Hz cut-off frequencies). After that, the root mean square (RMS) value, with 250 m window size, was computed separately for each pair of electrodes, resulting in 15 differential channels for BB and 7 for BR.
Initially, the volunteers performed two maximal isometric voluntary elbow flexions (each lasting 5 s and resting 120 s between them) with the shoulder and elbow flexed at 90° to determine the maximal voluntary contraction (MVC) torque. The highest torque value was used to normalize submaximal contractions. Both for the EMG and the NU-SWE measurements, volunteers were asked to perform eight linear torque ramps (120 s rest between tasks) of isometric elbow flexion from 0%–40% of MVC over 5, 10, 15, and 20 s (twice each). In this way, depending on the task, the %MVC increased at a rate of 8, 4, 2.67, and 2 %MVC/s, respectively. Since there was not enough space for the NU-SWE device after placing the EMG electrode arrays on the surface of BB and BR muscles, the NU-SWE and the EMG measurements were performed in separate trials. This also avoided the possible contamination of the EMG signals by the surface vibration artifacts. In order to correctly execute the torque ramps, they had to follow the path indicated on a monitor put in front of them. The
Since the exploratory nature of the present study, we considered exclusively the peak values of the
To assess the intra-repeatability between both trials for each condition, we calculated the intraclass correlation coefficient (ICC) for each muscle from the peak values of
As is shown in Table 1, the ICC values obtained for BB and BR muscles denote good reproducibility between the peak
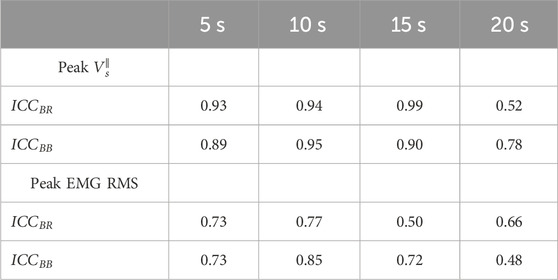
TABLE 1. ICC coefficients calculated from the peak
Figure 4 shows individual curves of
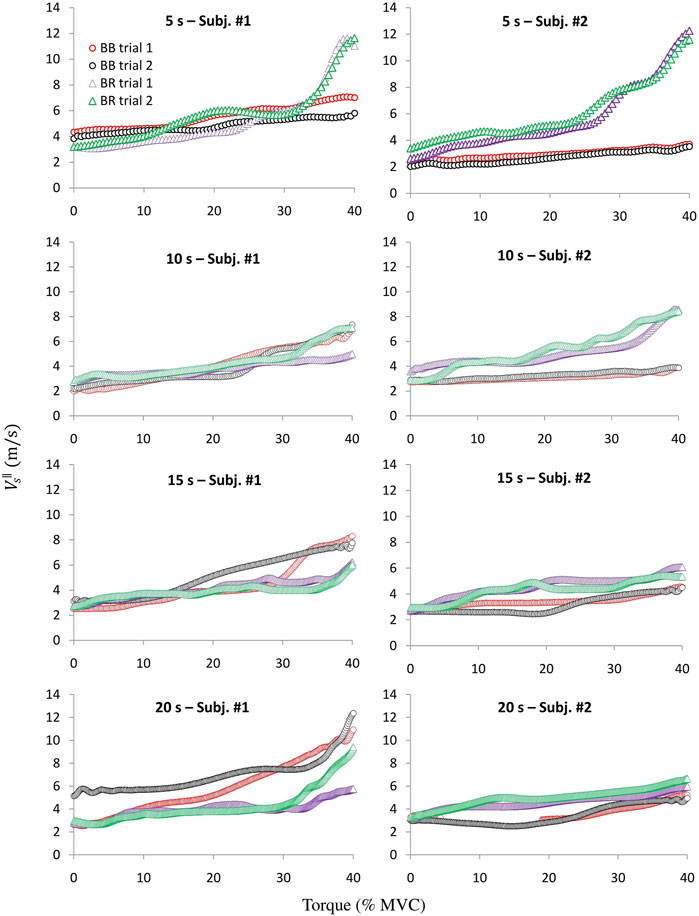
FIGURE 4. Two typical examples of the
Comparing the
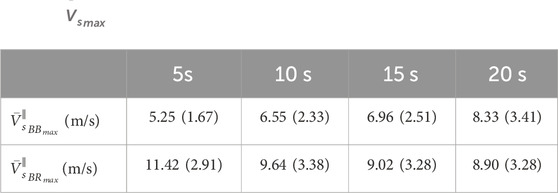
TABLE 2.
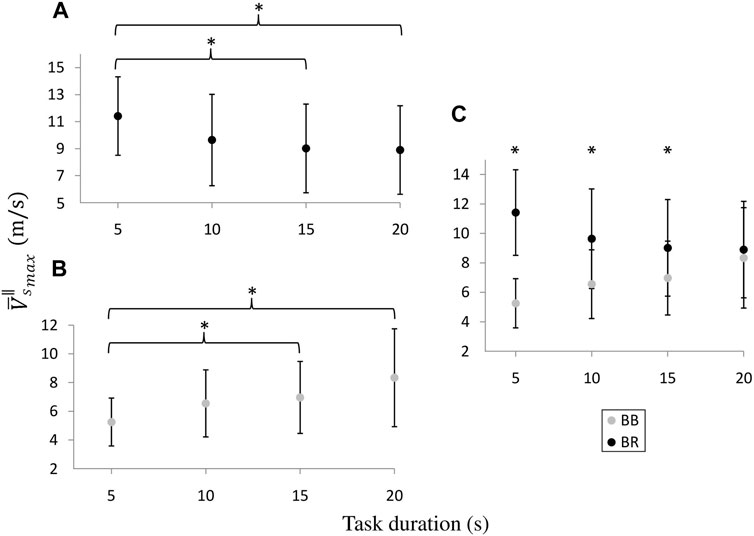
FIGURE 5. Intra (A,B) and inter-muscular (C) comparisons of the
The normalized
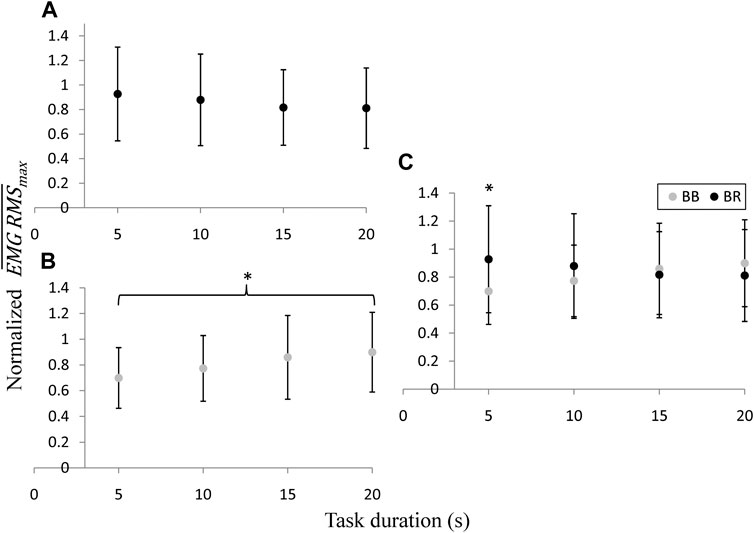
FIGURE 6. Intra (A,B) and inter-muscular (C) comparisons of the normalized
The purpose of this work was to show the performance of the updated version of the NU-SWE method and the novel measuring capabilities that arise from its new features. In this regard, the work showed that this method is able to measure muscle elasticity in experimental conditions that have been impracticable with the current ultrasonic and low-frequency elastographic methods. In this way, interesting mechanical properties of skeletal muscle emerged from using this version of the NU-SWE. Therefore, the results of the present study could be a first step in order to continue delving into the knowledge of muscle biomechanics based on the application of elastography.
The results of the isometric flexion ramps performed up to 40% MVC in 20 s are the most adequate to compare the results of the previous studies regarding the present work. In this task of our protocol, the contraction rate was 2% of MVC/s, being comparable to most of the biomechanical studies performed in skeletal muscle with others elastographic methods. In these conditions, different works have reported
The tasks performed in 5, 10 and 15 s correspond to rates of contraction of 8, 4% and 2.67% MVC/s, respectively. These rates are higher than those usually induced by the protocols that can be applied with SWE, which must be slow and controlled contractions due to their limited sample frequency (∼1–2 Hz). Particularly, the measurements of the present work were carried out at 15 Hz. No previous work has described muscle elasticity measurements at such a sampling frequency, either with surface wave elastography or shear wave elastography (SWE). In our previous work with NU-SWE, the highest sampling rate reached in the measurements was 1.4 Hz [25]. On the other hand, the sampling rates reported in the literature regarding the application of the SWE methods in skeletal muscle ranges between 1–2 Hz. The SWE method generates a “push" over most of the tissue using extended sonification times of approximately 200 μs each. The dimension of a typical region of interest (ROI) for imaging elasticity in muscles is 2–3 cm wide and 2–3 cm deep. Imaging this area requires several pushes, not less than 8 (4 in lateral dimension and at least 2 in-depth). Therefore, only the pulsation time lasts approximately 1 m. The duration of the ultrafast sequence to track the propagation of the shear wave depends on the depth of observation of the ROI, but the typical PRF is between 3 and 5 kHz, adding times on the order of 300 μs to each frame. If this information were to be stored in memory for offline processing, the theoretical sampling rate is on the order of 102 Hz. However, this theoretical limit cannot be reached in practice, as it would imply sending pushes every ∼0.01 s, which could seriously damage the transducer. Besides, in commercially available devices, the time required for memory transfer and online processing for real-time display eventually reduces the frame rate to values of 1–2 Hz. To our knowledge, there are no commercial SWE devices with elasticity frame rates higher than this, so the updated version of the NU-SWE represents a novel alternative in this regard.
The above allows performing protocols involving faster contractions, thus emerging novel muscular elastic behaviors as those described by our results. In this sense, our measurements showed, both at the individual and average level, a temporal dependence regarding the elastic behavior of the BB and BR muscles during the isometric flexion of the elbow joint. Such temporal dependence was manifested both at the inter-muscular and intra-muscular level, through the differences in the peak
As is depicted in Figure 6, the measurements of the EMG RMS showed the same behavior pattern as the elastography concerning the average peak activity as a function of the task duration, exhibiting a correlation factor of 0.96 and 0.95 for the BB and BR, respectively. While the normalized
All of the above indicates that mean elasticity measurements using surface waves add advantageous features in biomechanical research. The device used in this work is portable, low cost and easy to handle. It allows measuring on several muscles simultaneously and at a high sample rate. If a proper strategy for locating and positioning the wave source and sensors is followed, no significant errors in the results occur due to the placement of the device. This is supported by the repeatability analysis performed in our previous work with NU-SWE where, although the manipulation of the wave source during measurements could have introduced variation between measurements, it was not reflected in the results [25]. In this sense, the new configuration of the NU-SWE employed in this work overcame such a limitation, adding even more certainty regarding the reproducibility of the measurements. Concerning the relative alignment of the array of sensors and the fibers' orientation, it is important to highlight that, as the BB and BR are parallel and fusiform muscles, knowing their anatomical location on the arm is sufficient to identify the fiber orientation accurately. However, in pennate muscles, identifying the fibers' orientation before measurements by B-mode ultrasound and aligning the sensors accordingly, may be helpful to avoid biases related to wave propagation in more complex media.
Although in the present study, the selected sample rate was 15 Hz as it was considered adequate to characterize the contractions of the different tasks, this can be even higher by adjusting the
This work shows that surface wave elastography has some features that can potentially widen the spectrum of applications of elastography in skeletal muscle. Themethod used in this work (NU-SWE) can measure the elasticity of several muscles simultaneously and at a higher sample rate than previous surface wave methods and the classic SWE. In the present study we used these characteristics of the method to perform a proof of concept of an experimental protocol previously impracticable with elastography. We measured the elasticity changes of the BB and BR muscles simultaneously during the isometric flexion of the elbow joint at different contraction velocities. As a result, we found that the peak elasticity value for each muscle has a different behavior depending on the time required for the task. For short times, the peak value for BR is significantly higher than for BB. As the time of the task increases, these values approach each other. Such behavior was also observed at the level of the EMG activity of both muscles, indicating that the elastographic results correlate with other methods for characterizing muscle activity. Considering the above, the methodological advances presented in this work widen the applications of elastography in skeletal muscle in vivo to delve into the knowledge of muscle biomechanics.
The datasets presented in this study can be found in online repositories. The names of the repository/repositories and accession number(s) can be found in the article/Supplementary Material.
The studies involving humans were approved by the Ethical Committee of the Faculty of Medicine (UdelaR, Uruguay). The studies were conducted in accordance with the local legislation and institutional requirements. The participants provided their written informed consent to participate in this study. Written informed consent was obtained from the individual(s) for the publication of any potentially identifiable images or data included in this article.
GG: Conceptualization, Formal Analysis, Investigation, Methodology, Resources, Validation, Visualization, Writing–original draft. LO: Investigation, Methodology, Resources, Writing–review and editing. MB: Investigation, Methodology, Resources, Writing–review and editing. NB: Conceptualization, Formal Analysis, Investigation, Methodology, Resources, Software, Validation, Writing–review and editing.
The author(s) declare financial support was received for the research, authorship, and/or publication of this article. This study was funded by CSIC-UdelaR (file No. 004010-000137-22) and CAP-UdelaR (file No. 004010-002174-19).
The authors thank PEDECIBA-Biología, PEDECIBA-Física, CAP-UdelaR, CSIC-UdelaR, as well as the volunteers who participated in the study.
The NU-SWE method presented in this article was included in a PCT patent application, presented by Universidad de la República (UdelaR) as patent applicant and assignee (inventors: NB, GG, Sofía Aguiar, Carlos Negreira). The PCT patent application has been granted in Brazil (PCT/BR2018/050395) and the United States (US 11,561,201 B2).
The remaining authors declare that the research was conducted in the absence of any commercial or financial relationships that could be construed as a potential conflict of interest.
All claims expressed in this article are solely those of the authors and do not necessarily represent those of their affiliated organizations, or those of the publisher, the editors and the reviewers. Any product that may be evaluated in this article, or claim that may be made by its manufacturer, is not guaranteed or endorsed by the publisher.
The Supplementary Material for this article can be found online at: https://www.frontiersin.org/articles/10.3389/fphy.2024.1329296/full#supplementary-material
1. Sarvazyan A. Shear acoustic properties of soft biological tissues in medical diagnostics. The J Acoust Soc America (1993) 93(4):2329–30. doi:10.1121/1.406353
2. Goddi A, Bonardi M, Alessi S. Breast elastography: a literature review. J Ultrasound (2012) 15(3):192–8. doi:10.1016/j.jus.2012.06.009
3. Castera L, Forns X, Alberti A. Non-invasive evaluation of liver fibrosis using transient elastography. J Hepatol (2008) 48(5):835–47. doi:10.1016/j.jhep.2008.02.008
4. Friedrich–Rust M, Ong MF, Martens S, Sarrazin C, Bojunga J, Zeuzem S, et al. Performance of transient elastography for the staging of liver fibrosis: a meta-analysis. Gastroenterology (2008) 134(4):960–74.e8. doi:10.1053/j.gastro.2008.01.034
5. Bercoff J, Chaffai S, Tanter M, Sandrin L, Catheline S, Fink M, et al. In vivo breast tumor detection using transient elastography. Ultrasound Med Biol (2003) 29(10):1387–96. doi:10.1016/s0301-5629(03)00978-5
6. Bercoff J, Tanter M, Fink M. Supersonic shear imaging: a new technique for soft tissue elasticity mapping. IEEE Trans Ultrason ferroelectrics, frequency Control (2004) 51(4):396–409. doi:10.1109/tuffc.2004.1295425
7. Catheline S, Wu F, Fink M. A solution to diffraction biases in sonoelasticity: the acoustic impulse technique. J Acoust Soc America (1999) 105(5):2941–50. doi:10.1121/1.426907
8. Ateş F, Hug F, Bouillard K, Jubeau M, Frappart T, Couade M, et al. Muscle shear elastic modulus is linearly related to muscle torque over the entire range of isometric contraction intensity. J Electromyogr Kinesiol (2015) 25(4):703–8. doi:10.1016/j.jelekin.2015.02.005
9. Bouillard K, Nordez A, Hug F. Estimation of individual muscle force using elastography. PloS one (2011) 6(12):e29261. doi:10.1371/journal.pone.0029261
10. Gennisson JL, Cornu C, Catheline S, Fink M, Portero P. Human muscle hardness assessment during incremental isometric contraction using transient elastography. J Biomech (2005) 38(7):1543–50. doi:10.1016/j.jbiomech.2004.07.013
11. Gennisson JL, Deffieux T, Macé E, Montaldo G, Fink M, Tanter M. Viscoelastic and anisotropic mechanical properties of in vivo muscle tissue assessed by supersonic shear imaging. Ultrasound Med Biol (2010) 36(5):789–801. doi:10.1016/j.ultrasmedbio.2010.02.013
12. Lapole T, Tindel J, Galy R, Nordez A. Contracting biceps brachii elastic properties can be reliably characterized using supersonic shear imaging. Eur J Appl Physiol (2015) 115:497–505. doi:10.1007/s00421-014-3037-0
13. Nordez A, Guével A, Casari P, Catheline S, Cornu C. Assessment of muscle hardness changes induced by a submaximal fatiguing isometric contraction. J Electromyogr Kinesiol (2009) 19(3):484–91. doi:10.1016/j.jelekin.2007.11.005
14. Nordez A, Hug F. Muscle shear elastic modulus measured using supersonic shear imaging is highly related to muscle activity level. J Appl Physiol (2010) 108(5):1389–94. doi:10.1152/japplphysiol.01323.2009
15. Yoshitake Y, Takai Y, Kanehisa H, Shinohara M. Muscle shear modulus measured with ultrasound shear-wave elastography across a wide range of contraction intensity. Muscle and nerve (2014) 50(1):103–13. doi:10.1002/mus.24104
16. Zimmer M, Kleiser B, Marquetand J, Ateş F. Shear wave elastography characterizes passive and active mechanical properties of biceps brachii muscle in vivo. J Mech Behav Biomed Mater (2023) 137:105543. doi:10.1016/j.jmbbm.2022.105543
17. Bouillard K, Hug F, Guével A, Nordez A. Shear elastic modulus can be used to estimate an index of individual muscle force during a submaximal isometric fatiguing contraction. J Appl Physiol (2012) 113(9):1353–61. doi:10.1152/japplphysiol.00858.2012
18. Bouillard K, Nordez A, Hodges PW, Cornu C, Hug F. Evidence of changes in load sharing during isometric elbow flexion with ramped torque. J Biomech (2012) 45(8):1424–9. doi:10.1016/j.jbiomech.2012.02.020
19. Grinspan GA, de Oliveira LF, Brandao MC, Pomi A, Benech N. Load sharing between synergistic muscles characterized by a ligand-binding approach and elastography. Scientific Rep (2023) 13:18267. doi:10.1038/s41598-023-45037-y
20. Lacourpaille L, Nordez A, Hug F, Couturier A, Dibie C, Guilhem G. Time-course effect of exercise-induced muscle damage on localized muscle mechanical properties assessed using elastography. Acta Physiol (2014) 211(1):135–46. doi:10.1111/apha.12272
21. Le Sant G, Ates F, Brasseur JL, Nordez A. Elastography study of hamstring behaviors during passive stretching. PloS one (2015) 10(9):e0139272. doi:10.1371/journal.pone.0139272
22. Mannarino P, Matta TT, Oliveira LF. An 8-week resistance training protocol is effective in adapting quadriceps but not patellar tendon shear modulus measured by Shear Wave Elastography. PLoS One (2019) 14(4):e0205782. doi:10.1371/journal.pone.0205782
23. Avrillon S, Lacourpaille L, Hug F, Le Sant G, Frey A, Nordez A, et al. Hamstring muscle elasticity differs in specialized high-performance athletes. Scand J Med Sci Sports (2020) 30(1):83–91. doi:10.1111/sms.13564
24. Creze M, Nordez A, Soubeyrand M, Rocher L, Maître X, Bellin MF. Shear wave sonoelastography of skeletal muscle: basic principles, biomechanical concepts, clinical applications, and future perspectives. Skeletal Radiol (2018) 47:457–71. doi:10.1007/s00256-017-2843-y
25. Grinspan GA, Cabral HV, de Souza LM, de Oliveira LF, Aguiar S, Blanco E, et al. Surface wave elastography is a reliable method to correlate muscle elasticity, torque, and electromyography activity level. Physiol Rep (2021) 9(15):e14955. doi:10.14814/phy2.14955
26. Benech N, Aguiar S, Grinspan GA, Brum J, Negreira C. In vivo assessment of muscle mechanical properties using a low-cost surface wave method. IEEE Int Ultrason Symp (2012) 2571–4. doi:10.1109/ULTSYM.2012.0644
27. Courage W. inventor; Courage, Khazaka Electronic GmbH, assignee. Measuring device for measuring the elastic properties of a surface structure. United States patent US (2003) 6619423.
28. Grinspan GA, Aguiar S, Benech N. Optimization of a surface wave elastography method through diffraction and guided waves effects characterization. J Phys Conf Ser (2016) 705(1):012014. doi:10.1088/1742-6596/705/1/012014
29. Sabra KG, Conti S, Roux P, Kuperman WA. Passive in vivo elastography from skeletal muscle noise. Appl Phys Lett. (2007) 90(19): 194101–3. doi:10.1063/1.2737358
30. Salman M, Sabra KG. Surface wave measurements using a single continuously scanning laser Doppler vibrometer: application to elastography. J Acoust Soc America (2013) 133(3):1245–54. doi:10.1121/1.4789929
31. Martin JA, Brandon SC, Keuler EM, Hermus JR, Ehlers AC, Segalman DJ, et al. Gauging force by tapping tendons. Nat Commun (2018) 9(1):1592. doi:10.1038/s41467-018-03797-6
32. Royston TJ, Dai Z, Chaunsali R, Liu Y, Peng Y, Magin RL. Estimating material viscoelastic properties based on surface wave measurements: a comparison of techniques and modeling assumptions. J Acoust Soc America (2011) 130(6):4126–38. doi:10.1121/1.3655883
33. Benech N, Brum J, Grinspan G, Aguiar S, Negreira CA. Analysis of the transient surface wave propagation in soft-solid elastic plates. J Acoust Soc America (2017) 142(5):2919–32. doi:10.1121/1.4993633
34. Benech N, Grinspan G, Aguiar S, Negreira C. Surface wave elastography: device and method. Meas Sci Tech (2019) 30(3):035701. doi:10.1088/1361-6501/aafa66
35. Dickinson RJ, Hill CR. Measurement of soft tissue motion using correlation between A-scans. Ultrasound Med Biol (1982) 8(3):263–71. doi:10.1016/0301-5629(82)90032-1
36. Catheline S. Interférométrie-Speckle ultrasonore: application à la mesure d'élasticité. Doctoral dissertation, Université Paris-Diderot-Paris VII) (2023).
37. Tanter M, Bercoff J, Athanasiou A, Deffieux T, Gennisson JL, Montaldo G, et al. Quantitative assessment of breast lesion viscoelasticity: initial clinical results using supersonic shear imaging. Ultrasound Med Biol (2008) 34(9):1373–86. doi:10.1016/j.ultrasmedbio.2008.02.002
38. Nordez A, Gennisson JL, Casari P, Catheline S, Cornu C. Characterization of muscle belly elastic properties during passive stretching using transient elastography. J Biomech (2008) 41(10):2305–11. doi:10.1016/j.jbiomech.2008.03.033
39. Uffmann K, Maderwald S, Ajaj W, Galban CG, Mateiescu S, Quick HH, et al. In vivo elasticity measurements of extremity skeletal muscle with MR elastography. NMR Biomed Int J Devoted Develop Appl Magn Reson Vivo (2004) 7(4):181–90. doi:10.1002/nbm.887
40. Gennisson JL, Catheline S, Chaffaı S, Fink M. Transient elastography in anisotropic medium: application to the measurement of slow and fast shear wave speeds in muscles. J Acoust Soc America (2003) 114(1):536–41. doi:10.1121/1.1579008
41. Heers G, Jenkyn T, Dresner MA, Klein MO, Basford JR, Kaufman KR, et al. Measurement of muscle activity with magnetic resonance elastography. Clin Biomech (2003) 18(6):537–42. doi:10.1016/s0268-0033(03)00070-6
42. Jenkyn TR, Ehman RL, An KN. Noninvasive muscle tension measurement using the novel technique of magnetic resonance elastography (MRE). J Biomech (2003) 36(12):1917–21. doi:10.1016/s0021-9290(03)00005-8
43. Catheline S, Gennisson JL, Delon G, Fink M, Sinkus R, Abouelkaram S, et al. Measurement of viscoelastic properties of homogeneous soft solid using transient elastography: an inverse problem approach. J Acoust Soc America (2004) 116(6):3734–41. doi:10.1121/1.1815075
44. Deffieux T, Montaldo G, Tanter M, Fink M. Shear wave spectroscopy for in vivo quantification of human soft tissues visco-elasticity. IEEE Trans Med Imaging (2008) 28(3):313–22. doi:10.1109/tmi.2008.925077
45. Rudenko OV, Sarvazyan AP. Wave anisotropy of shear viscosity and elasticity. Acoust Phys (2014) 60:710–8. doi:10.1134/s1063771014060141
46. Schröder CT, Scott WR. On the complex conjugate roots of the Rayleigh equation: the leaky surface wave. J Acoust Soc America (2001) 110(6):2867–77. doi:10.1121/1.1419085
47. Benech N, Camargo A, Negreira C. Simplified Green’s function for surface waves in quasi-incompressible elastic plates with application to elastography. J Phys Condensed Matter (2022) 34(21):214004. doi:10.1088/1361-648X/ac5993
48. Miller GF, Pursey H. The field and radiation impedance of mechanical radiators on the free surface of a semi-infinite isotropic solid. Proc R Soc Lond Ser A. Math Phys Sci (1954) 223(1155):521–41. doi:10.1098/rspa.1954.0134
49. Solomonow M, Baratta R, Bernardi M, Zhou B, Lu Y, Zhu M, et al. Surface and wire EMG crosstalk in neighbouring muscles. J Electromyogr Kinesiol (1994) 4(3):131–42. doi:10.1016/1050-6411(94)90014-0
50. Hug F, Tucker K, Gennisson JL, Tanter M, Nordez A. Elastography for muscle biomechanics: toward the estimation of individual muscle force. Exerc Sport Sci Rev (2015) 43(3):125–33. doi:10.1249/jes.0000000000000049
51. Avrillon S, Hug F, Guilhem G. Between-muscle differences in coactivation assessed using elastography. J Electromyogr Kinesiol (2018) 43:88–94. doi:10.1016/j.jelekin.2018.09.007
52. Keuler EM, Loegering IF, Martin JA, Roth JD, Thelen DG. Shear wave predictions of Achilles tendon loading during human walking. Scientific Rep (2019) 9(1):13419. doi:10.1038/s41598-019-49063-7
53. Timoshenko SP. LXVI. On the correction for shear of the differential equation for transverse vibrations of prismatic bars. Lond Edinb Dublin Philos Mag J Sci (1921) 41(245):744–6. doi:10.1080/14786442108636264
54. Timoshenko SPX. On the transverse vibrations of bars of uniform cross-section. Lond Edinb Dublin Philos Mag J Sci (1922) 43(253):125–31. doi:10.1080/14786442208633855
Keywords: non-ultrasound surface wave elastography, shear elastic modulus, simultaneous measurements, high sample rate, electromyography, skeletal muscle
Citation: Grinspan GA, Oliveira LFD, Brandao MC and Benech N (2024) Widening the frontiers of elastography in biomechanics: simultaneous muscle elasticity measurements at high-sample rate with surface wave elastography. Front. Phys. 12:1329296. doi: 10.3389/fphy.2024.1329296
Received: 28 October 2023; Accepted: 24 January 2024;
Published: 07 February 2024.
Edited by:
Manmohan Singh, University of Houston, United StatesReviewed by:
Albrecht Ingo Schmid, Medical University of Vienna, AustriaCopyright © 2024 Grinspan, Oliveira, Brandao and Benech. This is an open-access article distributed under the terms of the Creative Commons Attribution License (CC BY). The use, distribution or reproduction in other forums is permitted, provided the original author(s) and the copyright owner(s) are credited and that the original publication in this journal is cited, in accordance with accepted academic practice. No use, distribution or reproduction is permitted which does not comply with these terms.
*Correspondence: Gustavo A. Grinspan, Z2dyaW5zcGFuQGZjaWVuLmVkdS51eQ==
Disclaimer: All claims expressed in this article are solely those of the authors and do not necessarily represent those of their affiliated organizations, or those of the publisher, the editors and the reviewers. Any product that may be evaluated in this article or claim that may be made by its manufacturer is not guaranteed or endorsed by the publisher.
Research integrity at Frontiers
Learn more about the work of our research integrity team to safeguard the quality of each article we publish.