 Yibo He
 Xin Tong1
 Jingyi Cheng
 Rong Zhou
94% of researchers rate our articles as excellent or good
Learn more about the work of our research integrity team to safeguard the quality of each article we publish.
Find out more
ORIGINAL RESEARCH article
Front. Phys., 15 February 2024
Sec. Medical Physics and Imaging
Volume 12 - 2024 | https://doi.org/10.3389/fphy.2024.1295683
This article is part of the Research TopicPrompt-gamma Imaging in Particle TherapyView all 6 articles
To validate range shifts in proton therapy, we investigated the potential of using the temporal information of prompt gamma rays as an indicator. We simulated the proton transport process using Monte Carlo simulations and used a geometric scorer to obtain the location and timing of prompt gamma ray production. By using a homogeneous target material in the simulation model, we established a fitted relationship between the range of 90–210 MeV protons and the corresponding temporal spectral width. Additionally, by introducing air cavities of 2–20 mm in simulations of inhomogeneous target materials, we observed significant correlations between the range offsets and the temporal spectral widths. These correlations were fitted to derive a functional relationship between the two variables.
Proton and heavy ion beams are known for their dosimetric characteristics, specifically the Bragg peaks. These characteristics make them promising for precise tumor treatment. However, uncertainties in the range of these beams have hindered their widespread clinical application [1]. In order to guarantee treatment accuracy, it is crucial to verify their actual range. Various range verification methods are currently being investigated [2, 3], focusing on establishing the correlation between secondary particle information and range.
A possible method for real-time monitoring, known as prompt gamma imaging (PGI), is currently under development. PGI utilizes a detector with a collimator or a Compton camera to reconstruct the emission point of prompt gamma rays [4–10]. However, implementation of shielding or Compton imaging methods may require an increase in detector size. In addition, the use of large, bulky collimators limits the directions from which the beam can come. This means that not all irradiation plans can be carried out without repositioning the detector in the meantime. As a more cost-effective alternative, the prompt gamma timing (PGT) method employs a time detector to obtain the time distribution of prompt gamma rays [11–18].
Previous studies have indicated a correlation between the width of the time spectrum of prompt gamma rays and the proton range [11, 19]. In previous studies, the correlations between proton ranges and time spectra in experimental data have typically been analyzed through linear models. In these studies, it becomes apparent that certain data points deviate from the outcomes obtained through linear fitting. Thus, this correlation does not appear to be a straightforward linear relationship. The use of inaccurately fitted model may affect the accuracy and sensitivity of the range validation of the method. The purpose of this study is to determine an accurate correlation between the spectral width over time and the range of protons as they travel. We derived a fitting model from kinematic equations and will apply it to data from Monte Carlo simulations. These simulations were conducted on both homogeneous and non-homogeneous target materials to facilitate the fitting. With this approach, the study aims to better understand the relationship between these two variables.
Figure 1 illustrates a Geant4 [20–22] simulation of a monoenergetic proton beam interacting with a rectangular water target. The physical list used is QGSP_BIC_HP_EMY. The simulation records information such as time (
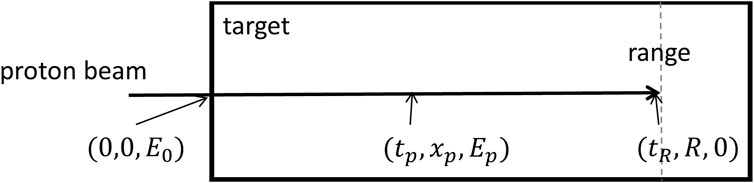
FIGURE 1. Proton beam of initial energy
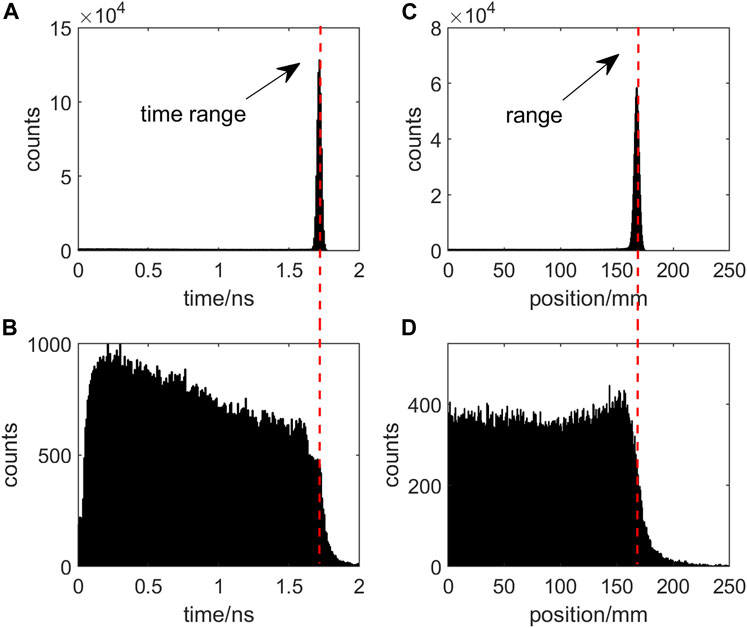
FIGURE 2. Proton Beam Termination in Target where (A) denotes the travel time, (C) denotes the final stop position, and (B) and (D) indicate the moment and position of second prompt gamma-ray emission during proton traversal, respectively.
Comparing plots (A) with (C) and (B) with (D) in Figure 2, it becomes apparent that the position of the falling edge in the distribution of proton stoppage and prompt gamma emission exhibits correlation on both spatial and temporal scales. This spatial correlation serves as the validation range for the prompt gamma imaging technique. Furthermore, the relationship between the temporal correlation and the proton’s travel time and path forms the foundation for the development of the prompt gamma timing technique.
The proton’s traveling kinetics is examined in the simulated conditions depicted in Figure 1. The calculation procedure is outlined as follows:
The energy lost (
Where
Where
Ignoring the correction term in square brackets, one obtains
In addition, for simplicity, relativity is not considered, the kinetic energy of the proton is related to the velocity as
Due to
Combining Eq. 1 and Eq. 5, we have
Combining Eq. 4 and Eq. 7 yields:
When
The neglect of relativistic effects in Eq. 3 and Eq. 4 during the theoretical derivation may deteriorate the applicability of the model. To correct this, we applied a power function model, informed by the outcomes of Eq. 5, to the data from the Monte Carlo simulations. By refining the power parameter within this model, we ensured it precisely represented the relationship between time and energy. Subsequently, to acquire comprehensive information for data fitting, we will conduct simulations using the Geant4 Monte Carlo tool to investigate neutron background and collect detailed data.
To investigate the neutron background when detecting prompt gamma rays, a simulation experiment was designed as depicted in Figure 3A. The physical list used is QGSP_BIC_HP_EMY. In this experiment, a single Pencil Beam Scanning (PBS) spots with 180 MeV and 108 protons was directed towards a water phantom, while a 4 cm × 4 cm detector was located at the entrance of the beam at a distance of 20 cm and at 90° to the beam axis. The detector recorded the time of arrival at its surface, enabling the calculation of the time of flight from the proton’s entry to the detection of the secondary particle. Simultaneously, we recorded the particle type (photon or neutron) to assess the global influence of the neutron background on the time distribution of prompt gamma rays. For its detection efficiency, we set it up as an ideal detector which detects PGs and neutrons with equal selectivity.
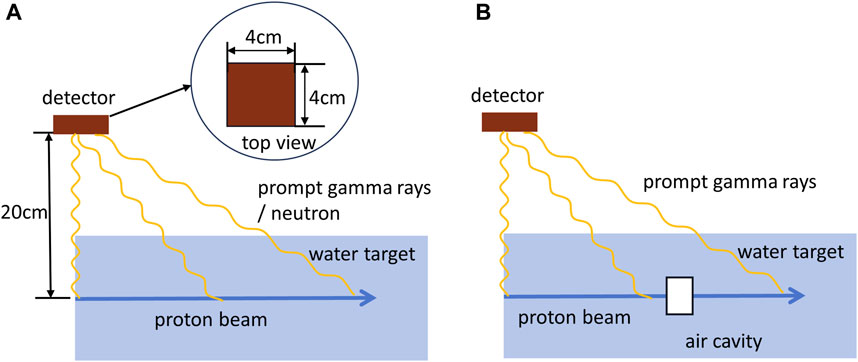
FIGURE 3. Simulation settings. Proton beam irradiated (A) a homogeneous water target and (B) a inhomogeneous target with an air cavity. A time detector is set up above the water target to record the time of arrival of prompt gamma rays or neutrons at the detector.
To establish a correlation between the proton range and the time spectrum of prompt gamma emission in Figure 2, simulations were conducted with proton beam ranging from 90 MeV to 210 MeV, with increments of 5 MeV, using the experimental setup outlined in Figure 3A. The time detector was also located at the entrance of the beam at a distance of 20 cm and at 90° to the beam axis. The arrival times of prompt gamma rays were recorded using the time detector. In each simulation at a specific proton energy, the proton travel time and distance were plotted, as demonstrated in Figures 2A, C. The proton range and the corresponding time required to reach the range were obtained as prior knowledge for subsequent simulations.
To investigate whether the range shift can be detected by analyzing the time distribution of prompt gamma rays, a simulation was conducted using an inhomogeneous target. Specifically, an air cavity with a thickness ranging from 2 mm to 20 mm was placed at regular intervals, with a step size of 2 mm, starting 5 cm before the proton range. In this simulation, a single PBS spots of 180 MeV with 108 protons was used to irradiate the target. The time detector, positioned above the water target, recorded the arrival moments of the prompt gamma rays. The schematic representation of this simulation setup is illustrated in Figure 3B.
At the start of each simulation, the time of proton entry within the target is recorded. The time spectrum of the prompt gamma rays is then obtained by calculating the difference between the moment of acquisition on the time detector and the moment of proton entry. To determine the appropriate time window, the corresponding width of the time spectrum is either read or calculated [19]. Given the observed asymmetry in the temporal distribution of our spectra, we adopted a methodical approach to delineate the spectrum width directly from the processed data. This delineation process was defined in two steps:
Step 1. Considering the fixed positional relationship between the detector and the target for each specified incident energy, the beginning of the spectrum width inherently corresponds to the prompt gamma ray emissions originating at the target’s entry point. Hence, the spectrum’s initiation is both predetermined and invariant;
Step 2. Pertaining to the determination of the spectrum termination, a sigmoid fitting was executed on the spectrum’s concluding segment. The precise points of inflection derived from this sigmoidal characterization were judiciously selected to denote the end limits of the width.
Following the irradiation of a water target using a 180 MeV single PBS spots proton beam, a total of 45,597 gamma rays and 41,693 neutrons were recorded as a result of the nuclear reaction between the protons and the target material. Upon applying a time window of 10 ns, 45,245 gamma rays and 18,205 neutrons remained in the dataset.
The time distributions of gamma rays and neutrons, after applying the filtering process, are shown separately in Figure 4. It is evident that the gamma rays are primarily concentrated within the first 2.3 ns of the time spectrum, while the neutrons exhibit a more uniform distribution throughout the spectrum after 2 ns By setting a time window of 2.3 ns, more than 95% of the neutron background can be excluded, while retaining 92% of the gamma rays. This allows for the effective exclusion of the majority of neutron events and reduces the interference caused by the neutron background by employing an appropriate time window. The statistics and time windows mentioned above are based on the current simulation parameters. It is important to note that these values may vary depending on the specific simulation conditions and experimental setup.
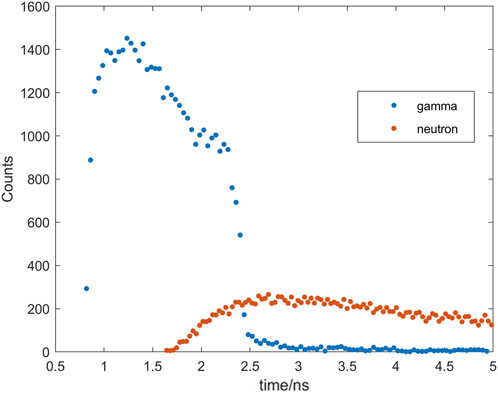
FIGURE 4. Time spectrum of gamma rays (red triangles) and neutrons (blue triangles) recorded by the detector. The time window is 5 ns.
In the simulation of an irradiation of the water target with a single PBS spots proton beam ranging from 90 MeV to 200 MeV, with 108 protons, several parameters were collected for each energy level. These included the proton range, the transmission time fringes, and the prompt gamma time spectra. The acquired PG time spectra are illustrated in Figure 5. To investigate the relationship between the proton range and the width of the time spectrum, the width of the time spectra was calculated using Eq. 10. This analysis allows for an examination of the correlation between the extent of the proton range and the spread of the time spectrum.
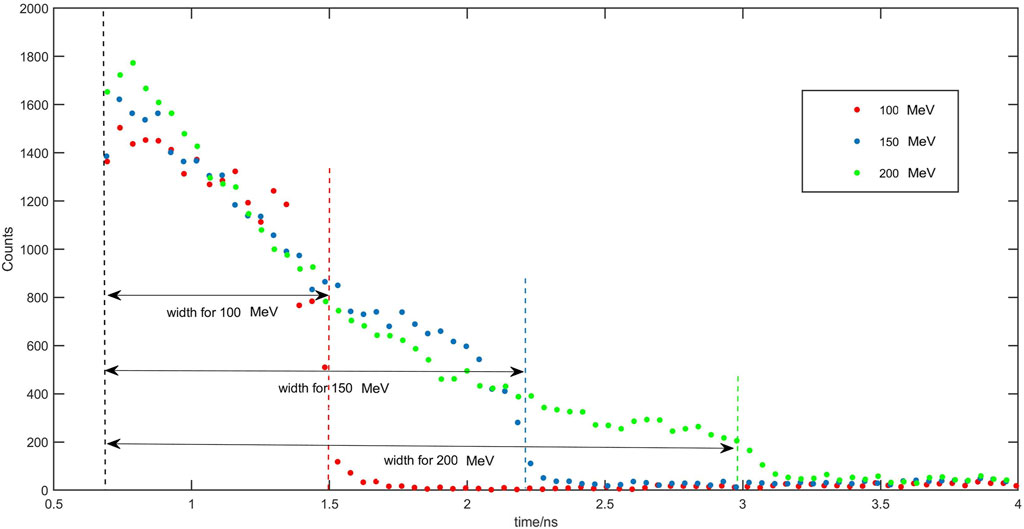
FIGURE 5. Prompt gamma time spectra and their widths using proton irradiation at 100 MeV (red dots), 150 MeV (blue dots) and 200 MeV (green dots).
The proton energy was fitted to the proton travel time using Eq. 9, and the fitting results are displayed in Figure 6A. Then, based on past research, the proton range and proton energy follow a power law [24], as depicted in Figure 6B. Additionally, to avoid the introduction of additional complex parameters, a linear fit was conducted to examine the relationship between the proton travel time and the temporal spectral width. This analysis was depicted in Figure 6C, which exhibited a high correlation coefficient (R2 = 0.9987). Based on this strong correlation, it can be inferred that the linear model accurately captures the association between these two variables in the given simulation conditions. By combining the aforementioned results, a final fit was achieved between the range and the time spectral width, as presented in Figure 6D. The fitting results, utilizing the form
where W represents the width in nanoseconds (ns), R denotes the range in millimeters (mm), and b is a dimensionless parameter derived from the fitting process, with a determined value of 0.9104. This equation demonstrates a good correlation with the observed simulated data.
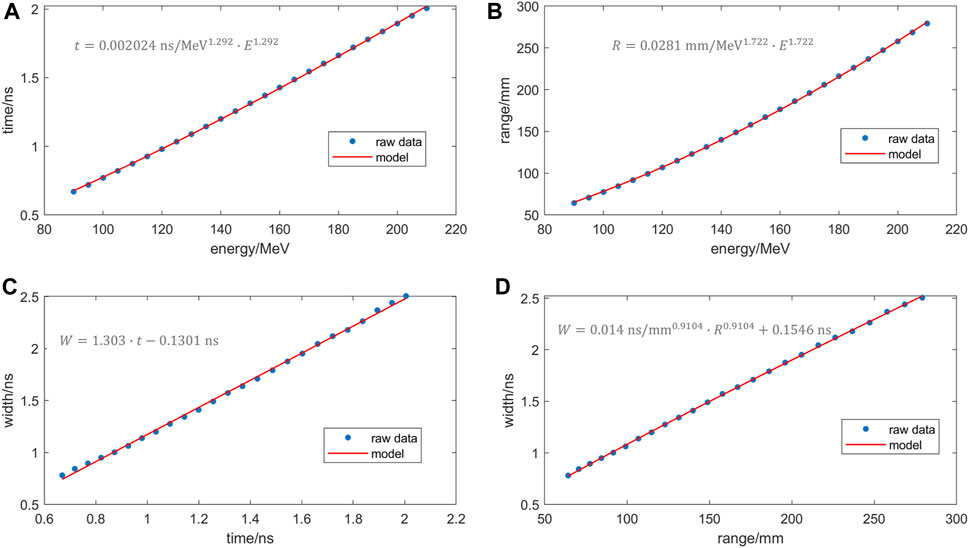
FIGURE 6. Raw data (dots) and fitted curves (red line) for (A) travelling time vs. energy (B) Range vs. energy (C) Time spectrum width vs. vs. travelling time (D) range vs. width.
In the case of an air cavity, proton ranges and time spectrum widths were determined for various air thicknesses. The simulations were repeated multiple times for each thickness condition, and the mean and standard deviation of the time spectrum widths were calculated. These results are presented in Figure 7, where fitted curves based on the time spectrum widths are displayed. In terms of selecting the fitting model, we incorporated an additional term in Eq. 10 to account for the time of uniform flight of the proton while passing through cavities with varying thicknesses. This adjustment was made in the simulation results for the homogeneous target discussed in Section 3.2. Moreover, the fitting results align well with the simulation outcomes. This indicates a strong correlation between the variation in the time spectral width and the changes in air cavity thickness for the inhomogeneous target material. Similarly, our fitted equation is,
where b equals 0.9104, and the R2 of the fit was 0.9824, and fits the relationship between these two variables well.
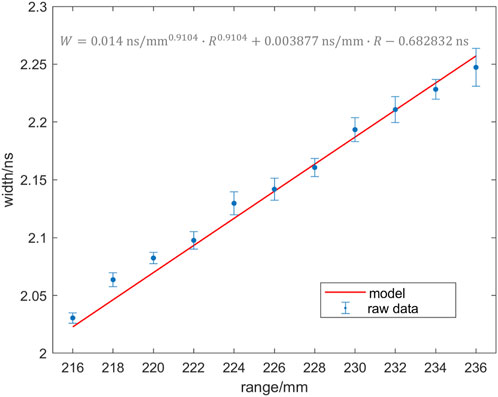
FIGURE 7. Mean and standard deviation (dots with error bar) and fitted curves (red line) of the results of multiple simulations for irradiating a non-uniform target with an air cavity.
Uncertainty in the constituent elements of the human body can lead to deviations between the actual range and the therapeutic range in proton therapy. To address this challenge and enable real-time range validation during treatment, among other methods, researchers explored the use of temporal information from prompt gamma rays. The PGT method offers several advantages over PGI. Initially, for collimated cameras, the utilization of collimators enhances range sensitivity, although it concurrently reduces detection efficiency and increases the footprint and weight of the detection system. In contrast, position-sensitive gamma-ray imaging systems do not necessitate collimators, thereby ensuring efficient detection and better integration into the treatment system. In addition, it does not require complex imaging algorithms like Compton cameras, but relies on common detection techniques and direct data acquisition. Although PGT may acquire less proton range information per detected prompt gamma rays compared to conventional PGI methods, the detection efficiency is notably enhanced. Measurement statistics obtained through PGT are solely determined by the throughput of the detection system. In contrast, Compton cameras used in PGI need to sift through detection information to identify usable events, resulting in a lower efficiency for the same detector load [11]. Considering these advantages, the PGT method exhibits promising research prospects. In previous studies, researchers have initially explored the possibility of using statistical methods to investigate the use of PGT to identify range shift, with encouraging results [15, 17, 19]. However, in these studies, a linear relationship is usually used to establish a correlation between PGT spectral width and range. In the present study, we would like to explore the correlation between the two in depth.
A theoretical and simulation study was conducted to demonstrate the feasibility of utilizing the time spectrum of prompt gamma for proton beam range verification. The correlation between the width of the prompt gamma time spectrum and the proton range was investigated, and a functional relationship between the prompt gamma time spectrum and the proton range was established for irradiation of a homogeneous target material, see Eq. 10. This result uses a fitting model that incorporates the kinetic basis of proton transport and helps to understand the correlations between physical quantities.
Additionally, simulations were performed by introducing various thicknesses of air cavities into the homogeneous target to simulate range shifts. The correlation between the change in the width of the prompt gamma time spectrum and the magnitude of the range shift was examined, and a functional relationship between these two variables was derived, see Eq. 11. In this fit, the effect of proton transport time in heterogeneous materials on the broadening of the PGT spectrum, which was not previously taken into account, is taken into account while inheriting the fitted model of the homogeneous target material from the previous step.
However, it is important to note that this study focused on simulations using a monoenergetic proton beam and an ideal detector, and uses a fitting model that applicable only for air cavities insertions. It did not account for the temporal structure of the actual proton beam and the temporal resolution limitations of real detectors [25, 26]. These factors will introduce blur in the relationship between the width of the time spectrum and the range [27]. Future studies will address this limitation by first assessing the sensitivity of the method in the ideal scenario, and secondly by investigating the extent to which the actual temporal structure of the proton beam and the temporal resolution of the detector contribute to the broadening of the time spectrum’s width. Additionally, they will examine how these factors affect the method’s sensitivity to shifts in range. Subsequent studies will analyze whether this method can be applied for proton range verification under clinical conditions, comparing its verification accuracy with the existing prompt gamma imaging method. This will further validate the potential and applicability of the proposed time spectrum-based approach in practical clinical settings.
In this study, theoretical derivation and Monte Carlo simulations were used to establish a fitting model for the width of the prompt gamma time spectrum and the proton range to better understand the correlation between the two, and the results show that when fitting the width of the time spectrum and the proton range, the R2 of the fitting model used in the fitting is 0.9997 and 0.9824 in the homogeneous and non-homogeneous targets, respectively, which indicates that the model can well fit the simulation result by using the model. This outcome clearly establishes a physically-based relationship between time width and proton range, offering new prospects for monitoring proton therapy range using prompt gamma time spectra.
The raw data supporting the conclusion of this article will be made available by the authors, without undue reservation.
YH: Writing–original draft, Writing–review and editing, Investigation. XT: Writing–original draft, Data curation. YL: Writing–original draft, Data curation. JC: Writing–review and editing, Funding acquisition. RZ: Writing–review and editing, Funding acquisition.
The author(s) declare financial support was received for the research, authorship, and/or publication of this article. This project is supported by National Key R&D Program of China (2022YFF0708100); Natural Science Foundation of Shanghai (21ZR460300).
The authors declare that the research was conducted in the absence of any commercial or financial relationships that could be construed as a potential conflict of interest.
All claims expressed in this article are solely those of the authors and do not necessarily represent those of their affiliated organizations, or those of the publisher, the editors and the reviewers. Any product that may be evaluated in this article, or claim that may be made by its manufacturer, is not guaranteed or endorsed by the publisher.
1. Paganetti H. Range uncertainties in proton therapy and the role of Monte Carlo simulations. Phys Med Biol (2012) 57(11):R99–R117. doi:10.1088/0031-9155/57/11/r99
2. Knopf AC, Lomax A. In vivo proton range verification: a review. Phys Med Biol (2013) 58(15):R131–60. doi:10.1088/0031-9155/58/15/r131
3. Kraan AC. Range verification methods in particle therapy: underlying physics and Monte Carlo modeling. Front Oncol (2015) 5:150. doi:10.3389/fonc.2015.00150
4. Min CH, Kim CH, Youn MY, Kim JW. Prompt gamma measurements for locating the dose falloff region in the proton therapy. Appl Phys Lett (2006) 89(18). doi:10.1063/1.2378561
5. Peterson SW, Robertson D, Polf J. Optimizing a three-stage Compton camera for measuring prompt gamma rays emitted during proton radiotherapy. Phys Med Biol (2010) 55(22):6841–56. doi:10.1088/0031-9155/55/22/015
6. Bom V, Joulaeizadeh L, Beekman F. Real-time prompt gamma monitoring in spot-scanning proton therapy using imaging through a knife-edge-shaped slit. Phys Med Biol (2012) 57(2):297–308. doi:10.1088/0031-9155/57/2/297
7. Verburg JM, Seco J. Proton range verification through prompt gamma-ray spectroscopy. Phys Med Biol (2014) 59(23):7089–106. doi:10.1088/0031-9155/59/23/7089
8. Draeger E, Mackin D, Peterson S, Chen H, Avery S, Beddar S, et al. 3D prompt gamma imaging for proton beam range verification. Phys Med Biol (2018) 63(3):035019. doi:10.1088/1361-6560/aaa203
9. Richter C, Pausch G, Barczyk S, Priegnitz M, Keitz I, Thiele J, et al. First clinical application of a prompt gamma based in vivo proton range verification using a knife-edge slit camera. Radiother Oncol (2016) 118:S89–S90. doi:10.1016/s0167-8140(16)30184-0
10. Xie YH, Bentefour E, Janssens G, Smeets J, Vander Stappen F, Hotoiu L, et al. Prompt gamma imaging for in vivo range verification of pencil beam scanning proton therapy. Int J Radiat Oncol Biol Phys (2017) 99(1):210–8. doi:10.1016/j.ijrobp.2017.04.027
11. Golnik C, Hueso-Gonzalez F, Muller A, Dendooven P, Enghardt W, Fiedler F, et al. Range assessment in particle therapy based on prompt gamma-ray timing measurements. Phys Med Biol (2014) 59(18):5399–422. doi:10.1088/0031-9155/59/18/5399
12. Hueso-Gonzalez F, Enghardt W, Fiedler F, Golnik C, Janssens G, Petzoldt J, et al. First test of the prompt gamma ray timing method with heterogeneous targets at a clinical proton therapy facility. Phys Med Biol (2015) 60(16):6247–72. doi:10.1088/0031-9155/60/16/6247
13. Petzoldt J, Roemer KE, Enghardt W, Fiedler F, Golnik C, Hueso-Gonzalez F, et al. Characterization of the microbunch time structure of proton pencil beams at a clinical treatment facility. Phys Med Biol (2016) 61(6):2432–56. doi:10.1088/0031-9155/61/6/2432
14. Krimmer J, Dauvergne D, Letang JM, Testa E. Prompt-gamma monitoring in hadrontherapy: a review. Nucl Instrum Meth A (2018) 878:58–73. doi:10.1016/j.nima.2017.07.063
15. Marcatili S, Collot J, Curtoni S, Dauvergne D, Hostachy JY, Koumeir C, et al. Ultra-fast prompt gamma detection in single proton counting regime for range monitoring in particle therapy. Phys Med Biol (2020) 65(24):245033. doi:10.1088/1361-6560/ab7a6c
16. Jacquet M, Marcatili S, Gallin-Martel ML, Bouly JL, Boursier Y, Dauvergne D, et al. A time-of-flight-based reconstruction for real-time prompt-gamma imaging in proton therapy. Phys Med Biol (2021) 66(13):135003. doi:10.1088/1361-6560/ac03ca
17. Schellhammer SM, Wiedkamp J, Löck S, Kögler T. Multivariate statistical modelling to improve particle treatment verification: implications for prompt gamma-ray timing. Front Phys (2022) 10:10. doi:10.3389/fphy.2022.932950
18. Pennazio F, Ferrero V, D'Onghia G, Garbolino S, Fiorina E, Villarreal OAM, et al. Proton therapy monitoring: spatiotemporal emission reconstruction with prompt gamma timing and implementation with PET detectors. Phys Med Biol (2022) 67(6):065005. doi:10.1088/1361-6560/ac5765
19. Werner T, Berthold J, Hueso-Gonzalez F, Koegler T, Petzoldt J, Roemer K, et al. Processing of prompt gamma-ray timing data for proton range measurements at a clinical beam delivery. Phys Med Biol (2019) 64(10):105023. doi:10.1088/1361-6560/ab176d
20. Agostinelli S, Allison J, Amako K, Apostolakis J, Araujo H, Arce P, et al. GEANT4-a simulation toolkit. Nucl Instrum Meth A (2003) 506(3):250–303. doi:10.1016/s0168-9002(03)01368-8
21. Allison J, Amako K, Apostolakis J, Araujo H, Dubois PA, Asai M, et al. Geant4 developments and applications. Ieee T Nucl Sci (2006) 53(1):270–8. doi:10.1109/tns.2006.869826
22. Allison J, Amako K, Apostolakis J, Arce P, Asai M, Aso T, et al. Recent developments in GEANT4. Nucl Instrum Meth A (2016) 835:186–225. doi:10.1016/j.nima.2016.06.125
23. Ziegler JF. Stopping of energetic light ions in elemental matter. J Appl Phys (1999) 85(3):1249–72. doi:10.1063/1.369844
24. Newhauser WD, Zhang R. The physics of proton therapy. Phys Med Biol (2015) 60(8):R155–R209. doi:10.1088/0031-9155/60/8/r155
25. Pausch G, Petzoldt J, Berthel M, Enghardt W, Fiedler F, Golnik C, et al. Scintillator-based high-throughput fast timing spectroscopy for real-time range verification in particle therapy. Ieee T Nucl Sci (2016) 63(2):664–72. doi:10.1109/tns.2016.2527822
26. Gallin-Martel ML, Abbassi L, Bes A, Bosson G, Collot J, Crozes T, et al. A large area diamond-based beam tagging hodoscope for ion therapy monitoring. In: Advancements in nuclear instrumentation measurement methods and their applications (animma 2017) 170 (2018).
Keywords: proton therapy, range verification, prompt gamma-ray timing, Monte Carlo simulation, time of flight
Citation: He Y, Tong X, Li Y, Cheng J and Zhou R (2024) Establishing the function relationship between time spectrum and proton range in proton therapy through Monte Carlo simulation. Front. Phys. 12:1295683. doi: 10.3389/fphy.2024.1295683
Received: 17 September 2023; Accepted: 31 January 2024;
Published: 15 February 2024.
Edited by:
Paulo Magalhaes Martins, University of Lisbon, PortugalReviewed by:
Toni Kögler, Helmholtz Association of German Research Centres (HZ), GermanyCopyright © 2024 He, Tong, Li, Cheng and Zhou. This is an open-access article distributed under the terms of the Creative Commons Attribution License (CC BY). The use, distribution or reproduction in other forums is permitted, provided the original author(s) and the copyright owner(s) are credited and that the original publication in this journal is cited, in accordance with accepted academic practice. No use, distribution or reproduction is permitted which does not comply with these terms.
*Correspondence: Jingyi Cheng, amNoZW5nMTNAZnVkYW4uZWR1LmNu, Rong Zhou, emhvdXJvbmdAc2N1LmVkdS5jbg==
Disclaimer: All claims expressed in this article are solely those of the authors and do not necessarily represent those of their affiliated organizations, or those of the publisher, the editors and the reviewers. Any product that may be evaluated in this article or claim that may be made by its manufacturer is not guaranteed or endorsed by the publisher.
Research integrity at Frontiers
Learn more about the work of our research integrity team to safeguard the quality of each article we publish.