 Apostolos Kyrloglou
 Patrick Giefer2
 Udo Fritsching
- 1Graduate School MIMENIMA, University of Bremen, Bremen, Germany
- 2Leibniz Institute for Materials Engineering—IWT, Bremen, Germany
- 3Particles and Process Engineering, University of Bremen, Bremen, Germany
Analysis of membrane processes in fluid processing, and their main influencing operating conditions are relevant in a variety of industrial applications. Increasing regulatory scrutiny and environmental considerations are forcing industries across all sectors, from food and pharma to oil and gas, to further understand and optimise the handling and formulation of liquid systems for efficient process design. In a generic setup for emulsification and liquid formulation the flow and dispersion behaviour of a liquid oil droplet on its way through a porous water filled membrane is analysed. A set of high-resolution numerical simulations of a single oil droplet dispersed in water through a porous membrane structure with varying contact angles is performed. In this work cluster analysis of volume-of-fluid simulation results to obtain statistical droplet size distributions is conducted and further analysed to highlight the effect of the contact angle as well as pressure drop on the dynamics of the system. It is observed that based on the membrane surface activity the droplet behaviour changes from filtration with coalescence when the membrane is lipophilic to emulsification with droplet break-up when the membrane is lipophobic. Furthermore, the pressure drop is identified as a key factor for the dynamics of the droplet process and the frame in which it occurs. These results highlight that the membrane wettability is a determining factor for the emulsification or filtration effectiveness of a membrane for various applications.
1 Introduction
The role of membrane processes, from emulsification to filtration, has been of increasing importance in a number of key industries including food, pharmaceutical [1–4], and wastewater treatment [5], stretching as far as oil and gas [6,7]. Customer demand for high product quality together with adherence to increasingly strict government regulation has made studying these processes and their influencing parameters of utmost significance. Understanding parameters such as the membrane porosity and pore size distribution, along with the membrane surface wettability or charge, can help tailor membranes for specific applications and optimize and improve these applications.
Advanced and detailed experimental in situ investigations based on, for instance, nuclear magnetic resonance imaging have been employed to study liquid membrane processes in detail. However, such studies reach certain limits in terms of resolvable pore sizes and time scales [8]. To assist in this effort and to provide deeper insight into liquid membrane processes, numerical simulations of liquid filtration and emulsification using various numerical methods from phase field [9–11] to level set and volume of fluid (VoF) [12–14] as well as lattice Boltzmann (LB) [15–17] have been utilized [18–20]. All these studies have, in one way or another, through their specific approach, tackled the subject of wettability in membrane processes. However, in this context, typically idealized or simple pore geometries or membrane processes, sibling to the direct membrane emulsification case, such as cross flow emulsification/filtration [12], have been investigated.
In continuation of such approaches, in this work, we present a high-resolution set of direct premix droplet emulsification simulations for a realistic CT-scanned borosilicate glass porous membrane structure (ROBU Glasfilter-Geraete GmbH). Thus, the focus is on a novel study around the impact of varying contact angles on the dispersion behavior of a single droplet in a complex membrane structure under direct premix emulsification conditions. The liquid retention rate (filtration) and the dispersed phase coalescence and build-up at the membrane exit are illustrated and discussed, derived from VoF simulations through custom runtime computational routines. Moreover, a computational strategy presented for the first time in this work is developed as an OpenFOAM post-processing routine for obtaining the resulting droplet size distribution (emulsification) from purely Eulerian VoF simulations. This is carried out in contrast to previous works where Lagrangian tracking has been used for similar tasks. The simulations for this work are carried out based on the open-source software package OpenFOAM and the VoF method [21].
2 Numerical methods
For modeling the liquid/liquid multiphase flow problem, the OpenFOAM interFlow solver [21] is used. interFlow is an extension of interFoam, the standard immiscible incompressible two-phase solver in OpenFOAM, with the advanced geometric interface reconstruction algorithm isoAdvector [22]. This alternative to the OpenFOAM default MULES algorithm provides increased interface sharpness as well as reduction in the evolvement of spurious currents allowing the simulation of smaller velocities and cell sizes than otherwise achievable in the OpenFOAM implementation of the VoF method [23–25].
The standard set of the transient incompressible isothermal Navier–Stokes equations for two immiscible fluid phases is solved based on the VoF method using the interFlow solver from OpenFOAM, which calculates the multiphase flow problem with distinct phase boundaries. In VoF, the two fluid phases are represented by a local fractional alpha field in the simulation with 0.0 representing the continuous and 1.0 the dispersed phase. The fractional values represent the interface between the two phases with the 0.5 threshold point commonly accepted as the location of the actual sharp interface. For solving the pressure coupled set of equations, the PIMPLE algorithm is used.
Before running the simulations, proper validation of the utilized sub-models, the numerical solver parameters, and the mesh resolution for droplet relevant applications is performed. Therefore, the behavior of a Taylor droplet (dispersed phase MCT oil) in a water matrix (continuous phase) in a 200 μm diameter circular microcapillary (pore) for capillary numbers (based on the continuous phase properties) in the range Cacont = 4∙10−4–2∙10−2 for inlet velocities of Uin = 9.6∙10−3–0.48 m/s is simulated. The mesh resolution, i.e., the cell edge length in this validation case, was 2.9 μm, which is approximately half of the resolution used for the membrane simulations. The capillary diameter-to-cell size ratio, therefore, is 69, while the mean pore to cell size ratio in the membrane simulations is 9. Finally, the deformation of the front cap (by calculating the cap deformation factor kr,f) is compared to experimental data, as depicted in Figure 1 [26]. The simulation results for the cap deformation match the published experimental data. We could, therefore, conclude that the solver, and more specifically, the geometric interface reconstruction algorithm, can be properly used for droplet relevant process analysis in microcapillaries.
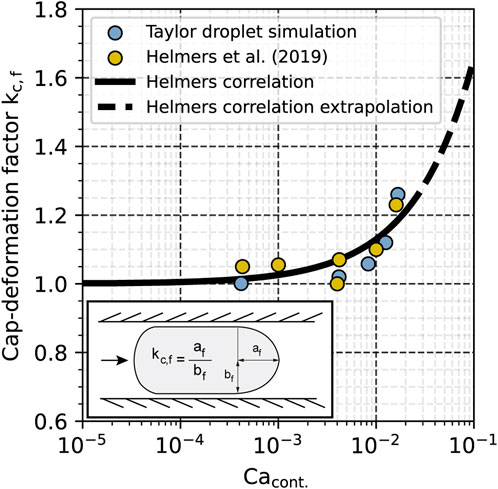
FIGURE 1. Front cap deformation of a Taylor droplet at different capillary numbers and comparison with experimental data adapted from [26].
From benchmarking with various discretization and solving schemes, the Crank–Nicolson time discretization scheme is finally employed with a coefficient of 0.9, resulting in a 0.1 fractional Euler discretization. The resulting set of linear equations is solved using the conjugate gradient (CG) method with the velocity equation using Preconditioned Bi-Conjugate Gradient Stabilized (PBiCGStab) with a diagonal-based incomplete lower–upper (DILU) preconditioner and pressure using a preconditioned conjugate gradient (PCG) with a geometric agglomerated algebraic multigrid (GAMG) preconditioner and a Gauss–Seidel smoother. The iterative error tolerance for the residuals, i.e., the level at which the residual is small enough that the solution can be considered sufficiently accurate, is set to rp = 10−7 for pressure and ru = 10−6 for velocity.
As depicted in Figure 2, in order to generate a high-resolution mesh for the simulations, a series of steps are taken. First, a cube domain is generated in [27], and then, the micro-computed tomography (μCT) stereolithographic (STL) file is loaded in Blender and positioned as depicted to overlap with the cube domain. Then, both parts are re-exported as STL files in their new positions to be used within OpenFOAM for the final mesh generation.
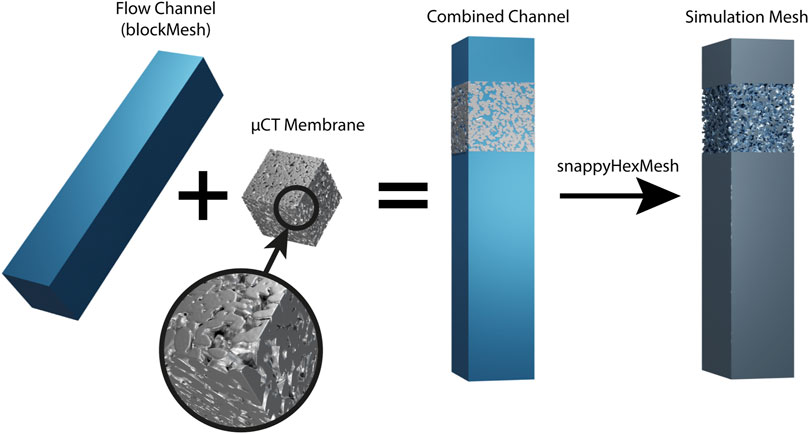
FIGURE 2. Illustrative representation of the mesh generation process for the fluid domain from a μCT-generated STL file to OpenFOAM rendered in [27].
In OpenFOAM, the mesh generation is initialized by creating a three-dimensional rectangular spatially discretized box engulfing the whole simulation geometry called a blockMesh. Then, the surfaceFeatureExtract procedure with a wide angle of 179° is run on the two STL files to define the membrane surface in as detailed a manner as possible for the meshing process. The simulation mesh is finally generated via the snappyHexMesh algorithm with various refinement levels to accommodate the droplet initial position and provide a very high mesh resolution within the membrane structure and toward the outlet where the droplet size distribution is analyzed.
Given the complex membrane structure, a conventional mesh independence study, as, for example, the grid convergence index (GCI) [28], is not feasible as the geometrical representation of the membrane may change with an alteration to the cell size and mesh resolution leading to an alteration of the simulation domain. Therefore, in this work, a mesh resolution study for liquid flow through the membrane is performed around three characteristic membrane parameters, namely, porosity ε, permeability κ, and tortuosity τ, according to
where V is the volume, uin is the inlet velocity, μc is the continuous phase dynamic viscosity, Lm is the membrane length, ΔPm is the membrane pressure drop, and Lt is the tortuous length.
In the mesh independence study, with mesh 1 being the coarsest and mesh 5 the finest, as presented in Table 1 and Figure 3, one can observe that as the cell size becomes smaller, the three characteristic membrane parameters (porosity, tortuosity, and permeability) describing the membrane and the flow within change. These parameters follow an exponential trend, converging toward the value of the original real membrane. The porosity becomes progressively larger as a smaller cell size means that finer features can be resolved more accurately and included in the simulated mesh. The tortuosity, on the other hand, becomes progressively smaller since the higher mesh resolution leads to more paths in the membrane structure being available for the flow to use. As such, the permeability also progressively increases since a higher porosity and more flow paths result in a lower pressure drop inside the membrane.
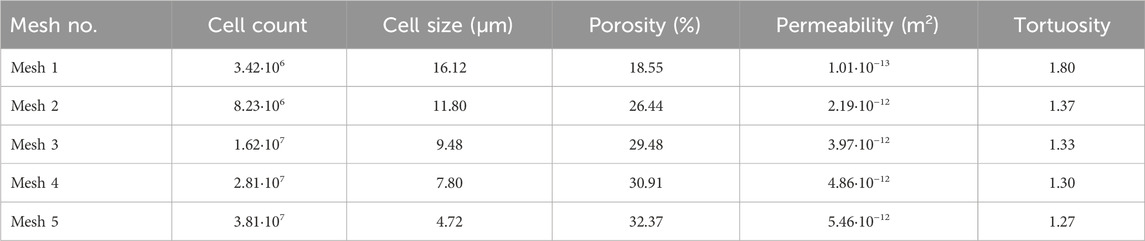
TABLE 1. Mesh study for the liquid flow through the membrane system based on porosity, permeability, and tortuosity.
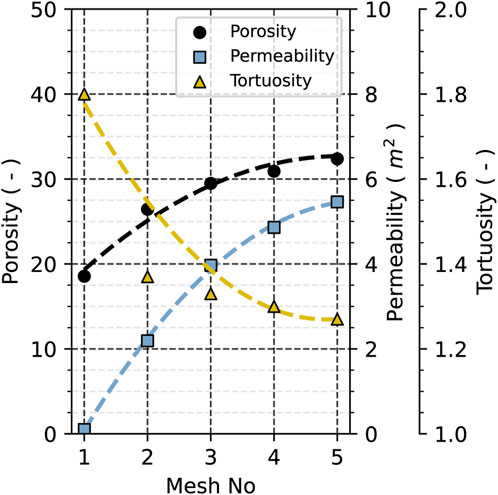
FIGURE 3. Mesh study on porosity, permeability, and tortuosity plotted for the individual meshes with trendlines indicating refinement convergence.
According to these results and considering numerical limitations, such as the minimum cell size, to prevent the development of artifacts (such as spurious currents), as a compromise, mesh 4, is chosen for this work. This result coincides with an average cell size that also has previously been taken for emulsification simulations in the same membrane structure [29]. The final numerical grid consists of approximately 3∙107 cells with a nominal cell edge length of ∼8 μm.
A set of standard boundary conditions has been employed, as depicted in Figure 4. An inlet velocity condition (U = 0.05–0.20 m/s) is applied to create a pressure drop and push the droplet through the membrane structure. To suppress the development of spurious currents during start-up, the same velocity is set as the initial condition over the whole simulation domain. A zero-pressure (p = 0 Pa) outlet is specified to ensure simulation convergence and allow for the development of an unhindered pressure drop through the system. On the walls of the whole domain, the no-slip (U = 0 m/s) condition is applied for the velocity and a fixed flux condition for the pressure, where the latter means that the pressure gradient is set such that the flux on the boundary is that specified by the velocity boundary condition. As the velocity boundary condition is set to no slip at the wall, this pressure condition ensures the dispersed phase volume conservation by preventing parasitic currents from sharp-angle cells within the complex structure. Furthermore, in the parameter variation, the static contact angle boundary condition has been varied from 0° to 180° in steps of 30° to study the flow in the membrane structure with different surface activities. This contact angle is defined from the oil toward the water. As such, 0° refers to an oleophilic/hydrophobic system while 180° to an oleophobic/hydrophilic system.
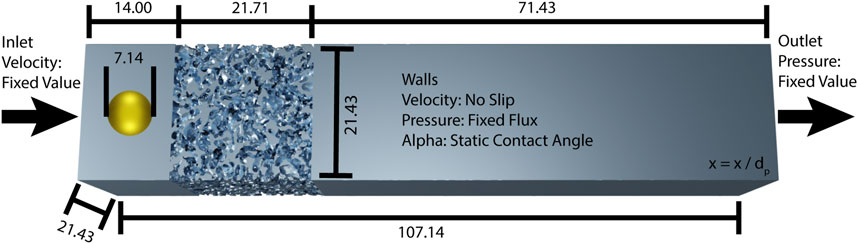
FIGURE 4. Simulation geometry dimensions and OpenFOAM boundary conditions used in the simulations, all other conditions are set to zero gradient. The dimensionless lengths shown are normalized based on the mean pore size (dp).
One main target of the investigation is the analysis of the impact of the static contact angle (material related, not flow dependent) on the droplet behavior in membrane pores. The use of the static instead of a dynamic contact angle means to explicitly investigate the droplet dispersion under constant conditions at the walls without dynamic flow conditions that would be different from one part of the wall to another. Furthermore, dynamic contact angle models such as the Kistler model vary the contact angle based on the local simulated slip or near-wall velocity at the wall region. As such with the high velocities developing within the membrane pores in our simulations, a dynamic contact angle model would most likely lead to a very large effective contact angle close to 180° in all simulations. An oil and water system with Newtonian laminar behavior is simulated, with oil [medium-chain triglycerides (MCTs)] being the dispersed and water the continuous phase. Table 2 lists the physical properties for both substances. The porous membrane system is simulated without gravity (buoyancy) effects. Table 3 contains the relevant dimensionless and characteristic quantities of the system as Reynolds number Re and capillary number Ca calculated using the following equations (see nomenclature for symbol descriptions). Length scales are made dimensionless in terms of
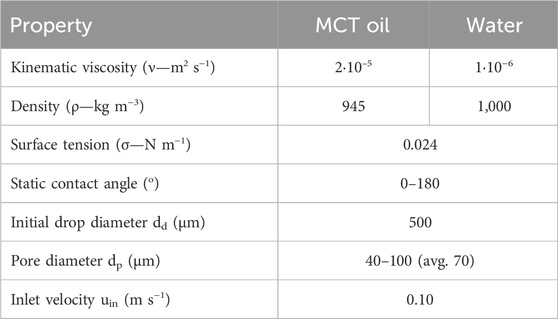
TABLE 2. Physical properties of the simulation system.
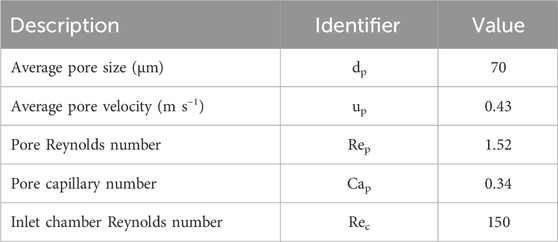
TABLE 3. Dimensionless and characteristic quantities of the simulation system.
3 Results and discussion
This section describes the post-processing routines that are developed in the OpenFOAM environment and the simulation results obtained based on these routines. All evaluation routines detailed below can be found on GitHub at: https://github.com/Leibniz-IWT/IWT-FunctionObjects [30].
3.1 OpenFOAM post-processing routine development
To evaluate the retention and residence time of the dispersed oil phase in the membrane structure, a post-processing routine for OpenFOAM is developed. This routine had to be performant and parallelizable to calculate and output specific information and points during the simulation at a much higher rate than the regular full field output interval.
In the OpenFOAM context, the routine requires four input arguments, namely, the dispersed phase field name, the axis to evaluate positions toward, the start cut-off value (min), and the end cut-off value (max), between which the volume is calculated. Finally, the routine loops over all cells, and for all cells whose coordinate in the specified axis is between the two cut-off values, it sums up the product of the cell volume with the cell alpha fractional value, thus obtaining the volume of the dispersed phase in that cell. In mathematical terms,
A further post-processing routine for OpenFOAM to compute the average velocity inside the porous structure is developed. As with the volume calculation, this routine requires four input arguments, namely, the velocity field name, the axis to evaluate positions toward, the start cut-off value (min), and the end cut-off value (max), between which the velocities of all cells are to be averaged as follows:
For calculating the droplet size distribution, a clustering algorithm approach is used. Since this is a highly performance-limiting method and not easily parallelizable, it is written to use the regular full field output timesteps and apply an averaging approach to obtain the final droplet size distribution from them. The routine requires four input arguments, namely, the average cell size, the dispersed phase field name, a threshold to start a new cluster, a tolerance to accept cells as containing dispersed phase, and optionally, a cut-off value and axis to exclude part of the domain from the calculation to only detect released droplets from the membrane and not dispersed volumes still inside it.
To extract the droplet volumes from the VoF domain and to achieve reasonable computational performance, the developed routine operates in several steps. First, the whole computational domain is scanned, and the cells with an alpha fractional value higher than the set tolerance are selected as containing dispersed phase. The tolerance was set to α = 0.01 (1% dispersed phase) for this work. This reduces the total number of cells the clustering algorithm must operate on significantly improving its speed. The next step involves finding a cell within this reduced dataset with an alpha fractional value higher or equal to the new cluster threshold set to α = 1.00 (100% dispersed phase). From then on, an iterative algorithm searches for all cells within this reduced dataset that are a certain distance and closer to that first selected cell. This distance is set to the average cell edge length increased by a buffer of 5%. This process is repeated until no more cells can be added to the cluster. The now-selected cluster cells comprising the droplet are removed from the dataset, and the process is repeated until all remaining cells have been assigned to droplets. The last step of the routine is to compute the volume of each droplet by summing up the volume of each cell multiplied by the alpha fractional value of that cell. The equivalent droplet diameter is computed assuming that the dispersed volumes released from the membrane form spherical droplets.
Since this approach provides a droplet size distribution of a snapshot of the system at a specific timestep, a sum over multiple such snapshots from different timesteps is required. Dividing each histogram bin by the total number of all droplets measured leads to a percentile-based droplet size distribution with only random numerical noise as the droplets flow through the domain and might be detected in more than one snapshot.
3.2 Simulation results and discussion
In order to evaluate the membrane liquid retention and coalescence rates and the droplet residence time, a multi-step approach is employed. Two sub-domains using the aforementioned post-processing routine to calculate the dispersed phase volume, as depicted in Figure 5A, are used. The first sub-domain is just for the membrane structure, while the second includes the membrane structure with an additional 25% buffer zone at the membrane exit. The buffer zone size was determined in the post-processing stage to be large enough to include all coalesced droplets still connected to the membrane while as small as possible to not include a lot of dispersed droplets flowing out of the membrane. Combining the data from these sub-domains allows for the determination of the properties presented in Figure 5B. In addition and to more clearly visualize these properties, the actual 3D simulation results for three characteristic contact angles are depicted in Figure 6.
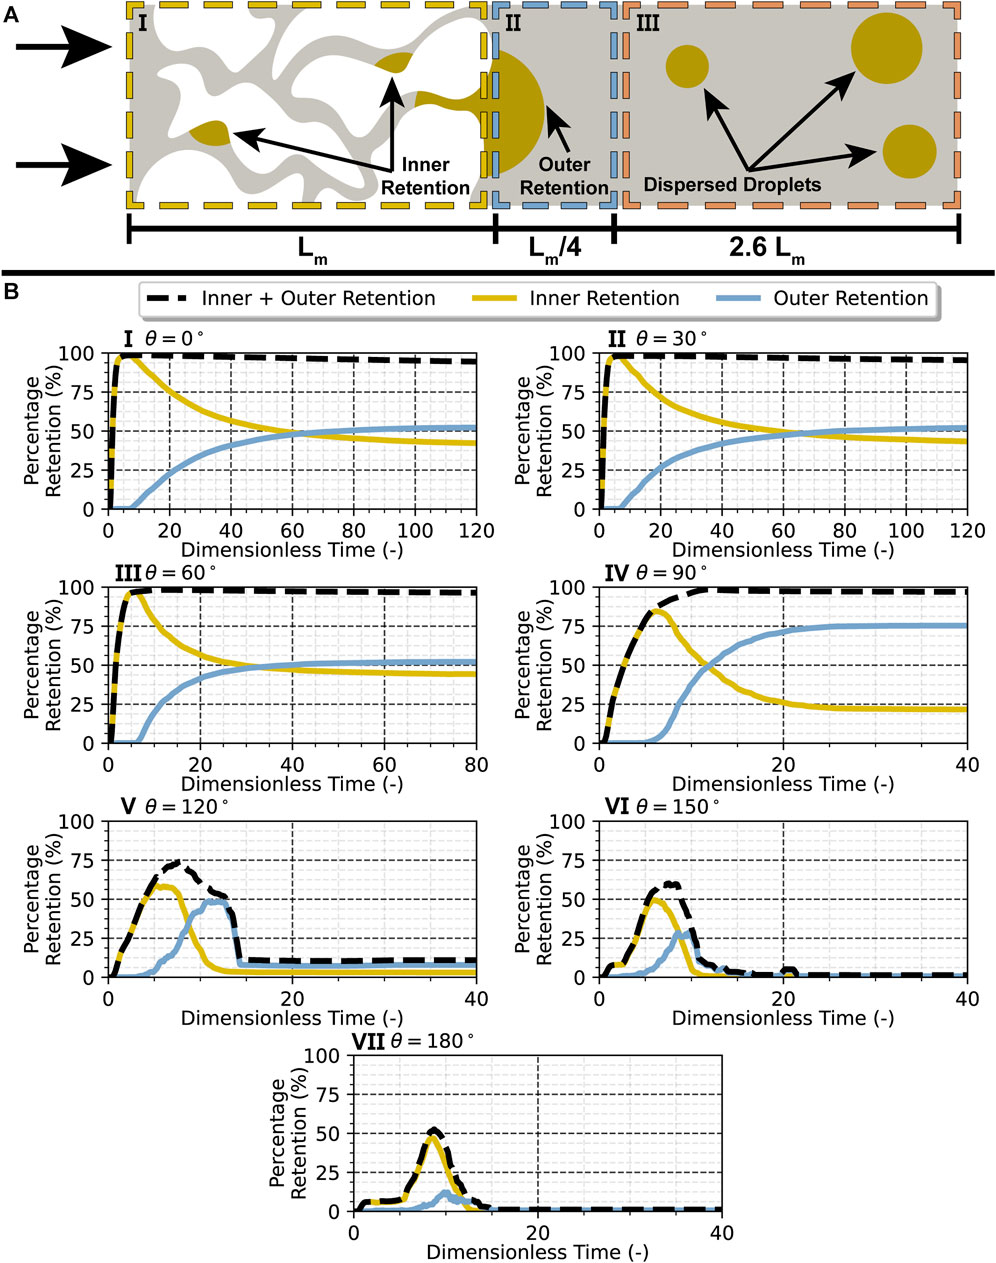
FIGURE 5. (A) Illustrative representation of the oil retention phenomena (inner and outer) and droplet dispersion in a membrane structure, with a representation of the retention analysis volume sub-domains, I) including the membrane structure to account for inner retention, II) including a 25% buffer zone at the outlet to account for outer retention, and III) including the dispersed droplet zone. (B) Percentage of liquid oil droplet retention at an inlet velocity of 0.10 m/s (Rep = 1.52) for a membrane with static contact angles of I) 0°, II) 30°, III) 60°, IV) 90°, V) 120°, VI) 150°, and VII) 180°. Dimensionless time computed as
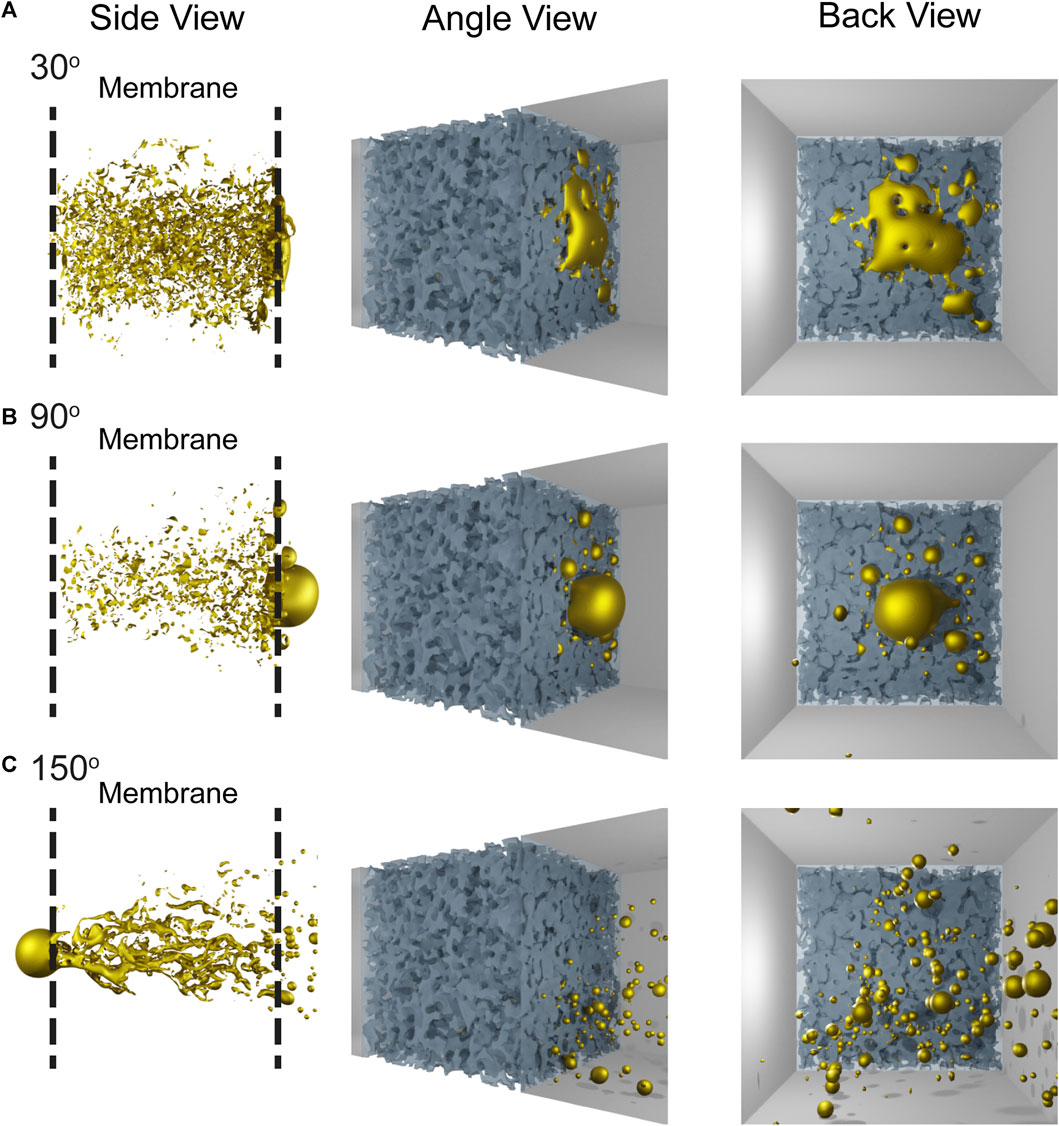
FIGURE 6. Simulation snapshots illustrating the droplet dispersion behavior for a membrane with a static contact angle of (A) 30° (taken at 0.6 s), (B) 90° (taken at 0.2 s), and (C) 150° (taken at 0.04 s).
Starting with the 0–90-degree (hydrophobic/oleophilic) cases, where no or very few droplets are released from the membrane, the retention rate is almost 100% across the board and the residence time infinite since the droplet gets trapped within the membrane.
In Figures 5I–IV, it can be observed that the coalescence/build-up rate at the membrane exit shows overall an exponential increase until it flattens out at approximately 50% of the droplet volume for the first three cases while that increases to 75% of the droplet volume for the 90° contact angle case. This indicates that for contact angles below 60°, approximately half the droplet remains trapped inside the membrane structure while the other half remains at the membrane exit surface. For contact angles close to 90°, a much bigger portion of the droplet manages to flow through the membrane structure only to remain trapped at the membrane exit surface. On the other hand, looking at the cases in Figures 5V–VII with contact angles of 120°–180° (hydrophilic/oleophobic), a retention rate of less than 15% for the first and almost 0% for the last two is observed, meaning that almost all the initial oil volume is released as droplets. Furthermore, the residence time, i.e., the time it takes from the initial droplet entry to reach a constant retention volume in the membrane system, is lower with increasing contact angle, indicating that the more the dispersed phase dislikes the membrane, the faster it flows through it. In these cases, some coalescence at the membrane exit is observed, especially for the 120-degree case, but not in as significant a degree as observed for the previous lower contact angle cases.
These results indicate that the more lipophilic the system is toward the dispersed oil phase, the slower it flows through it and coalesces at the membrane exit, preferring to stay inside the membrane structure. With an increase in the contact angle, this rate increases significantly though again reaching an equilibrium state, as indicated by the observed exponential form. In the system where droplet release occurred (120°–180°), a much sharper entry and exit of the droplet can be observed with minimal retention.
No droplets are released from the membrane at a contact angle below 90°. To obtain the distribution relevant values presented in Table 4 (top section) and visualized in Figure 7, a log-normal fit through the data is performed. In Figure 8, the droplet size distributions obtained from the simulations can be seen. Starting at Figure 8A (contact angle 90°), a much narrower droplet size distribution compared to the more hydrophilic contact angles is obtained. Multiple peaks between 30 and 40 μm can been seen totaling more than 55% of the droplets produced while no droplets larger than 70 μm are produced. Figures 8B–D illustrate much broader distributions for the larger-contact angle cases. In all three of these cases, the main peaks are found at 25–55 μm with a portion of more than B) 70%, C) 60%, and D) 70% of the produced droplets, respectively, within them.
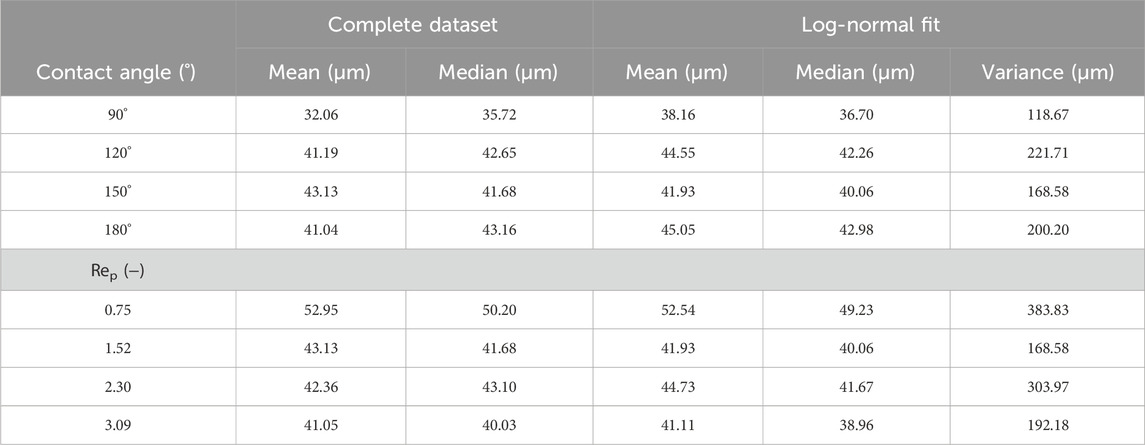
TABLE 4. Characteristic values of the emulsion droplet size distributions for the varying contact angles and pore Reynolds numbers (Rep).
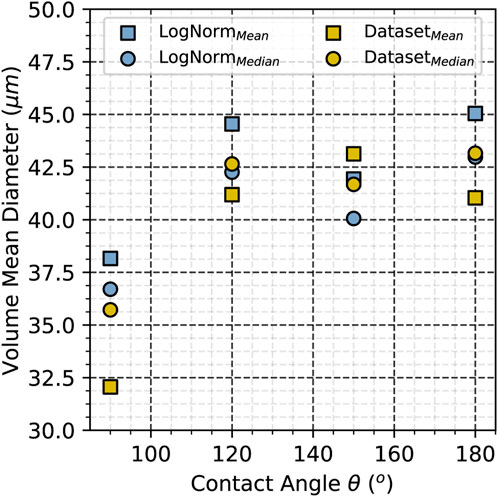
FIGURE 7. Graphical representation of the characteristic droplet size distributions from Table 4 for varying membrane contact angles at an inlet velocity of 0.10 m/s (Rep = 1.52).
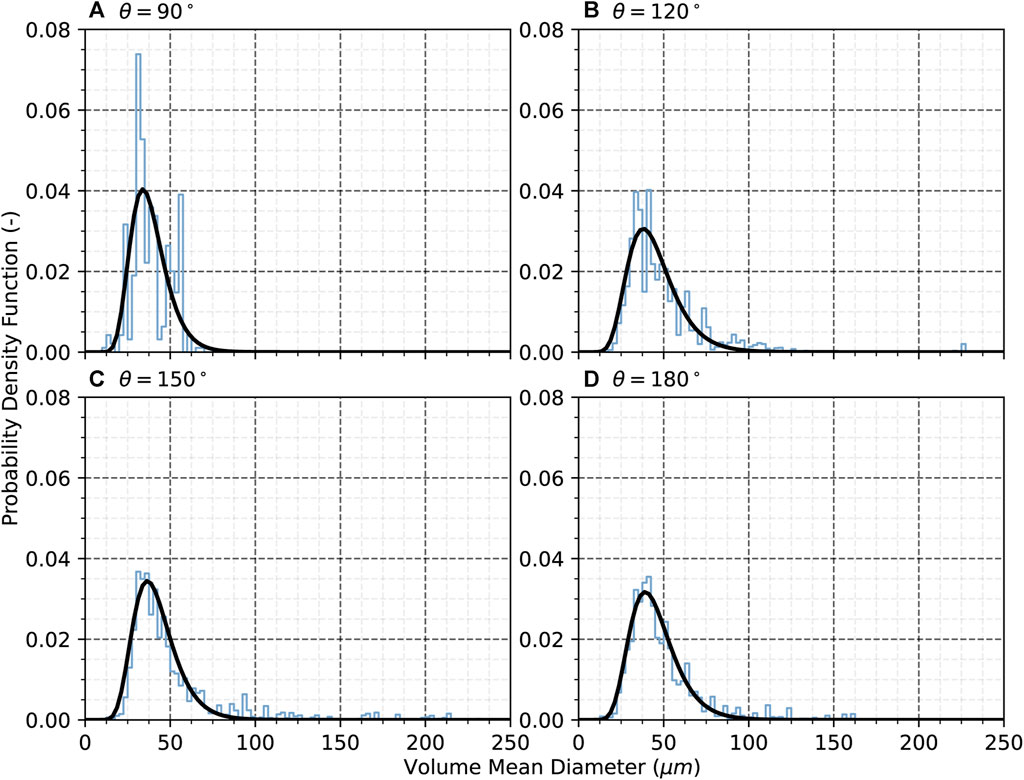
FIGURE 8. Emulsion droplet size distribution for membranes at an inlet velocity of 0.10 m/s (Rep = 1.52) with contact angles of (A) 90°, (B) 120°, (C) 150°, and (D) 180°.
By increasing the hydrophilicity of the membrane, larger droplets start to be produced, while when reaching the limit of superhydrophilicity at 180°, the distribution moves again back to a slightly narrower form. In more specific terms, the largest droplet exiting the membrane is 230 μm in diameter for a contact angle of 120°, 235 μm for a contact angle of 150°, and only 165 μm for a contact angle of 180°. The highest spread in sizes could be observed in the 150° membrane case, while the more consistent production of sizes can be observed at 180° with fewer but higher peaks for the larger droplet sizes.
These results provide an insight into the emulsification process indicating that to obtain a product emulsion at constant and relatively low-pressure conditions, the membrane wettability should be -philic to the continuous phase and -phobic to the dispersed phase, in terms of this work hydrophilic/oleophobic for an oil/water system.
The volumetric continuous phase flow rate, respectively the water inlet velocity of the simulation, has been varied while keeping the membrane contact angle constant at 150°, resulting in an alteration of the pressure drop through the membrane structure. Applying the same droplet volume retention analysis as before, we obtained relevant information on the dynamics of the emulsification process. As depicted in Figure 9, with an increase in the pore Reynolds number, the retention curve shifts to the left toward shorter time intervals for the process to be completed. The maximum height of the curves, on the other hand, changes slightly based on the pore Reynolds number. At the lower end for a pore Reynolds number of 0.75, it is observed that the droplet slowly enters the membrane structure, and at any time, approximately 25% of the dispersed droplet is inside the membrane until the emulsification process finishes. We also observe a slightly higher final retention than in the other three cases. At higher pore Reynolds numbers, the dispersed phase stays for shorter times inside the membrane. Approximately 50% of the dispersed phase is inside the membrane at the curve peak during this shorter period.
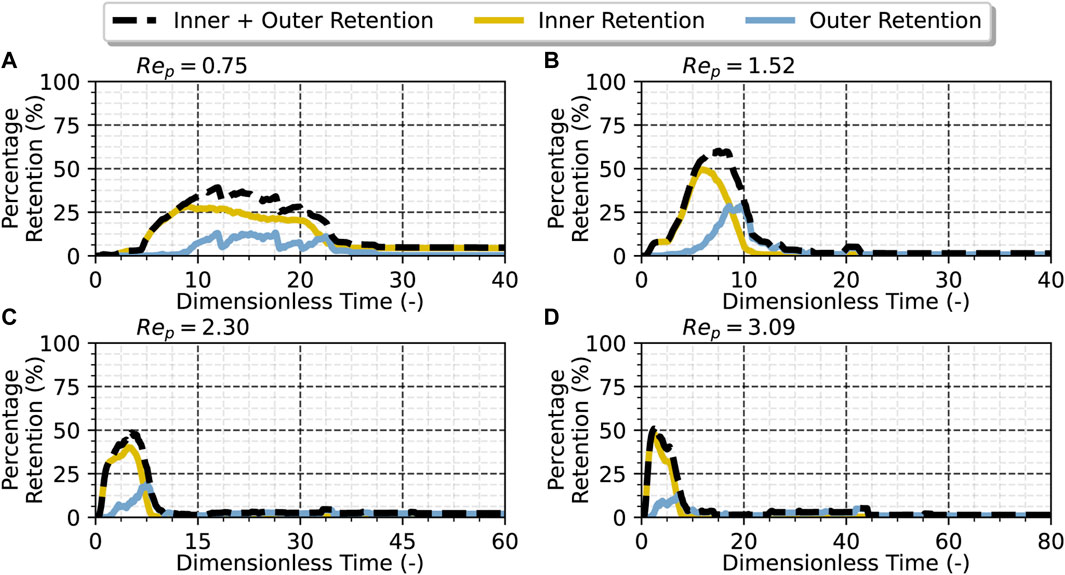
FIGURE 9. Percentage of liquid oil droplet retention for a membrane with a static contact angle of 150° at varying pore Reynolds numbers. (A) 0.75, (B) 1.52, (C) 2.30, and (D) 3.09. Dimensionless time is computed as
Table 5 contains the values illustrated in Figure 10, showing a power law relationship between the pore Reynolds number (i.e., the velocity) and the pressure drop through the membrane structure as has also been observed in other membrane studies [31–33].
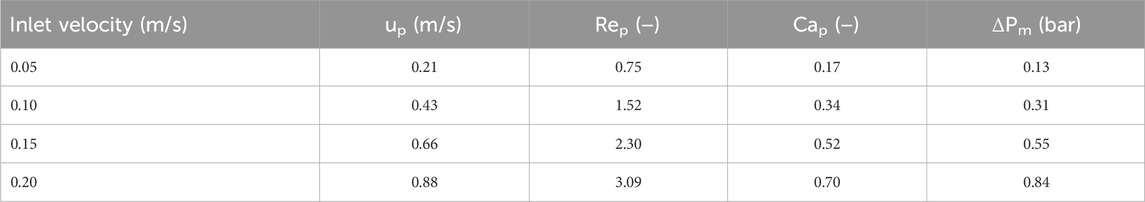
TABLE 5. Dimensionless and characteristic quantities of the velocity-varied simulation system.
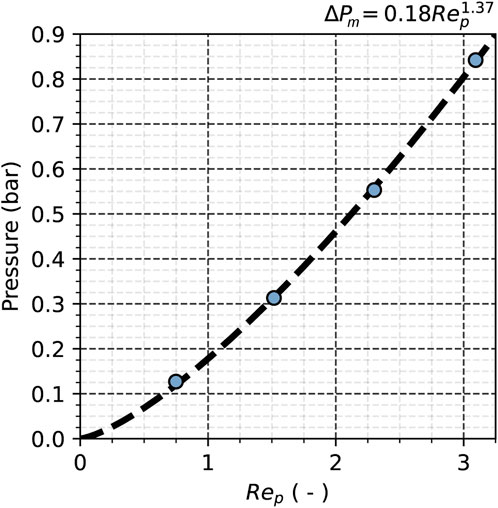
FIGURE 10. Pressure drop through the membrane structure for the simulated pore Reynolds numbers at a static contact angle of 150°.
Using the same log-normal fit, the second half of the data in Table 4 are obtained and visualized in Figure 11. In conjunction with Figure 7, Figure 11 shows that the mean and median values from the complete simulation data as well as those of the performed log-normal fit follow similar trends with the droplet size distribution shifting to higher values as the contact angle increases and lower values as the pore Reynolds number increases. From the relative steepness of the data, it can be deduced that the pore Reynolds number has a much more direct impact on the droplet size than the contact angle.
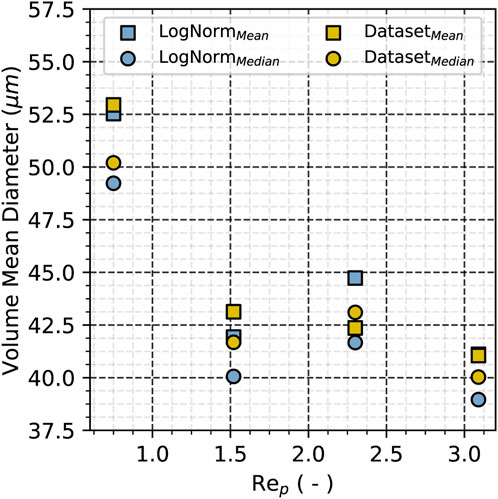
FIGURE 11. Graphical representation of the characteristic droplet size distributions from Table 4 for varying pore Reynolds numbers at a static contact angle of 150°.
The droplet size distribution analysis in Figure 12 for these simulations is carried out with the same log-normal fit procedure, showing that as the inlet velocity increases, the average droplet obtained becomes increasingly smaller starting at approximately 45 μm down to approximately 36 μm. On the other hand, the standard deviations of these distributions show no clear trend, leading to the conclusion that inducing a higher pressure drop in the premix emulsification process has no direct impact on the broadness of the distribution for the Reynolds number range studied.
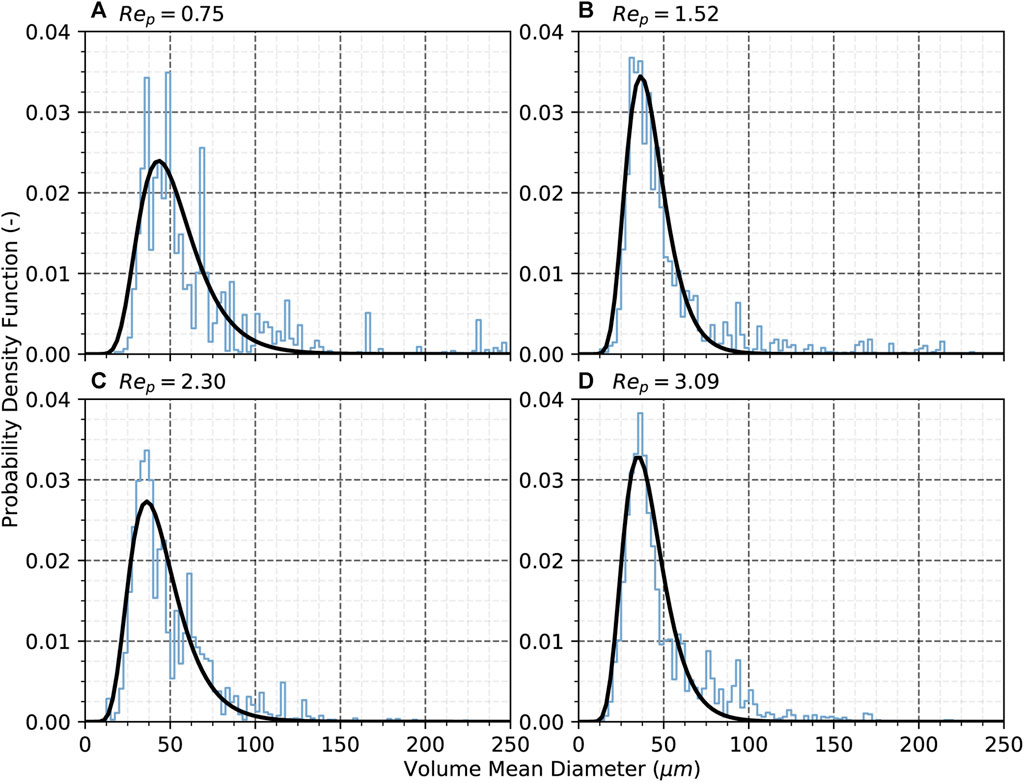
FIGURE 12. Droplet size distributions for membranes with a contact angle of 150° at varying pore Reynolds numbers: (A) 0.75, (B) 1.52, (C) 2.30, and (D) 3.09.
4 Conclusion
A set of droplet emulsification simulations in a porous membrane of varying surface activities are presented and evaluated. Through these simulations, by varying the system static contact angle, several key observations for tailoring the dispersion process can be made. The simulations show, in accordance to existing published data, that the membrane wettability is a key factor for determining the type of process as emulsification or filtration [9].
At small contact angles (0°–90°), the membranes have a high affinity for liquid/liquid filtration with liquid retention in the membrane, while at contact angles (90°–180°), the membrane shows a higher affinity for emulsification. Moreover, at low contact angles, the build-up and coalescence at the membrane exit show an approximately 50/50% droplet retainment ratio outside and inside the membrane structure, while at higher contact angles, it evolves to a 75/25% ratio for filtration before breaking pattern when the membrane behavior switches to droplet production and emulsification.
Higher contact angles result in broader distributions of the droplet size as well as droplets of larger sizes, and this pattern breaks once superhydrophilicity is reached, where the droplet size distribution becomes narrower with the maximum droplet size decreasing from a contact angle of 150° to 180°. On the other hand, higher inlet velocities and as such membrane pressure drops also do impact the emulsion droplet size and the width of the produced droplet size distributions, with the highest values resulting in the narrowest and smallest droplets and vice versa.
It is important to note the limitations of this study with regard to the distinct static contact angles used. In this work, we conducted simulations for contact angles ranging from 0° to 180°, covering the whole hydrophilicity/hydrophobicity spectrum. We performed so in 30° intervals, which is a good indicator of the system behavior at various states. However, details about the limit of the filtration/emulsification process switch point at 90° require further simulations. Here, simulations with a dynamic contact angle model may provide valuable insights into the emulsification and filtration processes. The mesh resolution used is sufficient for VoF simulation standards and describes the real membrane structure with adequate accuracy. However, as can be seen from the mesh independence study, some resolution is still lost in comparison to the real system. Through this analysis, valuable insights into the liquid membrane emulsification and filtration processes could be obtained, highlighting the central role of the membrane wettability in the prospect of helping to tailor the membrane properties for specific processes.
Data availability statement
The data that support the findings of this study are openly available in Zenodo at https://doi.org/10.5281/zenodo.7622276.
Author contributions
AK: conceptualization, data curation, formal analysis, investigation, methodology, software, visualization, writing–original draft. PG: validation, writing–review and editing. UF: funding acquisition, project administration, resources, supervision, writing–review and editing.
Funding
The authors declare that financial support was received for the research, authorship, and/or publication of this article. This project was funded by the German Research Foundation (DFG) within the Research Training Group (GRK) 1860 MIMENIMA (micro-, meso-, and macroporous nonmetallic materials: fundamentals and applications). The resources for the numerical simulations were provided by the North-German Supercomputing Alliance (HLRN) under Grant No. hbi00036 as well as MIMENIMA through their own cluster administered by the Centre of Applied Space Technology and Microgravity (ZARM).
Conflict of interest
The authors declare that the research was conducted in the absence of any commercial or financial relationships that could be construed as a potential conflict of interest.
Publisher’s note
All claims expressed in this article are solely those of the authors and do not necessarily represent those of their affiliated organizations, or those of the publisher, the editors, and the reviewers. Any product that may be evaluated in this article, or claim that may be made by its manufacturer, is not guaranteed or endorsed by the publisher.
References
1. Anis SF, Hashaikeh R, Hilal N. Microfiltration membrane processes: a review of research trends over the past decade. J Water Process Eng (2019) 32:100941. doi:10.1016/j.jwpe.2019.100941
2. Chamberland J, Brisson G, Doyen A, Pouliot Y. Innovations from pressure-driven membrane processes in cheese technology: from milk protein concentrates to sustainability and precision cheesemaking. Curr Opin Food Sci (2022) 48:100948. doi:10.1016/j.cofs.2022.100948
3. Das B, Chakrabarty B, Barkakati P. Preparation and characterization of novel ceramic membranes for micro-filtration applications. Ceramics Int (2016) 42(13):14326–33. doi:10.1016/j.ceramint.2016.06.125
4. Zhang X, Fang D, Lin B, Dong Y, Meng G, Liu X. Asymmetric porous cordierite hollow fiber membrane for microfiltration. J Alloys Comp (2009) 487(1–2):631–8. doi:10.1016/j.jallcom.2009.08.028
5. Putatunda S, Bhattacharya S, Sen D, Bhattacharjee C. A review on the application of different treatment processes for emulsified oily wastewater. Int J Environ Sci Tech (2019) 16(5):2525–36. doi:10.1007/s13762-018-2055-6
6. Fakhru’l-Razi A, Pendashteh A, Abdullah LC, Biak DRA, Madaeni SS, Abidin ZZ. Review of technologies for oil and gas produced water treatment. J Hazard Mater (2009) 170(2–3):530–51. doi:10.1016/j.jhazmat.2009.05.044
7. Wang C, Lü Y, Song C, Zhang D, Rong F, He L. Separation of emulsified crude oil from produced water by gas flotation: a review. Sci Total Environ (2022) 845:157304. doi:10.1016/j.scitotenv.2022.157304
8. Yao S, Costello M, Fane AG, Pope JM. Non-invasive observation of flow profiles and polarisation layers in hollow fibre membrane filtration modules using NMR micro-imaging. J Membr Sci (1995) 99(3):207–16. doi:10.1016/0376-7388(94)00219-O
9. Shirzadi M, Ueda M, Hada K, Fukasawa T, Fukui K, Mino Y, et al. High-resolution numerical simulation of microfiltration of oil-in-water emulsion permeating through a realistic membrane microporous structure generated by focused ion beam scanning electron microscopy images. Langmuir (2022) 38(6):2094–108. doi:10.1021/acs.langmuir.1c03183
10. Ueda M, Rozy MIF, Fukasawa T, Ishigami T, Fukui K. Phase-field simulation of the coalescence of droplets permeating through a fibrous filter obtained from X-ray computed Tomography images: effect of the filter microstructure. Langmuir (2020) 36(17):4711–20. doi:10.1021/acs.langmuir.0c00640
11. Ueda M, Fukasawa T, Ishigami T, Fukui K. Effect of surface wettability on droplet coalescence and pressure drop in a fibrous filter: direct numerical simulation coordinated with X-ray computed Tomography images. Ind Eng Chem Res (2021) 60(10):4168–79. doi:10.1021/acs.iecr.0c06157
12. Kagawa Y, Ishigami T, Hayashi K, Fuse H, Mino Y, Matsuyama H. Permeation of concentrated oil-in-water emulsions through a membrane pore: numerical simulation using a coupled level set and the volume-of-fluid method. Soft Matter (2014) 10(40):7985–92. doi:10.1039/C4SM00705K
13. Liu X, Xiao C, Deng H, Zhang T, Huang Y. An experimental and modeling investigation of the behaviors of solution in fluoropolymers hollow fiber membranes (HFMs). J Membr Sci (2023) 671:121421. doi:10.1016/j.memsci.2023.121421
14. Sadowski W, Sayyari M, di Mare F, Marschall H. Large eddy simulation of flow in porous media: analysis of the commutation error of the double-averaged equations. Phys Fluids (2023) 35(5). doi:10.1063/5.0148130
15. Miliani S, La Rocca M, Montessori A, Prestininzi P. Assessing the mobilization of trapped mass of emulsions flowing in an idealized pore using the lattice Boltzmann method. Transport in Porous Media (2023) 149:579–98. doi:10.1007/s11242-023-01959-9
16. Wei B, Hou J, Sukop MC, Du Q, Wang H. Flow behaviors of emulsions in constricted capillaries: a lattice Boltzmann simulation study. Chem Eng Sci (2020) 227:115925. doi:10.1016/j.ces.2020.115925
17. Zhang J, Yu X, Tu S-T. Lattice Boltzmann simulation on droplet flow through 3D metal foam. Processes (2019) 7(12):877. doi:10.3390/pr7120877
18. Staszak M. Modeling and simulation of membrane process. Phys Sci Rev (2017) 2(6). doi:10.1515/psr-2017-0023
19. Sutrisna PD, Kurnia KA, Siagian UWR, Ismadji S, Wenten IG. Membrane fouling and fouling mitigation in oil–water separation: a review. J Environ Chem Eng (2022) 10(3):107532. doi:10.1016/j.jece.2022.107532
20. Tummons E, Han Q, Tanudjaja HJ, Hejase CA, Chew JW, Tarabara VV. Membrane fouling by emulsified oil: a review. Sep Purif Tech (2020) 248:116919. doi:10.1016/j.seppur.2020.116919
21. Weller HG, Tabor G, Jasak H, Fureby C. A tensorial approach to computational continuum mechanics using object-oriented techniques. Comput Phys (1998) 12(6):620–31. doi:10.1063/1.168744
22. Roenby J, Bredmose H, Jasak H. A computational method for sharp interface advection. R Soc Open Sci (2016) 3(11):160405. doi:10.1098/rsos.160405
23. Connington K, Lee T. A review of spurious currents in the lattice Boltzmann method for multiphase flows. J Mech Sci Tech (2012) 26(12):3857–63. doi:10.1007/s12206-012-1011-5
24. Giefer P, Kyrloglou A, Fritsching U. Impact of wettability on interface deformation and droplet breakup in microcapillaries. Phys Fluids (2023) 35(4):042110. doi:10.1063/5.0135101
25. Raeini AQ, Blunt MJ, Bijeljic B. Modelling two-phase flow in porous media at the pore scale using the volume-of-fluid method. J Comput Phys (2012) 231(17):5653–68. doi:10.1016/j.jcp.2012.04.011
26. Helmers T, Kemper P, Thöming J, Mießner U. Determining the flow-related cap deformation of Taylor droplets at low Ca numbers using ensemble-averaged high-speed images. Experiments in Fluids (2019) 60(7):113. doi:10.1007/s00348-019-2757-7
27. Community BO. Blender - a 3D modelling and rendering package (2018). Available at: http://www.blender.org.
28. Roache PJ. Perspective: a method for uniform reporting of grid refinement studies. J Fluids Eng (1994) 116(3):405–13. doi:10.1115/1.2910291
29. Wollborn T, Giefer P, Kieserling H, Wagemans AM, Drusch S, Fritsching U. Investigation of local and temporal interfacial shear stress distribution during membrane emulsification. Can J Chem Eng (2022) 100(5):1061–78. doi:10.1002/cjce.24186
30. Kyrloglou A, Fritsching U. Leibniz-IWT/IWT-FunctionObjects: IWT-FunctionObjects. Zenodo (2023). doi:10.5281/zenodo.7622276
31. Gao S, Zhong C, Wang Z. A model describing the pressure drops across the membrane and cake layers for constant flux cross-flow microfiltration process. J Environ Chem Eng (2022) 10(3):107984. doi:10.1016/j.jece.2022.107984
32. Hartinger M, Heidebrecht H-J, Schiffer S, Dumpler J, Kulozik U. Technical concepts for the investigation of spatial effects in spiral-wound microfiltration membranes. Membranes (2019) 9(7):80. doi:10.3390/membranes9070080
33. Masdiana N, Rashid M, Norruwaida J, Hajar S, Nabila Z, Ammar MR. Utilising formulated filter aids for toluene removal in filtration plant. IOP Conf Ser Earth Environ Sci (2020) 476(1):012123. doi:10.1088/1755-1315/476/1/012123
Nomenclature

Keywords: multiphase flow, emulsification, filtration, membrane flow, droplet coalescence, permeability, OpenFOAM, volume of fluid
Citation: Kyrloglou A, Giefer P and Fritsching U (2024) Numerical simulation of droplet dispersion within meso-porous membranes. Front. Phys. 12:1282122. doi: 10.3389/fphy.2024.1282122
Received: 23 August 2023; Accepted: 22 January 2024;
Published: 14 February 2024.
Edited by:
Grazia Lamanna, University of Stuttgart, GermanyReviewed by:
Marc Pradas, The Open University, United KingdomCarole Planchette, Graz University of Technology, Austria
Copyright © 2024 Kyrloglou, Giefer and Fritsching. This is an open-access article distributed under the terms of the Creative Commons Attribution License (CC BY). The use, distribution or reproduction in other forums is permitted, provided the original author(s) and the copyright owner(s) are credited and that the original publication in this journal is cited, in accordance with accepted academic practice. No use, distribution or reproduction is permitted which does not comply with these terms.
*Correspondence: Apostolos Kyrloglou, YS5reXJsb2dsb3VAaXd0LnVuaS1icmVtZW4uZGU=