
94% of researchers rate our articles as excellent or good
Learn more about the work of our research integrity team to safeguard the quality of each article we publish.
Find out more
ORIGINAL RESEARCH article
Front. Phys., 22 June 2023
Sec. Radiation Detectors and Imaging
Volume 11 - 2023 | https://doi.org/10.3389/fphy.2023.952103
There is a growing interest in photoplethysmography (PPG) for the continuous monitoring of cardio-respiratory signals by portable instrumentation aimed at the early diagnosis of cardiovascular diseases. In this context, it is conceivable that PPG sensors working at different wavelengths simultaneously can optimize the identification of apneas and the quantification of the associated heart-rate changes or other parameters that depend on the PPG shape (e.g., systematic vascular resistance and pressure), when evaluating the severity of breathing disorders during sleep and in general for health monitoring. Therefore, the objective of this work is to present a novel pulse oximeter that provides synchronous data logging related to three light wavelengths (green, red, and infrared) in transmission mode to optimize both heart rate measurements and a reliable and continuous assessment of oxygen saturation. The transmission mode is considered more robust over motion artifacts than reflection mode, but current pulse oximeters cannot employ green light in transmission mode due to the high absorbance of body tissues at this wavelength. For this reason, our device is based on a Single-Photon Avalanche Diode (SPAD) with very short deadtime (less than 1 ns) to have, at the same time, the single photon sensitivity and high-count rate that allows acquiring all the wavelengths of interest on the same site and in transmission mode. Previous studies have shown that SPAD cameras can be used for measuring the heart rate through remote PPG, but oxygen saturation and heart-rate measures through contact SPAD-based PPG sensors have never been addressed so far. The results of the preliminary validation on six healthy volunteers reflect the expected physiological phenomena, providing rms errors in the Inter Beat Interval estimation smaller than 70 ms (with green light) and a maximum error in the oxygen saturation smaller than 1% during the apneas. Our prototype demonstrates the reliability of SPAD-based devices for continuous long-term monitoring of cardio-respiratory variables as an alternative to photodiodes especially when minimal area and optical power are required.
In recent years, the interest in photoplethysmography (PPG) for cardiovascular monitoring is rapidly increasing. This is due to the possibility to design wearable sensors for long-term recordings [1] and to derive information on different aspects of cardiovascular health, like autonomic regulation, vascular aging [2], and cardio-respiratory interactions [3]. Wearable PPG systems are particularly interesting for detecting apneas/hypopneas during sleep. Indeed, Obstructive Sleep Apnea/Hypopnea Syndrome is the second most common disease among respiratory disorders, affecting 2%–4% of the adult population. It is associated with inadequate ventilation during sleep and may have neurobehavioral and cardiovascular consequences. Polysomnography is required for investigating this disorder. However, portable PPG systems using lights at red and infrared (IR) wavelengths, which have different absorption in oxygenated and deoxygenated hemoglobin, can measure the oxygen saturation in the blood and be used over large populations for screening this disease with acceptable results in moderate and severe patients [4]. Portable PPG devices can also measure the heart rate beat by beat as the interval between changes in light intensity after each cardiac contraction [5]. This makes it possible to quantify the activation of the autonomic nervous system induced by sleep apneas through methods of heart rate variability.
PPG-based devices have two operation modes: transmission and reflection [1]. In transmission, the light travels through the tissue and reaches a photodetector (PD) set opposite to the light source; in reflection, the PD is alongside the LED and detects the light that is backscattered or reflected by tissues or bones. Reflective PPGs are susceptive to saturation since there could be an air gap between the skin surface and the optical components creating a direct path between source and receiver. To reduce this effect, highly focused LED and PD with a narrow field-of-view are used in reflection mode, making the system more prone to disturbances and motion artifacts [6]. Conversely in transmission mode, the LED irradiates with a more diffuse beam and the light crosses the entire finger section increasing the probability to interact with arteries and consequently the quality of the signal and the immunity to disturbances [7].
Due to the increasing use of PPG in portable instrumentation, numerous studies have investigated the different behavior of green, blue, red, and IR light [8–11]. Red and IR illuminations are necessary to estimate the blood oxygen saturation, however, the PPG green wavelength is generally preferred for heart rate estimation because less sensitive to motion artifacts [8, 12] and skin type and color [13]. Thus, PPG sensors working at different wavelengths simultaneously (red, IR, and green) may optimize the detection of apneas and the quantification of the associated heart rate changes when evaluating the severity of breathing disorders during sleep and in general for health monitoring.
Although red and IR wavelengths have been employed in both reflection and transmission mode, to the best of our knowledge green and blue wavelengths were not used in transmission since the intensity of the transmitted light at these wavelengths is considered too weak for traditional photodiodes due to the high absorbance of body tissues [8]. Our work aims to fill this gap, developing an instrument that exploits not only red and IR, but also green light in transmission mode, enabling, in future researches, to perform a fair comparison between the different wavelengths in the same optical scheme.
For this aim, we considered an emerging technology in photodetection: the Single-Photon Avalanche Diode (SPAD). SPAD detectors have different working principles compared to p-i-n photodiodes, typically used in oximeters. When the SPAD detects a photon, a charge carrier avalanche is initiated, generating a digital pulse [14], which can be counted or time-stamped. SPADs are commonly manufactured in standard CMOS processes, allowing the integration of detectors front-end, and processing circuitry in a single, low-cost monolithic Integrated Circuits (IC) [15]. SPADs being single photon detectors, have higher sensitivity (defined as the minimum signal which can be detected) than photodiodes which are limited by readout noise. Thus, they allow the integration of an active area much smaller (10–100 µm diameter) than the photodiodes active area (a few millimeters side) and the SPADs intrinsically digital output and high sensitivity ease the requirements in terms of emitted light power and electronic noise. However, a smaller active area also translates to a lower signal collection and less robustness to motion artifacts. The SPAD front-end provides a digital pulse each time the SPAD is triggered, thus only a counter is needed to measure the light intensity, instead of the transimpedance amplifier and analog-to-digital converter required by photodiode-based devices. Thus, SPADs may allow the development of devices significantly smaller than photodiode-based oximeters.
Another drawback of SPADs compared to p-i-n photodiodes is the dead time of some nanoseconds after each photon detection. The dead time is needed to avoid after-pulsing (i.e., detector retriggering due to charges trapped in the Silicon reticle during the previous avalanche) and limits the count rate to hundreds of mega counts per second.
This work aims to demonstrate the feasibility of monitoring cardiorespiratory interactions during apneas by employing an innovative three-wavelength, SPAD-based, PPG sensor. The use of three wavelengths in the same device appears particularly useful in sleep apnea studies to derive independent clinically valuable information. In fact, the red and IR wavelengths can measure blood oxygen saturation effectively due to the different extinction coefficient for oxyhemoglobin and deoxyhemoglobin of these two wavelengths, while the green light, much less sensitive to the blood oxygen desaturations which follow sleep apneas, may optimize the measure of heart rate. Having a single device able to acquire the three wavelengths, simplify the set-up and avoid any synchronization issue. A previous study showed that SPAD cameras can be used for measuring the heart rate through remote PPG [16], but oxygen saturation and heart rate measures through contact SPAD-based PPG sensors have never been addressed so far. Thanks to the digital nature of SPAD output, analog front-ends are not necessary, removing a possible source of electronic noise and disturbances. This can lead to the engineering of a single chip integrating both the SPAD and the needed electronics, in a significantly smaller device compared with traditional PPG sensors. A comparison between SPAD-based and photodiode-based PPGs will be objective of a future study, since it involves many tradeoffs and the choice criteria are not trivial.
The paper is organized as follows: Section 2 describes our multiwavelength SPAD pulse oximeter, its operation modality, and the results of the system characterization. Section 3 presents a preliminary validation on volunteers. Conclusive considerations are provided in Section 4.
The 3-wavelength pulse oximeter is based on three separate Printed Circuit Boards (PCBs). A small flexible PCB (80 × 16 mm2) houses three surface-mounted LEDs and the SPAD chip. It communicates, through a flexible cable, with a microcontroller development board (70 × 80 mm2), and with an additional PCB (75 × 92 mm2) to generate the required power supplies. Figure 1 shows the complete 3-wavelength pulse oximeter (a), with a zoom on the LEDs and SPAD-chip flexible board (b). The complete system results bulkier than commercial oximeters since it has been developed as a proof of principle based on a commercial microcontroller development board. Further development will include the customization and engineering of the entire system, to make it compact and light.
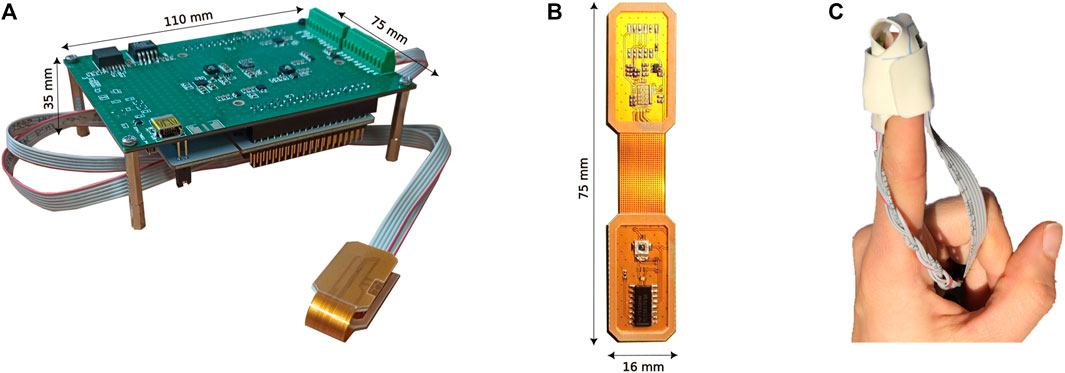
FIGURE 1. Picture of the complete 3-wavelength Pulse Oximeter (A), LEDs, and SPAD chip flexible board with an epoxy resin coating for use in transmission mode (B), and probe placement on the finger (C).
Figure 2 shows the main blocks and signals of the prototype. All the power rails are generated by the power board starting either from the 5 V supply of the microcontroller board or from an external 3.7 V lithium-ion battery. The power board also hosts a circuit dedicated to recharging the battery and interfaces the LEDs and the SPAD PCB with the microcontroller. An SMA connector on the board may be employed either as digital input or output to synchronize other medical equipment.

FIGURE 2. Block representation of the main components of the system, the principal signals are shown.
A low-cost commercial microcontroller board (STM32 NUCLEO-F401RE, ST Microelectronics) is employed to ease the prototyping and testing phase. Its core is an ARM Cortex -M4 32-bit RISC processor operating at 84 MHz maximum clock frequency, and it is connected to the power board through two 2.54 mm-pin strips. At the beginning of the acquisition, the NUCLEO board sends through a Serial Peripheral Interface (SPI) the desired current settings. The user can select the integration time for each LED by programming the period of the Pulse-Width Modulation (PWM) generator. The PWM rising edge is used for enabling the selected output channels while the falling edge for configuring the following LED pattern.
The three surface-mounted LEDs (525, 650, and 940 nm wavelengths) and a LED driver are set on the upper part of the flex PCB in Figure 1B. In our application, the LED driver is configured by the microcontroller to deliver a constant current (from 5 mA to 120 mA) to only one LED at a time since each output is independently enabled and disabled.
The lower part of the flex PCB in Figure 1B hosts a SPAD chip realized in a 160 nm Bipolar CMOS DMOS (BCD) technology [17]. The chip has been resin-coated to avoid possible damages due to direct finger contact.
Due to the large difference in the absorbance of the light in the green and red regions, a wide dynamic range is needed for acquiring all three wavelengths with the same detector. This makes a photodiode not suitable for the application (the readout noise limits the acquisition of low-level signals) and requires a SPAD to have a low dead time to increase the maximum count rate for red and IR.
The employed SPAD chip architecture is purposely optimized to obtain both low dead time (<1 ns) and low afterpulsing probability (<0.14%) allowing high count rate operations. It integrates a 30 µm round SPAD, and its sensing and readout electronics [18]. Given the limited bandwidth (roughly 200 MHz) of the chip output buffers, which have to charge the pads and external electronics capacitances, the output signal has been multiplexed among three output pads connected in a daisy chain, and both the rising and falling edges of the outputs correspond to one photon detection. Only one output is read in our system since the application does not require single-photon precision (an error of at most 5 photons is absolutely in the target application). Exploiting the microcontroller’s timing peripherals, the number of SPAD pulses in a fixed integration time are counted synchronously with the LEDs on/off periods, thus providing three output time traces, one for each LED illumination, proportional to the light intensity detected by the SPAD.
The PWM rising edge triggers a peripheral-to-memory Direct Memory Access (DMA) request (i.e., the photon counts are stored in the memory). DMA is used for providing high-speed data transfer between peripheral and memory without any CPU action, keeping CPU resources free for other operations. After acquiring all LEDs counts, the data are sent by USB link to the computer, where a LabView VI generates a text file used for post-processing the data at a later stage.
Transmission-mode devices are more used in the clinical field, with respect to reflection-mode devices, because more robust over motion artifacts and pressure disturbances [6]. However, the measurement sites are restricted to the fingertip and earlobe since light has a limited penetration depth into the biological tissue. The 3-wavelength pulse oximeter operates in transmission mode and is set around the patient finger, with the LEDs placed on the index fingertip of the subject’s left hand, as suggested in the literature [19]. The light travels from the LEDs through the digital artery and reaches the SPAD placed on the opposite part of the finger. During the measurement, the LEDs board and the SPAD chipboard are arranged in a disposable patch (Figure 1C), guaranteeing the correct positioning on the finger. To shield the device from external illumination, the finger is covered with a black cloth, which prevents external lights to affect the signal. Experimental measurements have demonstrated that ambient light contribution is negligible and there is no need for dark subtraction, thus the integration time can be maximized.
Wavelengths between 500 and 600 nm have a much higher molar extinction coefficient for both oxyhemoglobin (HbO2) and deoxyhemoglobin (Hb), when compared to red and IR light [20, 21], therefore, green LEDs measure the largest variation during the cardiac cycle [22]. For this reason, in recent years, the usage of a green LED has become increasingly popular in clinical and commercial wearable PPG devices [10]. Pulse oximeters, instead, use two light sources with different wavelengths to monitor oxygen saturation: a red LED at 640 nm, and an IR LED at 940 nm. HbO2 absorbs more IR than red light while Hb absorbs more red light than IR light, allowing the estimation of blood saturation [23]. Besides the different absorption coefficients, the choice of red and IR light is supported by their high penetration depth in biological tissues [20, 21]. Thus, we employed a 525 nm LED to measure the heart rate (HR), 650 and 940 nm LEDs to assess the oxygen saturation.
According to the measurement conditions and subject characteristics, the system parameters (i.e., LED current, integration time, and SPAD dead time) can be adjusted through a LabVIEW Graphical User Interface (GUI). We set a 1.3 ms integration time for each LED to comply with the 250 Hz sampling frequency of standard electrocardiograms and 2.5 ns SPAD dead time to ensure the correct sampling of the output waveform by the microcontroller [24]. Red and IR LEDs were driven with 10 mA currents while a 40 mA current was used for the green LED due to the higher tissue absorbance. The LabView GUI displays the time trace proportional to the light intensity detected by the SPAD (i.e., the PPG signal) in real-time saving the data for post-processing.
Due to the SPAD dead time, the sensor saturates for count rates approaching the inverse of the hold-off time. Saturation can be compensated by assuming a constant rate during the integration window and a stable dead time [25], by the following equation:
where
This Section experimentally characterizes the performance of our pulse oximeter prototype in terms of noise contribution, sensor efficiency, and LED stability. The major noise sources in SPADs are the dark counts, expressed as Dark Count Rate (DCR, i.e., the frequency of not photon-related avalanches), which varies with temperature and SPAD excess bias. The DCR of the SPAD employed in our design has been experimentally measured in standard application conditions (device mounted on the fingertip, with 5 V excess bias), obtaining 350 cps (counts per second), a negligible value compared to expected signal intensity in the order of 106 cps.
The Photon Detection Probability (PDP) of the sensor (i.e., the probability that the SPAD detects an impinging photon) has a significant impact on the Signal to Noise Ratio (SNR) of the PPG signal:
where ɸLED is the photon flux impinging on the SPAD active area and we considered the DCR contribution negligible with respect to the noise related to the Poisson statistic of light. The PDP has been characterized spanning from 400 to 1,100 nm wavelength with 5 nm steps, for both a resin-coated and an uncovered chip, with the aim of experimentally verify that the effect of resin on SPAD performance.
Figure 3A compares resin-coated (red plot) and non-resin-coated chip PDP (blue plot). The ringing in the non-resin-coated curve is due to the gap in the refractive index between air (n ≈ 1) and chip back-end (n ≈ 1.6). The epoxy resins have a refractive index in the range of 1.50–1.56 and the reflections (and thus the ringing) decrease in chips covered with resins. Thus, the addition of the resin layer results in a higher PDP (about a 7% difference at 530 nm), corresponding to about 70% at 525 nm, 50% at 650 nm, and 6% at 940 nm.
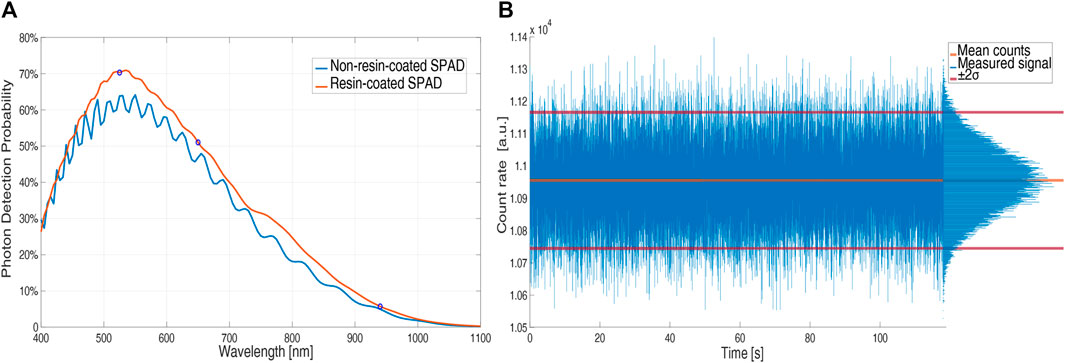
FIGURE 3. PDP of an uncovered (blue) and a resin-coated (red) SPAD (5 V excess bias) vs. wavelength (A); count rate vs. time in normal operation without the pulsatile component by using IR light and a constant attenuator (B).
To verify the stability of the LED light intensity we interposed an attenuator, which emulates the finger without introducing the pulsatile component of the absorbed light related to blood volume changes, between the LEDs and SPAD boards. Figure 3B shows that the number of counts, proportional to the LEDs light intensity, is stable over time and that the noise contribution follows the Poissonian distribution of light, with a standard deviation equal to the square root of the mean value (10.94 kcounts mean and 111 counts standard deviation).
To verify the usability of the device in real-field applications, we tested its robustness against movement artifacts asking a volunteer to do horizontal slow and fast hand movements (60 s of slow movements at about 0.1 Hz and 60 s of fast movements at about 2 Hz) and vertical hand movements. During slow horizontal movements, the signal quality did not show any deterioration while the quality worsened during fast hand movements (Figure 4). During vertical hand movements, the PPG signal reflected the vessel filling dynamics induced by changes in hydrostatic pressure (Figure 5). Indeed, when the finger is down, its greater blood volume absorbs a higher number of photons and the signal baseline is lower; when the finger is up, a lower blood volume in the finger rises the signal baseline.
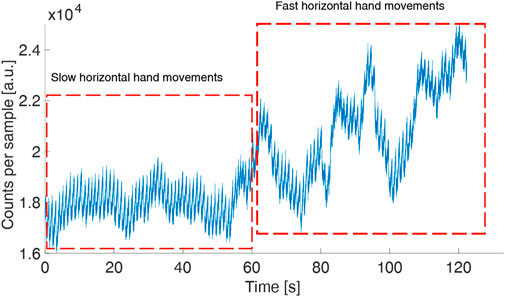
FIGURE 4. PPG (green LED) in a volunteer moving his hand horizontally (slow movements followed by fast movements) to test the robustness of the device against movement artifacts. The sample time is 1 ms.
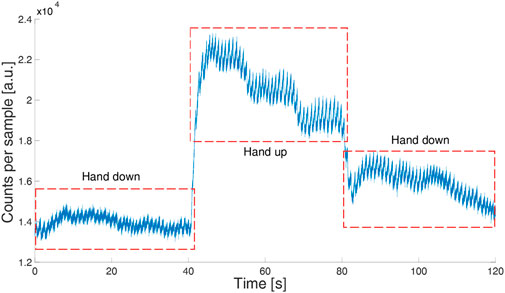
FIGURE 5. PPG signal (green LED) in a volunteer moving his hand up and down. The sample time is 1 ms.
Figure 4 shows the measurement for the green LED where the pulse peaks can be easily identified during the whole acquisition with an SNR of 126.3. The same measurement was performed concurrently with the red and IR LEDs. The red signal worsens with the fast hand movements with an overall SNR of 60.9, while the IR is noisy also with slow hand movements, with an SNR of 49.4.
We evaluated the capability of our prototype to measure beat-by-beat heart rate and oxygen saturation for applications aimed at evaluating the severity of breathing disorders during sleep with laboratory experiments performed on two young (around 30 years old) healthy volunteers (#1, male; #2, female). Each volunteer was instrumented by mounting the PPG prototype on the index finger of the right hand (Figure 1C), a commercial electrocardiograph (ECG) on the chest (Faros 360 Mega, Kuopio, Finland) to measure the reference heart rate, and a commercial pulse oximeter (Masimo Corporation, Irvine, CA, United States) on the mid finger of the right hand to measure the reference blood oxygen saturation. Each experimental session was performed sitting and consisted of a baseline recording of 5 min followed by two voluntary apneas with a 2-minute recovery, a cold pressor test, and a final recovery period, for a whole experiment duration of at least 15 min. The cold pressor test consisted of immersing the left hand in ice water up to the wrist for 90 s to induce marked reflex vasoconstriction. The two voluntary apneas were performed to evaluate the consistency and reproducibility of oxygen saturation falls, and the cold pressor test to evaluate whether the reflex vasoconstriction affects the quality of heart rate and oxygen-saturation measures.
A more systematic evaluation of the PPG green light channel for estimating the HR and HR variability was performed on a larger group of volunteers (N = 6, 4 males and 2 females, all Caucasian, aged between 25 and 35 years old) following the Bland and Altman approach. The 6 volunteers were similarly instrumented with the 3-wavelength PPG and the commercial ECG. The experimental session consisted of the 5-minute baseline recording in sitting position at rest.
Since the SPAD sensor measures the intensity of the transmitted light through the finger, we mirrored the measured intensity to have a signal proportional to the fraction of the absorbed light by the finger. The mirrored signal was bandpass filtered by a zero-phase fourth order Butterworth filter with cut-off frequencies between 0.5 and 5 Hz (see Figure 6A). Then, the peak of each pulse wave (which corresponds to the maximum value occurring in systole) was identified by a derivative-and-threshold algorithm. The inter-beat interval, IBI, was calculated for each cardiac cycle as the time interval between two consecutive systolic peaks.
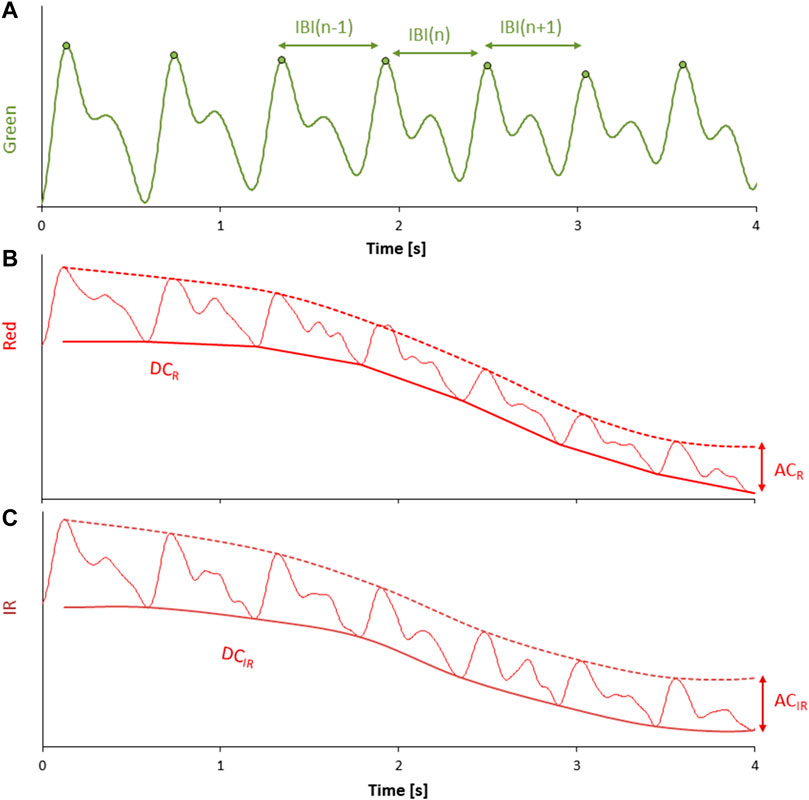
FIGURE 6. (A) mirrored intensity of transmitted light at green wavelength after bandpass filtering; each pulse wave is identified by a derivative-and-threshold algorithm, the peak occurring during the systolic phase of the cardiac contraction is calculat calculated (circle), and the inter-beat-interval (IBI) is obtained beat by beat as the time interval between consecutive systolic peaks. (B,C) mirrored intensity of transmitted light at red and IR wavelengths after low pass filtering; the envelope of the pulse wave valleys provides the DC components, DCR and DCIR (continuous solid line); the envelope of the pulse wave peaks is shown by dashed lines. The corresponding AC components are the difference between the peaks and valleys envelopes: ACR and ACIR.
To compare the quality of the IBI estimated from the three wavelengths, we computed the root-mean-squared error with respect to the R-R intervals during the apnea. In this phase, we expect a higher alteration for the red and IR traces which are susceptible to variations in oxygen saturation.
For the wavelength with the minimum error, we performed a Bland and Altman analysis. In this analysis the HR and the standard deviation of the normal-to-normal intervals (SDNN), index of overall variability [26] were calculated over the 5-minute baseline recordings from both the ECG R-R intervals and the PPG IBI intervals.
The intensity of the transmitted light at the red and IR wavelengths was mirrored to have signals proportional to the absorbed light by the finger. The mirrored signals were low-pass filtered by a zero-phase sixth order Butterworth filter with a cut-off frequency at 10 Hz (Figures 6B, C). For each pulse wave identified on the green light (which is generally considered more stable than red and IR), we calculated the systolic peak and the immediately preceding valley (i.e., the foot of the pulse wave occurring at the end of the diastole). The DC components of red (DCR) and IR (DCIR) wavelengths were estimated as the envelope of the valleys, and the AC component of red (ACR) and IR (ACIR) wavelengths were estimated as the difference between the envelope of the peaks and the envelope of the valleys. The AC and DC components calculated beat by beat were averaged over a running window of 7 cardiac beats to improve the stability of the measures. Then, the double ratio among these quantities, DR, was calculated beat by beat as:
The double ratio is related to the level of oxygen saturation in the blood. Calibrated signals are usually obtained by asking volunteers to breathe at decreasing levels of oxygen concentration while taking arterial blood samples which are directly analyzed and compared with the DR readings to plot the calibration curve. To avoid this invasive procedure, considering that our aim is to demonstrate the feasibility of the measures by the SPAD prototype, we calibrated our device by measuring oxygen saturation values with a commercial pulse oximeter for a few heartbeats twice in a single volunteer. These calibration measures were performed at the start of the first baseline period and the end of the first apnea (see Figure 7) and were compared with the corresponding DR values calculated by Eq. 3.
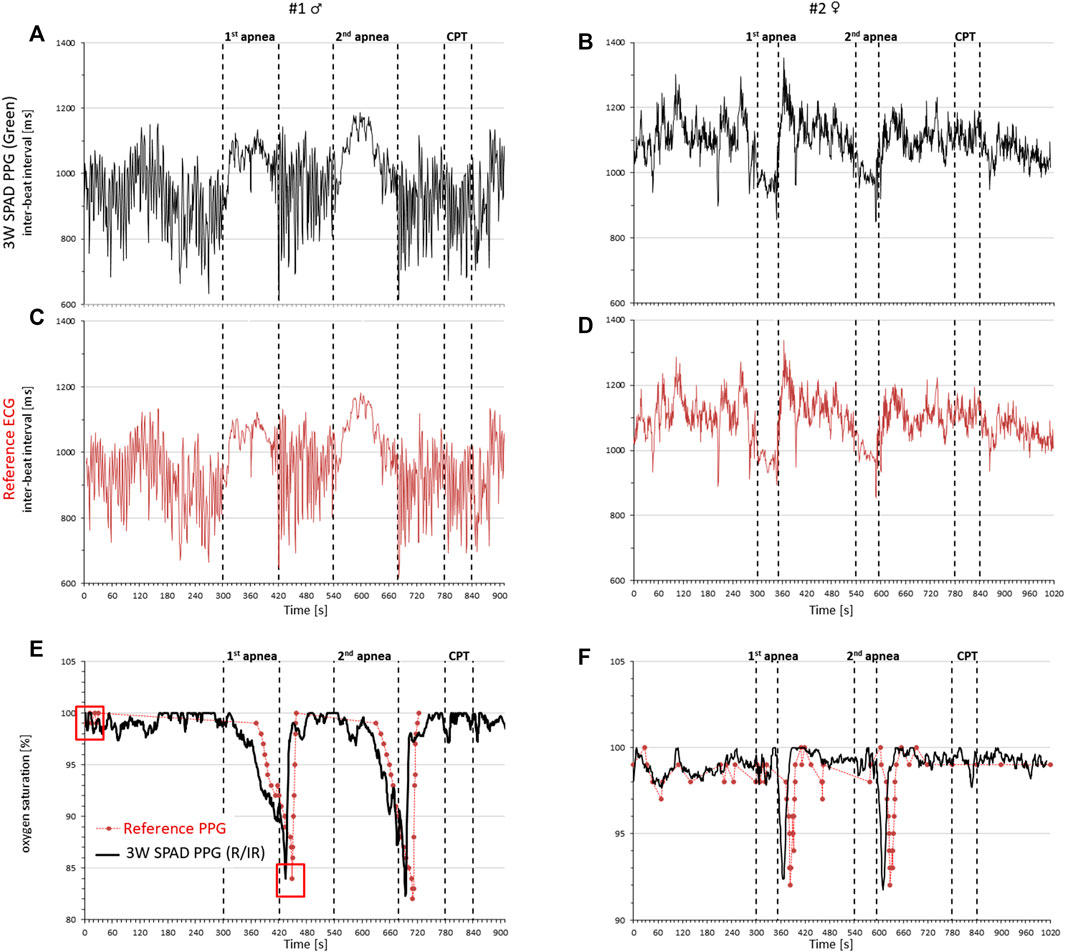
FIGURE 7. Cardiorespiratory signals in a male (left) and female (right) volunteer by the 3-wavelength PPG prototype, a commercial ECG, and a commercial pulse oximeter during rest, two voluntary apneas, and the cold pressor test (CPT). Cardiac intervals from the inter-beat interval of consecutive pulse waves detected by the green light of the PPG (A,B) and from the reference ECG (C,D); oxygen saturation by the PPG prototype (black line) and the reference pulse oximeter (red circles) (E,F); red squares at the start of the recording and the end of the first apnea of subject #1 identify the oxygen saturation values used for the initial calibration of the prototype.
The obtained calibration curve was then used in all the successive measures.
The comparison among the three wavelengths for IBI estimation during apneas is reported as the root-mean-squared error with respect to the gold standard (the reference ECG) in Table 1 for the two volunteers separately. The results indicate clearly that the green light provides the best IBI estimation.

TABLE 1. Root-mean-squared error in the IBI estimation for the three different wavelengths during an apnea.
Figure 7 compares the signals measured by our PPG prototype with the reference signals separately in each participant. It shows that the beat-by-beat heart rate tracings by our prototype (green light) are almost identical to those measured by the ECG and that oxygen saturation changes are consistent with the apnea episodes and very close to those provided by the commercial pulse oximeter. Furthermore, the vasoconstriction induced by the cold pressor test does not introduce significant disturbances in the measures.
Figure 8 shows the Bland and Altman analyses on HR and SDNN. The HR provided by the green light of the 3-wavelength PPG is almost identical to the HR of the gold-standard ECG. SDNN appears to be slightly but not significantly greater when measured by our PPG than by the reference ECG; however, the slight difference can be explained by the additional component to the overall HR variability detected distally by the finger PPG which is due to the known modulations of the pulse arrival time from the heart to the finger [27].
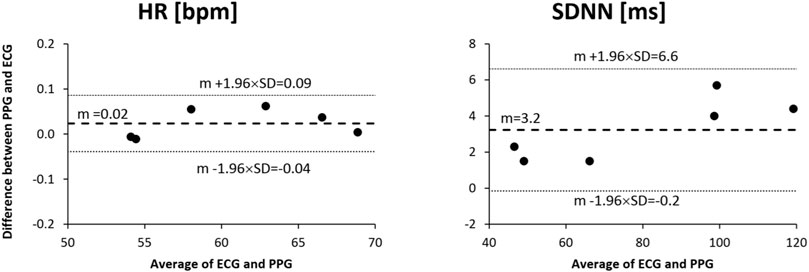
FIGURE 8. Bland and Altman analysis for heart rate (HR) and standard deviation of normal-to-normal intervals (SDNN) as measured from the reference ECG and the green channel of the proposed 3-wavelength PPG in a group of 6 healthy volunteers sitting at rest for 5 min.
We presented an innovative three-wavelength (red, IR, and green) pulse oximeter based on a SPAD detector, operating in transmission mode, which is considered in literature more robust to disturbances than reflection mode. The system integrates a green LED in addition to the standard red and IR LEDs, to optimize the heart rate measure simultaneously providing a reliable continuous measurement of oxygen saturation. The prototype validation demonstrated, for the first time, that it is possible to use SPAD detectors in contact photoplethysmography as an alternative to photodiodes for red and IR light, and that SPADs enable transmission PPG with green light, which is more robust to motion artifacts than other wavelengths [9]. Furthermore, this device will allow in future studies to quantitatively compare different optical set-up (transmittance vs. reflectance) and different wavelength for PPG measurement and physiological parameters extraction.
When compared to traditional photodiodes, the SPAD has higher sensitivity, is more robust to electronic noise, does not need analog front-ends, and is more suitable for miniaturization. These characteristics make systems based on SPADs more reliable and simpler than photodiode sensors, but they present other drawback, such as smaller active area and the presence of a dead time after each photon-detection. For this reason, a fair comparison in terms of technical trade-offs and performance is still ongoing and will be objective of a coming work. We believe that future developments of SPAD-based systems may allow the creation of miniaturized stand-alone devices integrating the microcontroller, power supply, and data logging on wearable systems. They could even lead to innovative implanted PPG systems, as multi-wavelength transmission mode devices placed around the arteries for monitoring blood oxygen desaturations and pulse wave velocity unobtrusively over very long periods, as recently proposed as proofs-of-concept in futuristic applications [28, 29]. Such innovative solutions might substantially facilitate screening for sleep-breathing disorders and treatment monitoring in large populations at risk for cardiovascular events.
The datasets presented in this article are not readily available because the raw data on volunteers supporting the conclusion of the prototype validation are not openly available due to privacy reasons. Access is granted on justified request to researchers who meet the criteria for access to confidential data. Requests to access the datasets should be directed toaXJpcy5jdXNpbmlAcG9saW1pLml0.
The studies involving human participants were reviewed and approved by the Comitato Etico del Politecnico di Milano. The patients/participants provided their written informed consent to participate in this study.
IC hardware and software development, writing; RR hardware and software development. PC and AF design of measurement protocols, data analysis and statistics; FV hardware and software review, paper review. All authors contributed to the article and approved the submitted version.
Research founded by the Italian Ministry of Health (Ricerca Corrente).
The authors declare that the research was conducted in the absence of any commercial or financial relationships that could be construed as a potential conflict of interest.
All claims expressed in this article are solely those of the authors and do not necessarily represent those of their affiliated organizations, or those of the publisher, the editors and the reviewers. Any product that may be evaluated in this article, or claim that may be made by its manufacturer, is not guaranteed or endorsed by the publisher.
1. Tamura T, Maeda Y, Sekine M, Yoshida M. Wearable photoplethysmographic sensors—Past and present. Electronics (2014) 3(2):282–302. doi:10.3390/electronics3020282
2. Charlton PH, Paliakaitė B, Pilt K, Bachler M, Zanelli S, Kulin D, et al. Assessing hemodynamics from the photoplethysmogram to gain insights into vascular age: A review from VascAgeNet. Am J Physiology-Heart Circulatory Physiol (2022) 322:H493–H522. doi:10.1152/ajpheart.00392.2021
3. Allen J. Photoplethysmography and its application in clinical physiological measurement. Physiol Meas (2007) 28:R1–R39. doi:10.1088/0967-3334/28/3/r01
4. Li Y, Gao H, Ma Y. Evaluation of pulse oximeter derived photoplethysmographic signals for obstructive sleep apnea diagnosis. Medicine (2017) 96:e6755. doi:10.1097/md.0000000000006755
5. Mejía-Mejía E, May JM, Torres R, Kyriacou PA. Pulse rate variability in cardiovascular health: A review on its applications and relationship with heart rate variability. Physiol Meas (2020) 41:07TR01. doi:10.1088/1361-6579/ab998c
6. Asada HH, Shaltis P, Reisner A, Rhee S, Hutchinson RC. Mobile monitoring with wearable photoplethysmographic biosensors. IEEE Eng Med Biol Mag (2003) 22(3):28–40. doi:10.1109/memb.2003.1213624
7. Mehrabi M, Setayeshi S, Ardehali SH, Arabalibeik H. Modeling of diffuse reflectance of light in heterogeneous biological tissue to analysis of the effects of multiple scattering on reflectance pulse oximetry. J Biomed Opt (2017) 22(1):015004. doi:10.1117/1.jbo.22.1.015004
8. Matsumura K, Toda S, Kato Y. RGB and near-infrared light reflectance/transmittance photoplethysmography for measuring heart rate during motion. IEEE Access (2020) 8:80233–42. doi:10.1109/access.2020.2990438
9. Maeda Y, Sekine M, Tamura T. Relationship between measurement site and motion artifacts in wearable reflected photoplethysmography. J Med Syst (2011) 35:969–76. doi:10.1007/s10916-010-9505-0
10. Lee J, Matsumura K, Yamakoshi K, Rolfe P, Tanaka S, Yamakoshi T. Comparison between red, green and blue light reflection photoplethysmography for heart rate monitoring during motion. In: Proceeding of the 2013 35th Annual International Conference of the IEEE Engineering in Medicine and Biology Society; July 2013; Osaka, Japan. IEEE (2013). p. 1724–7.
11. Matsumura K, Rolfe P, Lee J, Yamakoshi T. iPhone 4s photoplethysmography: Which light color yields the most accurate heart rate and normalized pulse volume using the iPhysioMeter application in the presence of motion artifact? PLoS ONE (2014) 9:e91205. doi:10.1371/journal.pone.0091205
12. Maeda Y, Sekine M, Tamura T. The advantages of wearable green reflected photoplethysmography. J Med Syst (2011) 35:829–34. doi:10.1007/s10916-010-9506-z
13. Fallow BA, Tarumi T, Tanaka H. Influence of skin type and wavelength on light wave reflectance. J Clin Monit Comput (2013) 27(3):313–7. doi:10.1007/s10877-013-9436-7
14. Cova S, Ghioni M, Lacaita A, Samori C, Zappa F. Avalanche photodiodes and quenching circuits for single-photon detection. Appl Opt (1996) 35:1956–76. doi:10.1364/ao.35.001956
15. Villa F, Bronzi D, Zou Y, Scarcella C, Boso G, Tisa S, et al. CMOS SPADs with up to 500 µm diameter and 55% detection efficiency at 420 nm. J Mod Opt (2014) 61(2):102–15. doi:10.1080/09500340.2013.864425
16. Paracchini M, Marcon M, Villa F, Zappa F, Tubaro S. Biometric signals estimation using single photon camera and deep learning. Sensors (2020) 20(21):6102. doi:10.3390/s20216102
17. Sanzaro M, Gattari P, Villa F, Tosi A, Croce G, Zappa F. Single-photon avalanche diodes in a 0.16 μm BCD technology with sharp timing response and red-enhanced sensitivity. IEEE J Selected Top Quan Elect (2018) 24(2):1–9. doi:10.1109/jstqe.2017.2762464
18. Severini F, Cusini I, Berretta D, Pasquinelli K, Incoronato A, Villa F. SPAD pixel with sub-NS dead-time for high-count rate applications. IEEE J Selected Top Quan Elect (2022) 28(2):1–8. doi:10.1109/jstqe.2021.3124825
19. Clayton DG, Webb RK, Ralston AC, Duthie D, Runciman WB. Pulse oximeter probes A comparison between finger, nose, ear and forehead probes under conditions of poor perfusion. Anaesthesia (1991) 46(4):260–5. doi:10.1111/j.1365-2044.1991.tb11492.x
20. Anderson RR, Parrish JA. The optics of human skin. J Invest Dermatol (1981) 77(1):13–9. doi:10.1111/1523-1747.ep12479191
21. Spigulis J, Gailite L, Lihachev A, Erts R. Simultaneous recording of skin blood pulsations at different vascular depths by multiwavelength photoplethysmography. Appl Opt (2007) 46(10):1754–9. doi:10.1364/ao.46.001754
22. Maeda Y, Sekine M, Tamura T, Moriya A, Suzuki T, Kameyama K. Comparison of reflected green light and infrared photoplethysmography. In: Proceeding of the 2008 30th Annual International Conference of the IEEE Engineering in Medicine and Biology Society; August 2008; Vancouver, BC, Canada. IEEE (2008).
23. Nitzan M, Taitelbaum H. The measurement of oxygen saturation in arterial and venous blood. IEEE Instrumentation Meas Mag (2008) 3(11):9–15. doi:10.1109/mim.2008.4534373
24.ST Microelectronics. ARM Cortex-M4 32b MCU+FPU, 105 DMIPS, 512KB Flash/96KB RAM, 11 TIMs, 1 ADC, 11 comm. interfaces. STM32F401xD STM32F401xE. Rev. 3. ST Microelectronics (2015).
25. Ingle A, Velten A, Gupta M. High flux passive imaging with single-photon sensors. In: Proceeding of the 2019 IEEE/CVF Conference on Computer Vision and Pattern Recognition (CVPR); June 2019; Long Beach, CA, USA. IEEE (2019).
26. Malik M, Bigger JT, Camm AJ, Kleiger RE, Malliani A, Moss AJ, et al. Heart rate variability: Standards of measurement, physiological interpretation, and clinical use. Eur Heart J (1996) 17(3):354–81. doi:10.1093/oxfordjournals.eurheartj.a014868
27. Castiglioni P, Meriggi P, Di Rienzo M, Lombardi C, Parati G, Faini A. Heart rate variability from wearable photoplethysmography systems: Implications in sleep studies at high altitude. Sensors (2022) 22(8):2891. doi:10.3390/s22082891
28. Reichelt S, Fiala J, Werber A, Forster K, Heilmann C, Klemm R, et al. Development of an implantable pulse oximeter. IEEE Trans Biomed Eng (2008) 55(2):581–8. doi:10.1109/tbme.2007.902242
Keywords: SPAD, photoplethysmography, PPG, heart rate, oxygen saturation
Citation: Cusini I, Rinaldi R, Castiglioni P, Faini A and Villa F (2023) Multi-wavelength SPAD photoplethysmography for cardio-respiratory monitoring. Front. Phys. 11:952103. doi: 10.3389/fphy.2023.952103
Received: 24 May 2022; Accepted: 12 June 2023;
Published: 22 June 2023.
Edited by:
Fatemeh Mokhtari, Deakin University, AustraliaReviewed by:
Victor Leong, Institute of Materials Research and Engineering (A∗STAR), SingaporeCopyright © 2023 Cusini, Rinaldi, Castiglioni, Faini and Villa. This is an open-access article distributed under the terms of the Creative Commons Attribution License (CC BY). The use, distribution or reproduction in other forums is permitted, provided the original author(s) and the copyright owner(s) are credited and that the original publication in this journal is cited, in accordance with accepted academic practice. No use, distribution or reproduction is permitted which does not comply with these terms.
*Correspondence: Iris Cusini, aXJpcy5jdXNpbmlsQHBvbGltaS5pdA==
Disclaimer: All claims expressed in this article are solely those of the authors and do not necessarily represent those of their affiliated organizations, or those of the publisher, the editors and the reviewers. Any product that may be evaluated in this article or claim that may be made by its manufacturer is not guaranteed or endorsed by the publisher.
Research integrity at Frontiers

Learn more about the work of our research integrity team to safeguard the quality of each article we publish.