 Qiang Li
 Dagang Liu1
- 1The School of Electronic Science and Engineering, University of Electronic Science and Technology of China, Chengdu, China
- 2The Key Laboratory of High-Power Microwave Technology, Institute of Applied Electronics, China Academy of Engineering Physics (CAEP), Mianyang, China
Currently, there is limited research on the influence of gas ionization on the pulse formation process in pulse power source-driven loads. This paper introduces a road-field-Particle-In-Cell (PIC)/Monte Carlo Collision (MCC) collaborative simulation method that can accurately simulate gas ionization in Linear Transformer Driver (LTD) electron beam generation (EBG). The method couples the electromagnetic field and charged particle simulated through PIC/MCC with the circuit modules, and the load's voltammetry characteristics can real-time feedback to the Blumlein Pulse Forming Network (BPFN) of the LTD. In contrast to prior simulations that used fitted ideal T-shaped pulse input waveforms to model the load, this method provides a clearer depiction of the influence of gas ionization on the pulse shape. Additionally, the paper conducts simulation studies on LTD electron beam generator operating at different argon gas pressures. The findings indicate that introducing gas can effectively increase current while reducing voltage amplitude, thereby lowering the diode impedance. A small amount of gas can slightly enhance peak power, but excessive gas diminishes peak power and significantly shortens voltage pulse width. This is attributed to the beneficial effect of a small amount of gas ionization-produced plasma on the device. However, an excessive amount of gas ionization-generated plasma can lead to impedance mismatch in the device, even resulting in a load short circuit. This phenomenon causes a decrease in pressure drop at the top, consequently shortening the pulse width.
1 Introduction
The linear transformer driver (LTD), first proposed by Russian scientists, is a new pulsed power technology that has been widely used in many fields due to its high voltage and current characteristics, such as Z pinch, ion implantation for material modifications, plasma physics, and so on [1–9]. The principle behind LTD pulse formation involves generating a pulse of the desired shape at low voltage using a linear transformer driver (LTD). Subsequently, voltage multiplication techniques [10–14] are employed to increase its voltage by several orders of magnitude. Ultimately, this voltage, generated by the LTDs, is used to drive various loads such as high-power microwave devices, diodes, thereby exciting high-power microwaves or electron beams. However, current research predominantly employs idealized T-shaped pulse input waveforms, fitted according to requirements, and then simulates the high-power microwave devices or diodes based on these waveforms. Nevertheless, in the experiments, a pulse power source is needed to drive these devices. This involves complex physical processes, including the generation and propagation of electromagnetic waves, electron emission, and the production of high-power microwaves, among others. Importantly, these processes are interrelated, with the pulse power source influencing the microwave output of high-power microwave devices or diodes, and the structural parameters and voltammetry characteristics of the devices, in turn, affecting the pulse power source. Thus, conducting research solely on high-power microwave devices or diodes is insufficient to comprehensively capture these complex and interconnected physical processes.
Furthermore, current research on high-power microwave devices and diodes is largely conducted under vacuum conditions. However, in practical applications, it is challenging to maintain a perfect vacuum, and small amounts of residual gas often remain. Some studies have indicated that filling an appropriate amount of gas can affect the simulation of high-power microwave devices or diodes [15–20]. This necessitates in-depth research into the performance of high-power microwave devices or diodes in the presence of gases. Additionally, many pulse power applications require pulse signals with a stable voltage plateau, especially in high-power microwave applications. To generate such flat-top pulses, it is necessary to arrange LC components in various configurations to create large-scale pulse forming circuits. However, traditional full three-dimensional electromagnetic PIC/MCC algorithms are insufficient for simulating large-scale circuits. Therefore, there is an urgent need for a self-consistent road-field-PIC/MCC method capable of simulating the aforementioned complex physical processes.
This paper introduces a road-field-PIC/MCC simulation method, wherein the PIC/MCC algorithm is coupled with circuit modules. This coupling facilitates real-time feedback of the load’s voltammetry characteristics into the circuit simulation module of the pulse power source, resulting in more precise pulse waveforms. This refinement enhances the overall device simulation’s fidelity to practical scenarios. Building upon this foundation, a model is developed for the LTD pulse power generation device. A foil-less diode with ring cathode characteristics is integrated into the pulse power generator. Subsequently, the road-field-PIC/MCC simulation algorithm is employed to comprehensively simulate the entire setup. By introducing argon gas at varying pressures, simulations of the LTD pulse power electron beam generator under different conditions are conducted. This investigation explores the impact of gas ionization on pulse shaping in the LTD electron beam generator and provides an analysis of relevant physical phenomena.
2 Theoretical basic
In order to achieve the road-field-PIC/MCC collaborative simulation method, it is necessary to develop the circuit simulation module and the PIC/MCC simulation module. Subsequently, research on the collaborative coupling methods between circuit module and PIC/MCC module is conducted. The circuit modules are implemented based on the Modified nodal voltage method [21], as elucidated in detail in our previous work [22]. The subsequent section provides an exhaustive exposition of the implementation process for the PIC/MCC simulation module and the road-field-PIC/MCC collaborative simulation module.
2.1 The fundamental theory of ionization collisions
When the energy of the incident electron is greater than the ionization threshold, the incident electron may ionize the neutral gas molecule. The probability of ionization collision occurring, denoted as
where
where
in Formula 3,
where
2.2 Road-field-PIC/MCC collaborative method
Figure 1 depicts the fundamental workflow of the fully three-dimensional electromagnetic PIC/MCC algorithm. In the traditional electromagnetic PIC algorithms, the electric and magnetic fields are updated using charge and current density. Subsequently, these fields are used to calculate the forces acting on charged particles, leading to updates in particle velocity and position information. This, in turn, updates the charge and current density, creating a cyclic process. In the electromagnetic PIC/MCC algorithm, an ionization collision module is introduced between the particle velocity and position processing module and the charge and current density processing module. When the particle and gas collision probability given by Formula 1 is satisfied, this module processes the ionization collision process based on Eqs 2–4, generating new particles and further updating particle velocities.
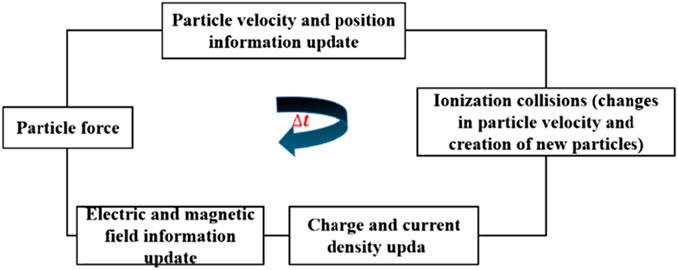
FIGURE 1. PIC/MCC basic algorithm flow chart.
Figure 2 illustrates the theoretical framework for the fully coupled system of road-fifield-PIC/MCC collaborative simulation. From the diagram, it is evident that the electric and magnetic fields serve as bridges between the circuit module and the charged particle module. In the circuitry, the connection nodes coupled with the PIC/MCC modules are initially determined, and interactive excitation ports are constructed within the PIC/MCC modules. At each time step of the collaborative computation, the PIC/MCC module can be regarded as the load for the circuit module, while the circuit module can be seen as the excitation input source for the PIC/MCC module. The voltage
where
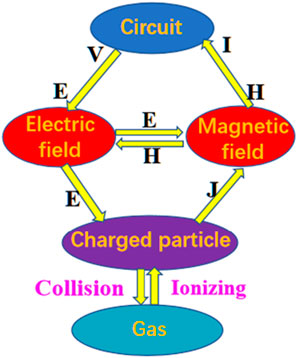
FIGURE 2. Theoretical framework for the fully coupled system of road-field-particle collaborative simulation.
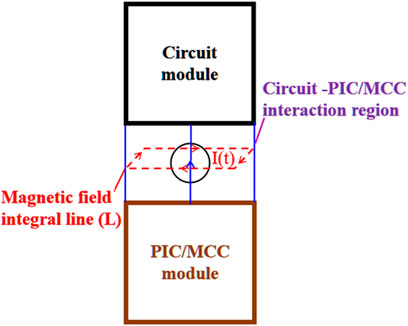
FIGURE 3. Integration approach of the circuit module with PIC/MCC.
Generally speaking, the PIC/MCC time step is significantly smaller than the time step of the circuit iteration. Furthermore, for the sake of collaborative simulation, the circuit’s iteration time step naturally needs to be the same as the PIC/MCC simulation’s time step.
3 Numerical simulation study
In the previous section, the theory and implementation process of the road-field-PIC/MCC collaborative simulation method is described in detail. Now, this methodology will be employed to conduct a simulation study on the gas ionization within the LTD pulsed electron beam generation device.
First, the LTD pulse EBG as shown in Figure 4 was constructed. The device mainly consists of six linear transformer driver (LTD) cavities, an insulator, and a diode load. Each LTD cavity is composed of two Blumlein pulse forming networks (BPFNs) in parallel through the laser-triggered switch, along with corresponding magnetic coils, and oil media. When each BPFN of the LTD cavity was charged to 140 kV, the laser start operating via the control signal, the laser triggered switches is closing, and then, six LTD cavities discharge to the load (such as foil-less diode). Figure 5 shows the equivalent circuit of a compact BPFN, each BPFN consists of 20 identical inductors (L1–L20) with a value of 84 nH, 20 identical capacitors (C1–C20) with a value of 0.85 nF, switch SW1, the load resistance R1, and the additional inductance of various wires and switches (L21–L22) is 175 nH, R2 is the additional resistance of roughly 0.01
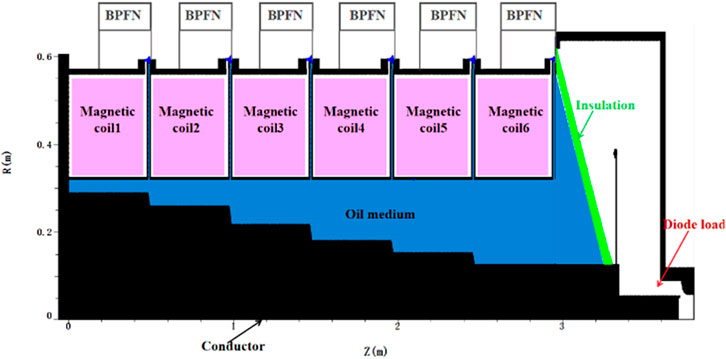
FIGURE 4. Depicts a cross-sectional view of the pulsed particle beam generator.
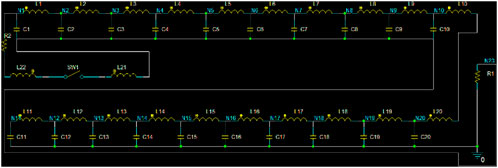
FIGURE 5. Illustrates the equivalent circuit of the Blumlein pulse forming network.
When utilizing an n-section uniform network, the pulse width
where
Figure 6 shows a schematic of the annular beam foil-less diode. The grid spacing in the PIC/MCC simulation region is 0.5 mm in the
where c represents the speed of light,
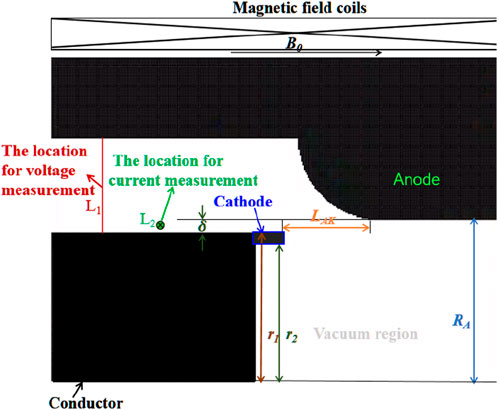
FIGURE 6. Illustrates a cross-sectional view of a toroidal foilless diode.
In the collaborative simulation of the circuit-field-particle, the time iteration step of the circuit is set to be the same as the PIC/MCC simulation time step to achieve collaborative simulation goals. Therefore, the PIC/MCC simulation time step
where
The differential formula for the current and voltage on the capacitor is as follows:
where
Further linearizing the Formula 10 using the backward Euler method and circuit theory yields:
where
Substituting Eq. 12 into Eq. 9 yields:
Considering that the capacitance in LTD pulse power devices is typically in the order of nanofarads (nF), as indicated in the manuscript with a capacitance value of 0.85 e–9 F, and h represents the time step, set to 8.30 e–13 s in this study, substituting these values into the Eq. 13, we obtain:
Taking into account the discharge of capacitors in the circuit, current flow through resistors and loads, there will inevitably be energy losses. In extremely small time iteration steps, the corresponding current is certainly smaller than the corresponding voltage values. As indicated by the Eq. 14, this convergence relationship is guaranteed to be satisfied. Therefore, the overall algorithm convergence is fulfilled, and the algorithm is stable.
In [31, 32], the structure of the cathode and anode determines the electric field distribution inside the diode, as well as its beam characteristics and energy output efficiency of the diode. Taking into account that the diode will generate an annular electron beam, the thickness of the cathode ring cannot exceed the width of the radial gap between the cathode and anode. Therefore, after comprehensive consideration,
According to Ref. [22], with the same LTD driving conditions and keeping the other dimensions of the diode unchanged, the horizontal distance
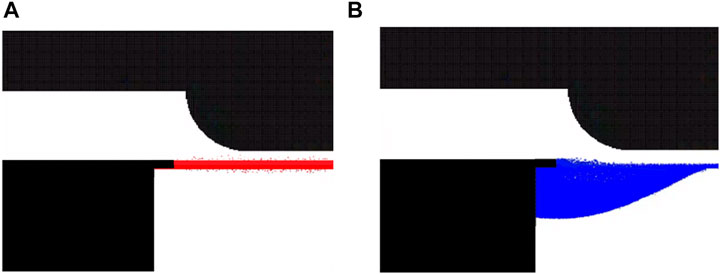
FIGURE 7. Particle spatial distribution chart (A) electrons; (B)
From Figure 7, it can be observed that, without considering gas ionization breakdown, under the influence of the electric field, the energy of electrons and
Subsequently, simulations were conducted on the pulsed power electron beam generator under varying levels of argon gas infusion, the voltage and current were measured as illustrated in Figure 8. From Figure 8A, the voltage amplitude gradually decreased with the increase of the pressure of filled argon, and the greater the pressure of argon, the more drastic the decline in amplitude. Figure 8B demonstrates that the quality of the current decreases as the pressure increases after argon is filled. Utilizing the measured voltage and current, impedance was computed, as depicted in Figure 9, and in the presence of argon gas at a pressure of 8–12 Pa, there are minor peaks observed. However, due to the influence of the plasma, the pulse width of the output waveform decreases, and the small peaks shift forward, becoming less conspicuous. According to Refs. [15, 37], this is because the quality of the electron beam is contingent upon the quality of the voltage waveform. In previous studies, high-power microwave devices and diodes were typically subjected to fitting ideal and stable voltage output waveforms, neglecting the influence of load characteristics, plasma collisions, and other physical phenomena on the output waveform of the front-end pulse. Figure 8 reiterates that when driving the load with a pulse power source, there is a mutual influence between the load and the pulse generator.
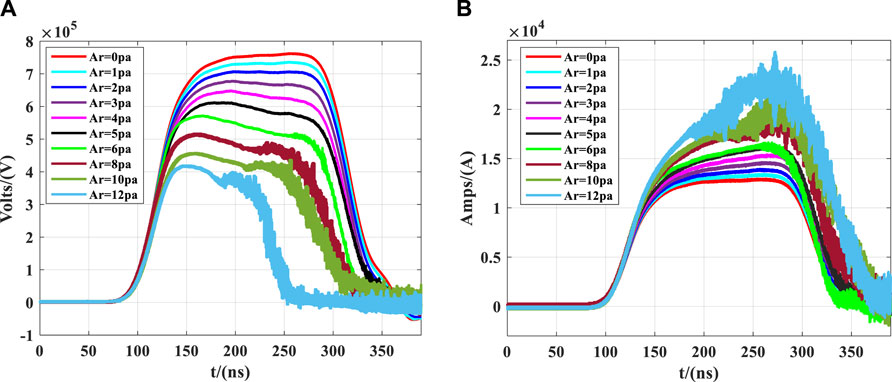
FIGURE 8. Voltage and current with different Argon gas pressures (A) voltage (B) current.
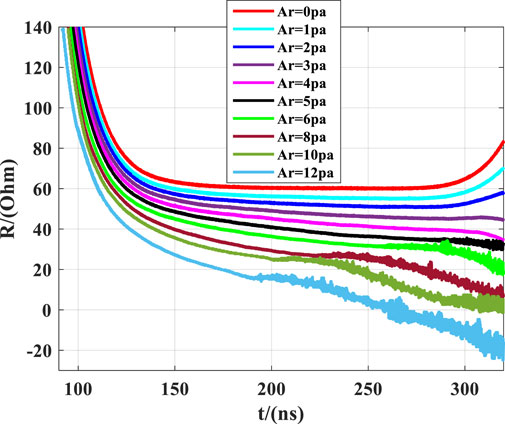
FIGURE 9. Impedance of the diode filled with argon gas at different pressures.
According to Refs. [22, 38], under vacuum conditions, the impedance of the diode is 60 Ω when it is stable, and the entire device is in the impedance matching state. However, upon the introduction of argon gas, the impedance decreases with the increasing gas pressure due to electron collisions with argon atoms, thereby impacting the quality of the electron beam and resulting in a reduction in voltage, as gas infusion continues, the collision-generated charged particles increase, leading to an augmentation in the measured current, ultimately resulting in a decrease in impedance as the gas pressure increases. This impedance reduction, in turn, leads to an overall impedance mismatch within the system. On one hand, this characteristic of decreased impedance feeds back into the Blumlein pulse forming network (BPFN) within the Linear Transformer Driver (LTD). On the other hand, due to the impedance mismatch, electromagnetic wave reflections occur, with the reflected waves superimposing upon the waveforms generated by the LTD. Consequently, based on these two aspects, the reduced load impedance leads to a decrease in the measured voltage, and the superimposition of reflected waves with the LTD-generated waveforms exacerbates the reduction in voltage amplitude. Furthermore, with the increasing gas pressure infusion, within the range of 2–12 Pa, the voltage waveform exhibits a phenomenon of apex reduction. This phenomenon arises from intensified plasma collisions, exacerbating the impedance mismatch and thereby affecting the stable and smooth apex of the pulse waveform.
According to the literature [26], the pulse width should be calculated based on Formula 6, and it can be seen that the pulse width is only related to the capacitance and inductance values as well as the number of stages in the BPFN pulse network circuit. However, from the voltage waveform and Table 1, it can be observed that both the half-width and full-width of the pulse waveform decrease. Additionally, at higher argon gas pressures, the pulse width decreases more rapidly. This is because collisions between electrons and gas produce charged particles. As simulation time increases, collisions intensify, and the charged particles form a plasma that fills the cavity of the foil-less diode. This plasma has electrical conductivity, causing the diode anode and cathode to enter a conductive state, equivalent to a load approaching a short circuit. This process leads to a decrease in the measured voltage amplitude, which is the reason for the reduction in pulse width. Furthermore, as the gas pressure increases, for instance, within the range of 2–12 Pa, the voltage waveform exhibits a phenomenon where the top is lowered. This occurs because intensified plasma collisions result in impedance mismatch, thereby affecting the stability and smoothness of the waveform’s peak.
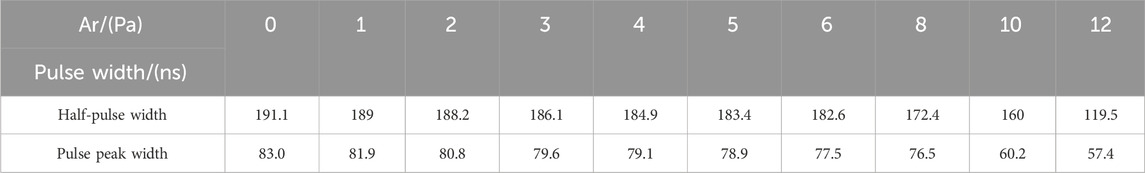
TABLE 1. Voltage pulse width under different gas pressures.
In addition, the relationship between the diode electron beam current and peak power with argon gas pressure was also recorded, as shown in Figure 10A the horizontal axis represents the argon gas pressure value. The charged particles generated by electron-ionization of the gas help neutralize the space charge effect of the electron beam, which aids in breaking the constraint imposed by space charge limitations and effectively increases the current magnitude [19]. Figure 10A confirms this phenomenon by showing that the current increases with increasing argon gas pressure, consistent with the experiment in Ref. [20]. Figure 10B illustrates the relationship between peak power and pressure, demonstrating that when a small amount of argon gas is filled, the peak power slightly increases with pressure. This is because the plasma generated by the ionization of a small amount of argon gas can improve both the electron beam quality and current magnitude. However, when an excessive amount of argon gas is filled, intense collisions lead to a decrease in electron beam quality, resulting in a reduction in power, Upon the infusion of argon gas at a pressure range of 6–10 Pa, the diode’s peak power gradually diminishes.
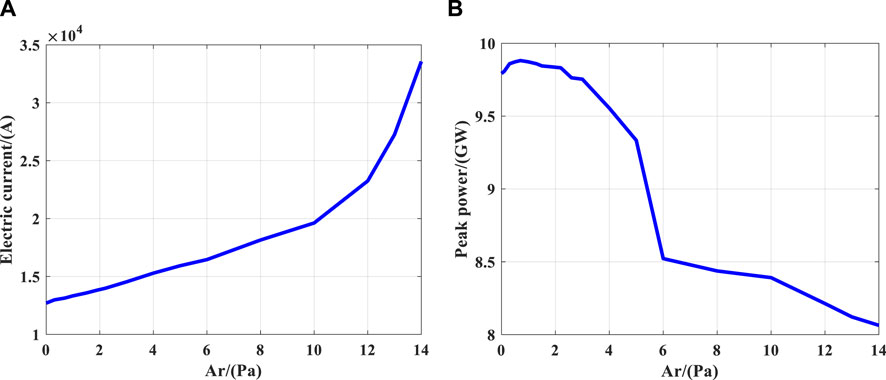
FIGURE 10. Relationship between diode performance and different argon gas pressures (A) beam current, (B) peak power.
4 Conclusion
This study investigated an improved nodal analysis method and a PIC/MCC simulation method, developing a self-consistent simulation approach for gas ionization in pulsed power electron beam generators the Circuit-Field-PIC/MCC simulation method. Using this method, simulations were conducted on a pulsed power electron beam generator under different argon gas pressures. The results revealed that filling the gas could effectively increase the current magnitude while reducing the voltage amplitude, subsequently lowering the impedance of the diode. In addition, a small amount of gas could increase the peak power, but excessive gas led to a decrease in peak power. There was also a noticeable reduction in pulse width, which was related to the plasma formed by particle-gas collisions. As the load impedance decreased, even approaching a short-circuit condition, it reduced the measured voltage amplitude and consequently caused changes in the pulse width. Furthermore, a top voltage drop phenomenon occurred due to the impedance mismatch caused by the plasma generated from particle-gas collisions. These findings provide valuable insights for future comprehensive simulations of high-power microwave devices driven by pulsed power sources.
Data availability statement
The original contributions presented in the study are included in the article/Supplementary material, further inquiries can be directed to the corresponding author.
Author contributions
QL: Conceptualization, Data curation, Formal Analysis, Investigation, Methodology, Software, Validation, Visualization, Writing–original draft, Writing–review and editing. DL: Methodology, Supervision, Writing–review and editing. FX: Funding acquisition, Supervision, Writing–review and editing. LL: Funding acquisition, Methodology, Project administration, Resources, Supervision, Writing–review and editing. HW: Supervision, Visualization, Writing–review and editing.
Funding
The author(s) declare financial support was received for the research, authorship, and/or publication of this article. This work was supported by Science and Technology on High Power Microwave Laboratory Fund (61426050106-202101), and the National Natural Science Foundation of China (Grant No: 12175216 and 12075051). This study also received financial support from the National Natural Science Foundation of China (Grant No: 12375249).
Conflict of interest
The authors declare that the research was conducted in the absence of any commercial or financial relationships that could be construed as a potential conflict of interest.
Publisher’s note
All claims expressed in this article are solely those of the authors and do not necessarily represent those of their affiliated organizations, or those of the publisher, the editors and the reviewers. Any product that may be evaluated in this article, or claim that may be made by its manufacturer, is not guaranteed or endorsed by the publisher.
References
1. Mankowski J, Kristiansen M. A review of short pulse generator technology. IEEE Trans Plasma Sci (2000) 28(1):102–8. doi:10.1109/27.842875
2. Schamiloglu E, Barker RJ, Gundersen M, Ne-uber AA. Modern pulsed power: charlie martin and beyond. Prceings of the IEEE (2004) 92(7):1014–20. doi:10.1109/JPROC.2004.829058
3. Gao S, Moez K. A 2.12-V vpp 11.67-pJ/pulse fully integrated UWB pulse generator in 65-nm CMOS technology. IEEE Trans Circuits Syst Regular Pap (2020) 67(3):1058–68. doi:10.1109/TCSI.2019.2955693
4. Weinbrecht EA, McDaniel DH, Bloomquist DD. The Z refurbishment project (ZR) at sandia national laboratories. In: Proceedings of the Digest of Technical Papers. PPC-2003, in 14th IEEE International Pulsed Power Conference (IEEE Cat. No.03CH37472); June 2003; Dallas, TX, USA (2003). p. 157–62. doi:10.1109/PPC.2003.1277682
5. Sato H, Minamitani Y. Output characteristics of bipolar pulse from high-frequency burst pulse generator constructed by nonlinear LC ladders using magnetic switches. IEEE Trans Plasma Sci (2020) 48(1):204–11. doi:10.1109/TPS.2019.2957524
6. Cook D. Z, ZX, and X-1: a realistic path to high fusion yield, Digest of Technical Papers. In: Proceedings of the 12th IEEE International Pulsed Power Conference. (Cat. No.99CH36358); June 1999; Monterey, CA, USA (1999). p. 33–7. doi:10.1109/PPC.1999.825419
7. Selvakumar D, Madanmohan B. Impact of loading effect from liquid foods on the performance of unipolar and bipolar square pulse generator. Arab J Sci Eng (2022) 47:14315–26. doi:10.1007/s13369-022-06741-5
8. Kumar M, Mishra A. Multiphysics analysis of reversible electroporation and electrodeformation of cervical cells using a nanosecond pulse generator. IEEE Trans Plasma Sci (2023) 51(2):534–43. doi:10.1109/TPS.2023.3235373
9. Sinars DB, Sweeney MA, Ampleford DJ, Ao T, Apruzese JP, Armstrong DJ, et al. Review of pulsed power driven high energy density physics research on Z at Sandia. Phys Plasmas (2020) 27(7):070501. doi:10.1063/5.0007476
10. Novac BM, Kumar R, Smith IR. A tesla-pulse forming line plasma opening switch pulsed power generator. Rev Sci Instrum (2010) 81(10):104704. doi:10.1063/1.3484193
11. Li Z, Yang J, Liu L. A compact repetitive PFN-marx generator. In: Proceedings of the 2015 IEEE International Conference on Plasma Sciences (ICOPS); May 2015; Antalya, Turkey (2015). p. 1. doi:10.1109/PLASMA.2015.7180009
12. Li H, Ryoo H-J, Kim J-S, Rim G-H, Kim Y-B, Deng J. Development of rectangle-pulse Marx generator based on PFN. IEEE Trans Plasma Sci (2009) 37(1):190–4. doi:10.1109/tps.2008.2007730
13. Kim AA, Kovalchuk BM, Bastrikov AN, Durakov VG, Volkov SN, Sinebryukhov VA. 100 ns current rise tìme LTD stage. In: Proceedings of the PPPS-2001 Pulsed Power Plasma Science 2001. 28th IEEE International Conference on Plasma Science and 13th IEEE International Pulsed Power Conference. Digest of Papers (Cat. No.01CH37251); June 2001; Las Vegas, NV, USA (2001). p. 1491–4.
14. Kim AA, Kovalchuk BM, Kumpjak EV, Zoi NV. 0.75 MA, 400 ns rise time LTD stage, Digest of Technical Papers. 12th IEEE International Pulsed Power Conference. (Cat. No.99CH36358). Proc 12th IEEE Int Pulsed Power Conf (1999) 2:955–958. doi:10.1109/PPC.1999.823675
15. Kiziridi PP, Ozur GE. Formation of a non-relativistic, high-current electron beam in a gas-filled diode. Russ Phys J (2023) 65:1619–24. doi:10.1007/s11182-023-02810-w
16. Arai H, Hotta H. Ionization of gases by a pulsed electron beam as studied by self-focusing. III. He, Ar, and O2 mixtures. J Chem Phys (1981) 75:3876–81. doi:10.1063/1.442544
17. Hammer DA, Kapetanakos CA, Ury M. Formation of ionization channel in high-pressure gas using pulsed relativistic electron beam. J Appl Phys (1973) 44:1121–7. doi:10.1063/1.1662316
18. Qian BL, Li CL, Liu YG, Zhang JD, Tan QM, Liu JL, et al. Experiment on the plasma-loaded backward-wave oscillator using a gas-loaded foil-less diode. J Appl Phys 1 September (2000) 88(5):3059–63. doi:10.1063/1.1288695
19. Nusinovich GS, Carmel Y, Antonsen TM, Goebel DM, Santoru J. Recent progress in the development of plasma-filled traveling-wave tubes and backward-wave oscillators. IEEE Trans Plasma Sci (1998) 26(3):628–45. doi:10.1109/27.700799
20. Thumm MK, Kasparek W. Passive high-power microwave components. IEEE Trans Plasma Sci (2002) 30(3):755–86. doi:10.1109/TPS.2002.801653
21. Ho C-W, Ruehli A, Brennan P. The modified nodal approach to network analysis. IEEE Trans Circuits Syst (1975) 22(6):504–9. doi:10.1109/TCS.1975.1084079
22. Li Q, Xiang F, Liu D, Liu L, Wang H. Optimization research of pulse power device based on road-field-particle collaborative simulation. IEEE Trans Plasma Sci (2023) 51(8):2237–44. doi:10.1109/TPS.2023.3297257
23. Vahedi V, Surendra M. A Monte Carlo collision model for the particle-in-cell method: applications to argon and oxygen discharges. Comp Phys Commun (1995) 87(1-2):179–98. doi:10.1016/0010-4655(94)00171-W
24. Opal CB, Peterson WK, Beaty EC. Measurements of secondary-electron spectra produced by electron impact ionization of a number of simple gases. J Chem Phys (1971) 55(8):4100–6. doi:10.1063/1.1676707
25. Kuo C-N, Houshmand B, Itoh T. FDTD analysis of active circuits with equivalent current source approach. In: Proceedings of the IEEE Antennas and Propagation Society International Symposium. 1995 Digest; June 1995; Newport Beach, CA, USA (1995). p. 1510–3. doi:10.1109/APS.1995.530863
26. Li H, Ryoo HJ, Kim JS, Rim GH, Kim YB, Deng J. Development of rectangle-pulse marx generator based on PFN. IEEE Trans Plasma Sci (2009) 37(1):190–4. doi:10.1109/TPS.2008.2007730
27. Yee K. Numerical solution of initial boundary value problems involving Maxwell’s equations in isotropic media. IEEE Trans Antennas Propag (1966) AP-14(3):302–7. doi:10.1109/TAP.1966.1138693
28. Shang ZQ. The convergence problem in SPICE. In: Proceedings of the IEE Colloquium on SPICE: Surviving Problems in Circuit Evaluation; June 1993; London, UK (1993). p. 10/1–10/5.
29. McDonald RJ. Convergence in SPICE for advanced IC device modelling. In: Proceedings of the Conference Proceedings '88., IEEE Southeastcon; April 1988; Knoxville, TN, USA (1988). p. 349–52. doi:10.1109/SECON.1988.194875
30. Wilson P, Alan Mantooth H. Chapter 3 - design analysis. In: Model-based engineering for complex electronic systems. San Francisco, California: Academia.edu (2013). p. 27–78. doi:10.1016/B978-0-12-385085-0.00003-8
31. Miller RB, Prestwich KR, Poukey JW, Shope SL. Production of annular electron beams by foilless diodes. J Appl Phys (1980) 51(7):3506–15. doi:10.1063/1.328203
32. Turchi PJ, Peterkin RE. Modeling of impedance collapse in high-voltage diodes. IEEE Trans Plasma Sci (1998) 26(5):1485–91. doi:10.1109/27.736043
33. Rose DV, Welch DR, Oliver BV, Leckbee J, Maenchen J, Johnson D, et al. Numerical analysis of a pulsed compact LTD system for electron beam-driven radiography. IEEE Trans Plasma Sci (2006) 34(5):1879–87. doi:10.1109/TPS.2006.881297
34. Carmel Y, Minami K, Kehs R, Destler W, Granatstein V, Abe D, et al. Demonstration of efficiency enhancemene in a high-power backward-wave oscillator by plasma injection. Phys Rev Lett (1989) 20:2389–392. doi:10.1103/PhysRevLett.62.2389
35. Antonsen TM, Mora P. self-focusing and Raman-scattering of laser-pulses in tenuous plasmas. Phys Rev Lett (1992) 15:2204–7. doi:10.1103/PhysRevLett.69.2204
36. Tkach Yu V, Fainberg Yu A, Magda, Igor I, Gaponenko NI, Skachek GV, et al. Microwave emission in the interaction of a high-current relativistic beam with a plasma-filled slow-wave structure. Physics.Soviet J plasma Phys (1975) 1:43. https://api.semanticscholar.org/CorpusID:119041565.
37. Wang P, Xiang F, Wang G, Tan J, Luo M, Kang Q. Analyzing and improving the output waveform of linear transformer driver cavity. IEEE Trans Plasma Sci (2020) 48(11):3950–5. doi:10.1109/TPS.2020.3027884
Keywords: road-field-PIC/MCC collaborative simulation method, linear transformer driver (LTD), electron beam generation (EBG), gas ionization, Blumlein pulse forming network (BPFN)
Citation: Li Q, Liu D, Xiang F, Liu L and Wang H (2024) Research on the influence of gas ionization on pulse forming in linear transformer driver (LTD) electron beam generator. Front. Phys. 11:1329584. doi: 10.3389/fphy.2023.1329584
Received: 29 October 2023; Accepted: 21 December 2023;
Published: 11 January 2024.
Edited by:
Mohamed Mokhtar Hefny, Future University in Egypt, EgyptCopyright © 2024 Li, Liu, Xiang, Liu and Wang. This is an open-access article distributed under the terms of the Creative Commons Attribution License (CC BY). The use, distribution or reproduction in other forums is permitted, provided the original author(s) and the copyright owner(s) are credited and that the original publication in this journal is cited, in accordance with accepted academic practice. No use, distribution or reproduction is permitted which does not comply with these terms.
*Correspondence: Qiang Li, MTk0NTAwNzYyNUBxcS5jb20=